| Param | Original file | Final file |
|---|---|---|
| Filename | modeM0/AS1A02_055T01_9000001114_08099cztM0_level2.evt | modeM0/AS1A02_055T01_9000001114_08099cztM0_level2_quad_clean.evt |
| Size (bytes) | 1,330,908,480 | 255,257,280 |
| Size | 1.2 GB | 243.4 MB |
| Events in quadrant A | 8,806,848 | 1,578,522 |
| Events in quadrant B | 9,233,859 | 1,624,197 |
| Events in quadrant C | 9,457,789 | 1,635,744 |
| Events in quadrant D | 11,494,091 | 1,553,924 |
| Mode M0 | |||
|---|---|---|---|
| Quadrant | BADHDUFLAG | Total packets | Discarded packets |
| A | 0 | 39739 | 5 |
| B | 0 | 40505 | 4 |
| C | 0 | 41570 | 4 |
| D | 0 | 48114 | 4 |
| Mode M9 | |||
|---|---|---|---|
| Quadrant | BADHDUFLAG | Total packets | Discarded packets |
| A | 0 | 17 | 0 |
| B | 0 | 17 | 0 |
| C | 0 | 17 | 0 |
| D | 0 | 17 | 0 |
| Mode SS | |||
|---|---|---|---|
| Quadrant | BADHDUFLAG | Total packets | Discarded packets |
| A | 0 | 394 | 0 |
| B | 0 | 394 | 0 |
| C | 0 | 394 | 0 |
| D | 0 | 394 | 0 |
| Quadrant | Total seconds | Saturated seconds | Saturation percentage |
|---|---|---|---|
| A | 19437 | 229 | 1.178165% |
| B | 19437 | 257 | 1.322221% |
| C | 19437 | 213 | 1.095848% |
| D | 19437 | 443 | 2.279158% |
Noise dominated data is calculated using 1-second bins in cleaned event files. If a bin has >2000 counts, and if more than 50% of those come from <1% of pixels, then it is considered to be noise-dominated and hence unusable.
| Quadrant | # 1 sec bins | Bins with >0 counts | Bins with >2000 counts | High rate bins dominated by noise | Noise dominated (total time) | Noise dominated (detector-on time) | Marked lightcurve |
|---|---|---|---|---|---|---|---|
| A | 21117 | 19441 | 0 | 0 | 0.00% | 0.00% | 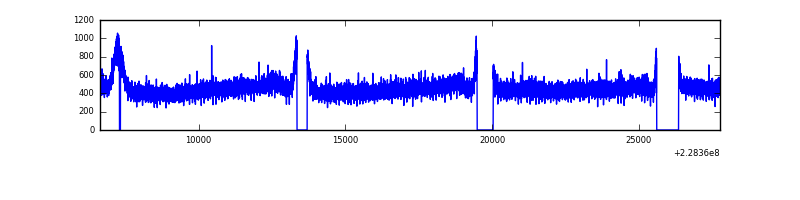 |
| B | 21117 | 19441 | 11 | 11 | 0.05% | 0.06% |  |
| C | 21117 | 19441 | 83 | 83 | 0.39% | 0.43% | 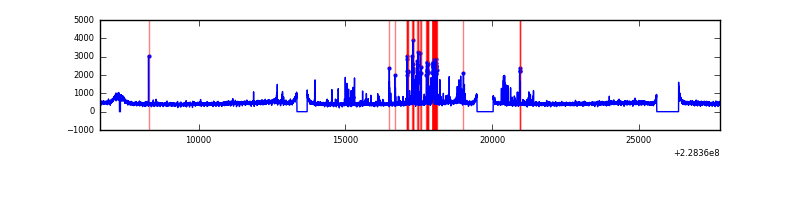 |
| D | 21117 | 19441 | 219 | 219 | 1.04% | 1.13% | 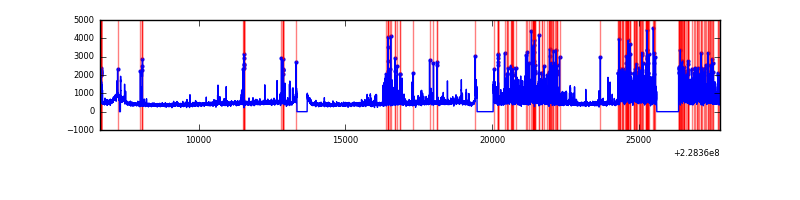 |
Top three noisy pixels from each quadrant. If the there are fewer than three noisy pixels in the level2.evt file, extra rows are filled as -1
| Pixel properties | Quadrant properties | ||||||
|---|---|---|---|---|---|---|---|
| Quadrant | DetID | PixID | Counts | Sigma | Mean | Median | Sigma |
| A | 0 | 226 | 21500 | 40.9 | 2284 | 2226 | 471.2 |
| A | 12 | 194 | 20301 | 38.36 | 2284 | 2226 | 471.2 |
| A | 13 | 251 | 11130 | 18.9 | 2284 | 2226 | 471.2 |
| B | 0 | 214 | 115125 | 255.48 | 2305 | 2248 | 441.8 |
| B | 11 | 51 | 76290 | 167.58 | 2305 | 2248 | 441.8 |
| B | 10 | 16 | 62728 | 136.88 | 2305 | 2248 | 441.8 |
| C | 0 | 224 | 586857 | 1132.73 | 2234 | 2240 | 516.1 |
| C | 1 | 16 | 117359 | 223.05 | 2234 | 2240 | 516.1 |
| C | 8 | 128 | 17319 | 29.22 | 2234 | 2240 | 516.1 |
| D | 1 | 52 | 2680543 | 4607.63 | 2201 | 2145 | 581.3 |
| D | 7 | 71 | 123823 | 209.32 | 2201 | 2145 | 581.3 |
| D | 5 | 233 | 112313 | 189.52 | 2201 | 2145 | 581.3 |
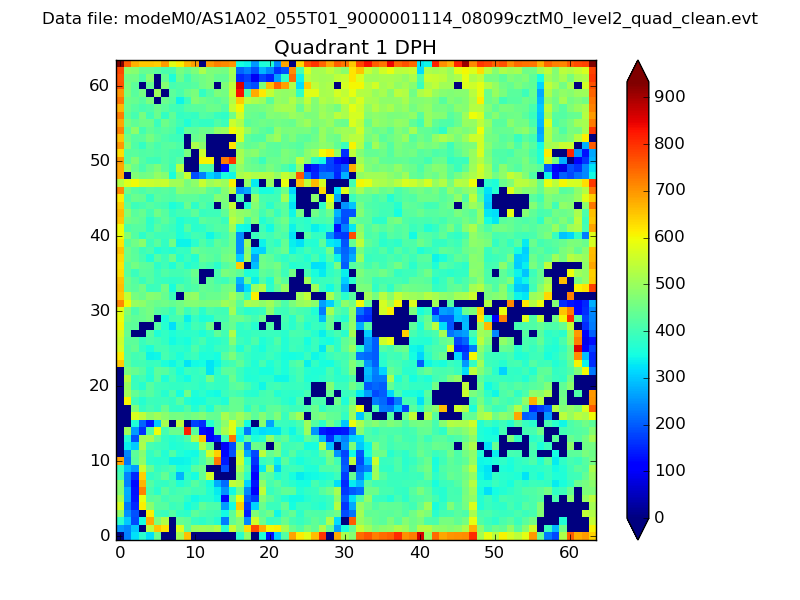
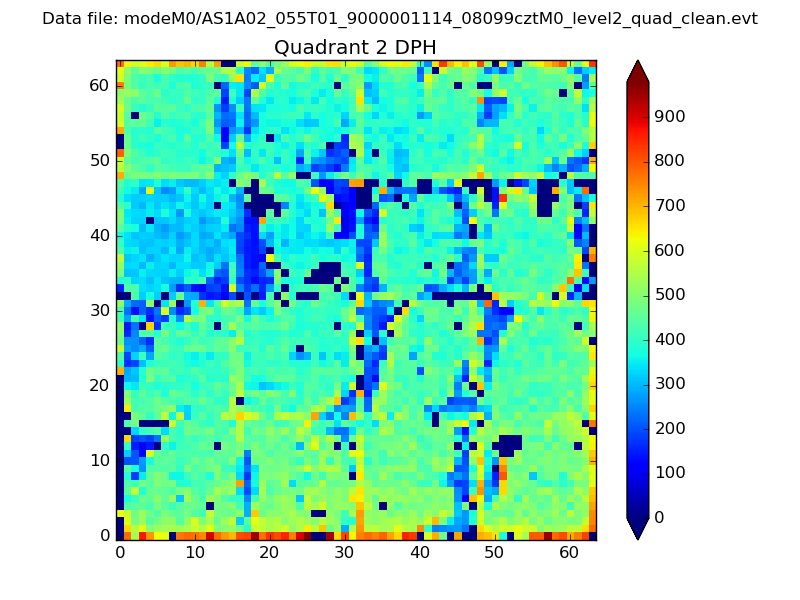
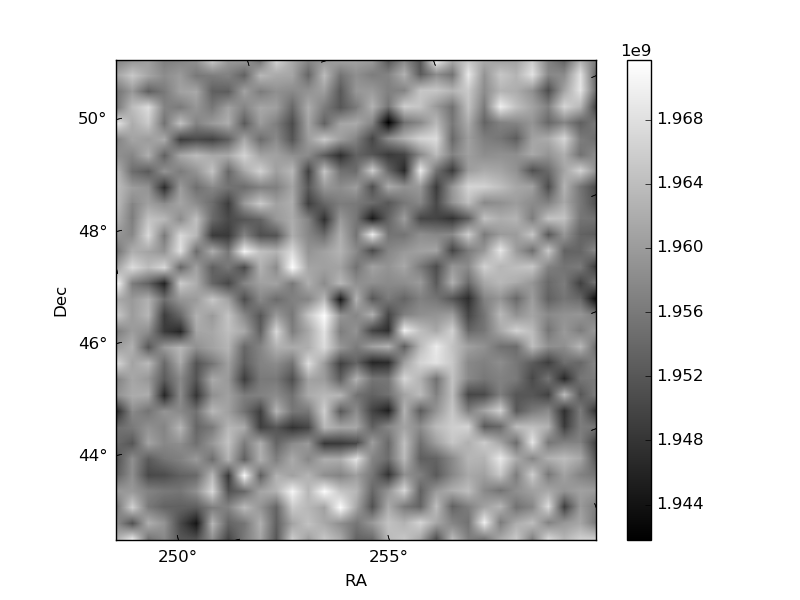
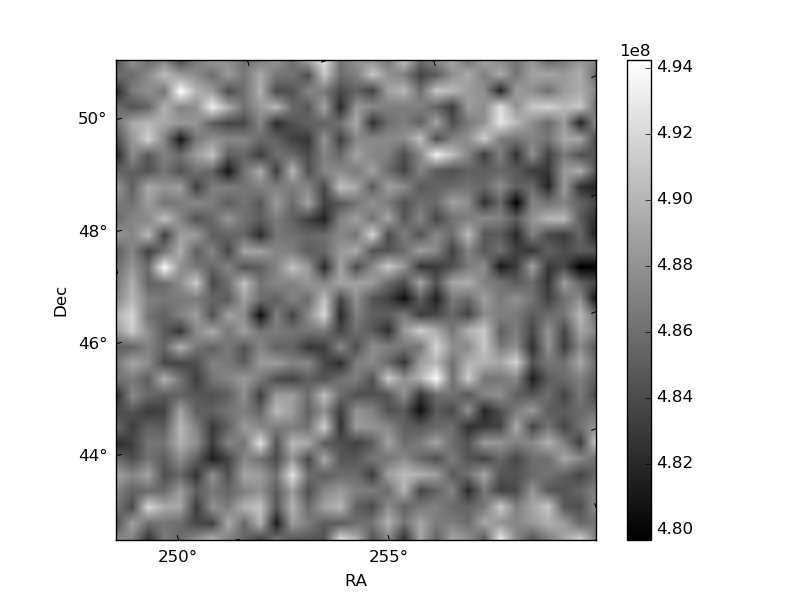
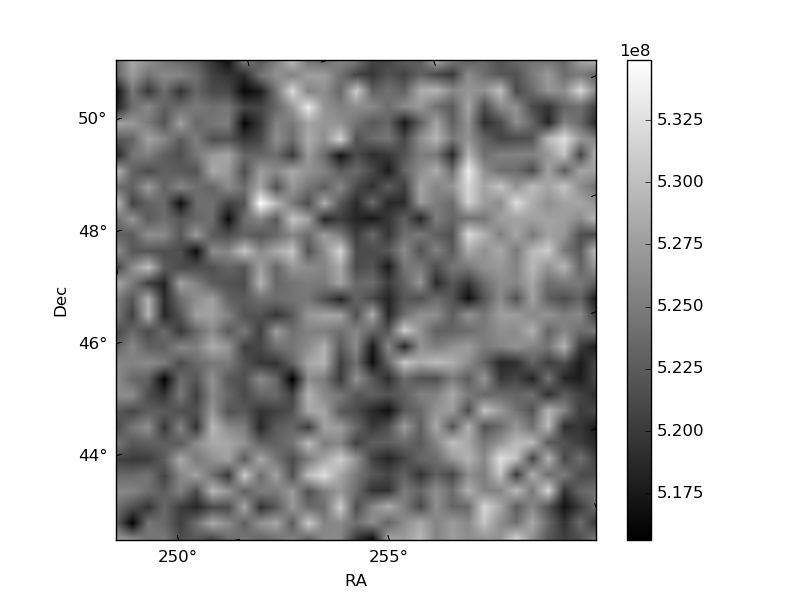
Histogram calculated using DETX and DETY for each event in the final _common_clean file
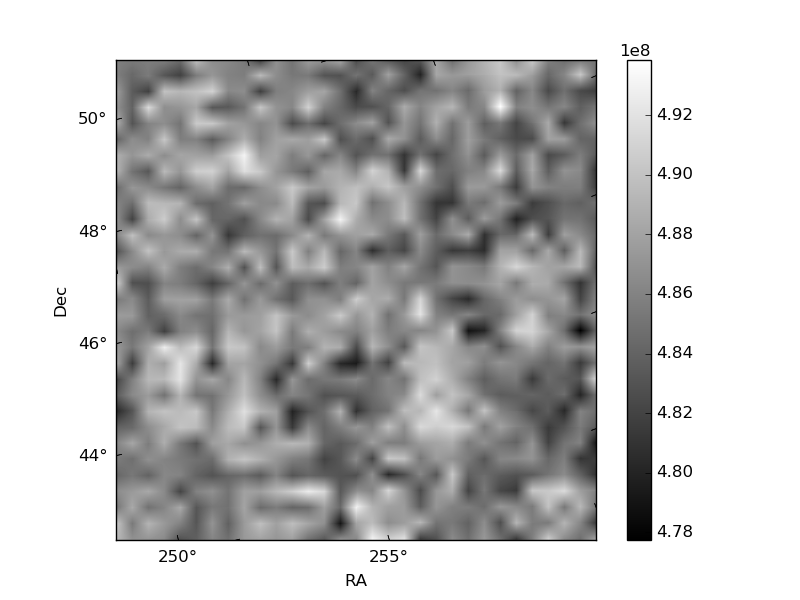
| Quadrant A | 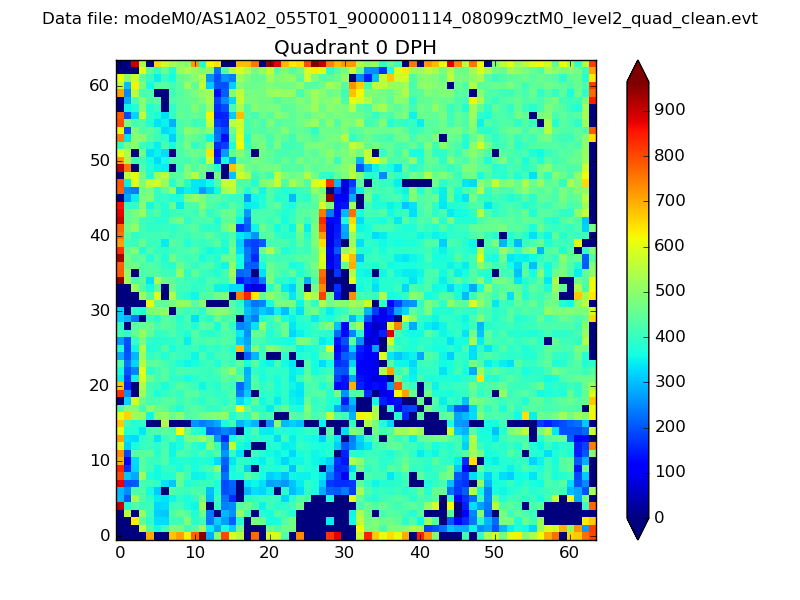 |
 |
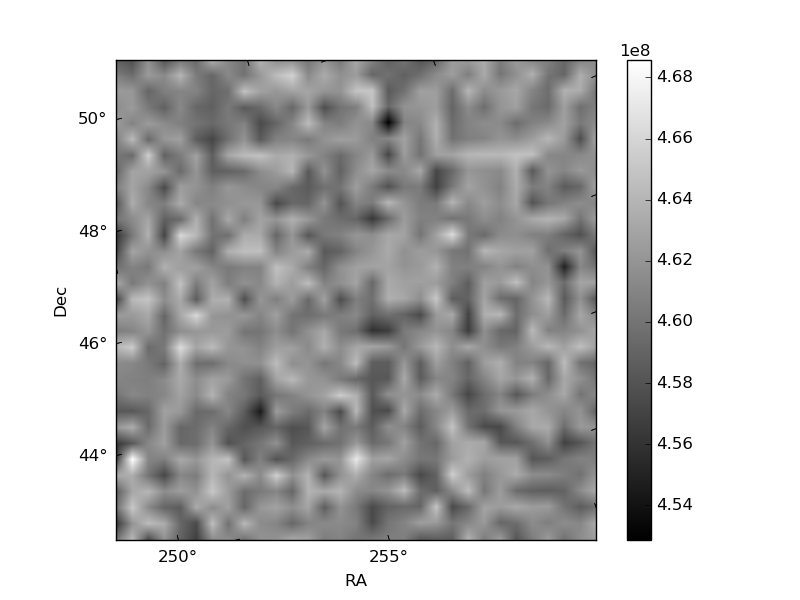
Quadrant B |
|---|---|---|---|
| Quadrant D | 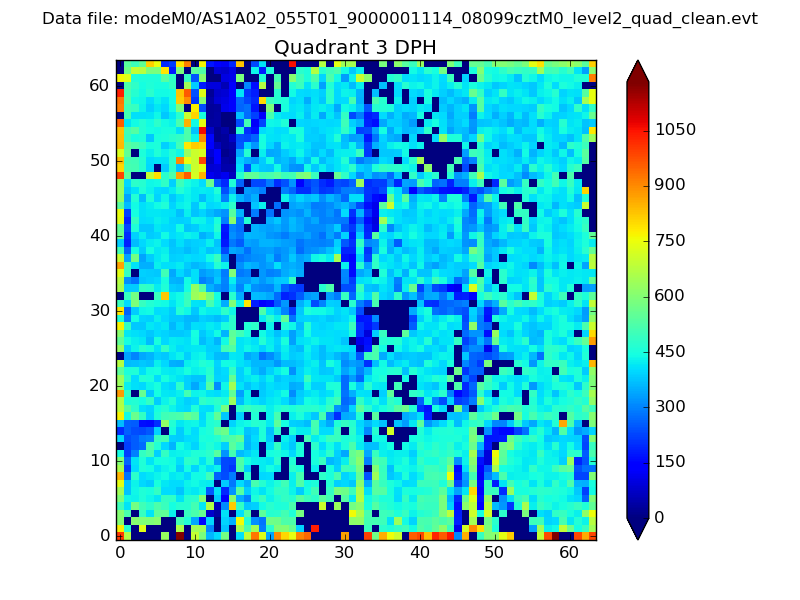 |
 |
Quadrant C |
| Plot type | Count rate plots | Images |
|---|---|---|
| Comparison with Poisson distribution Blue bars denote a histogram of data divided into 1 sec bins. Red curve is a Poisson curve with rate = median count rate of data. |
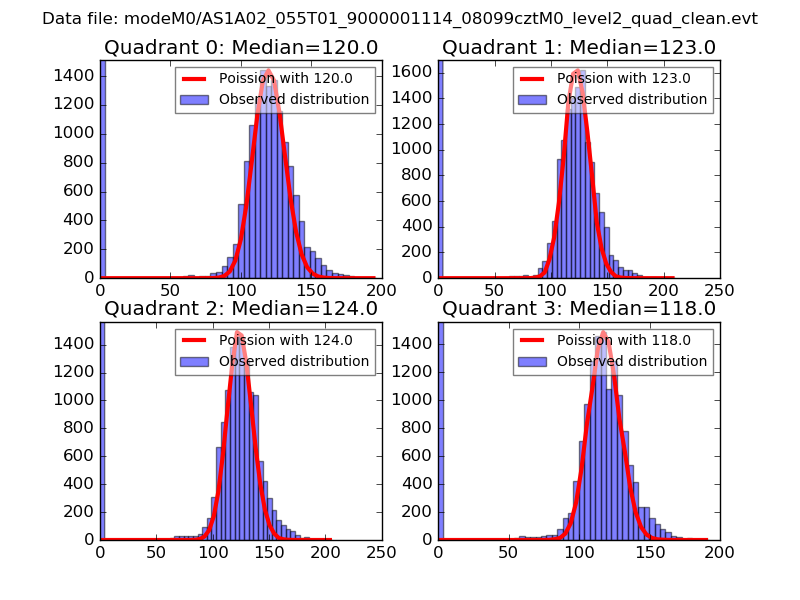 |
 |
| Quadrant-wise count rates Data is divided into 100 sec bins |
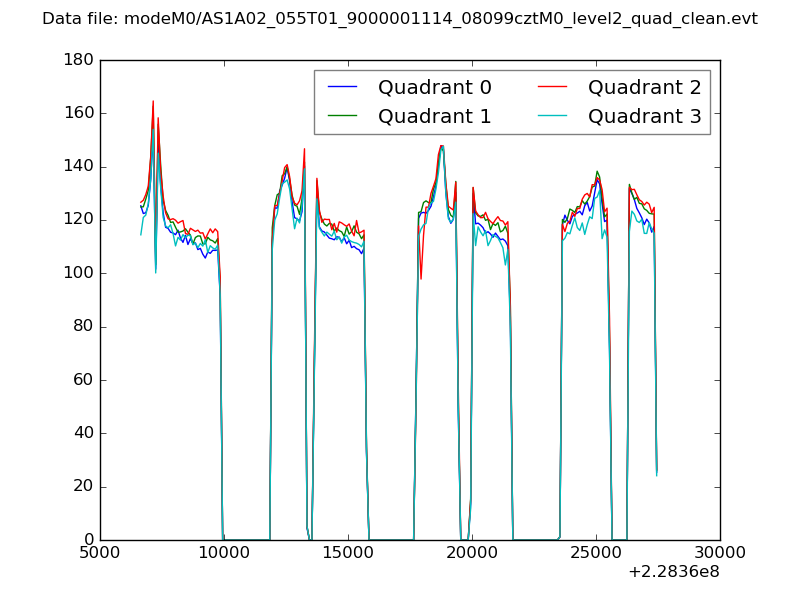 |
|
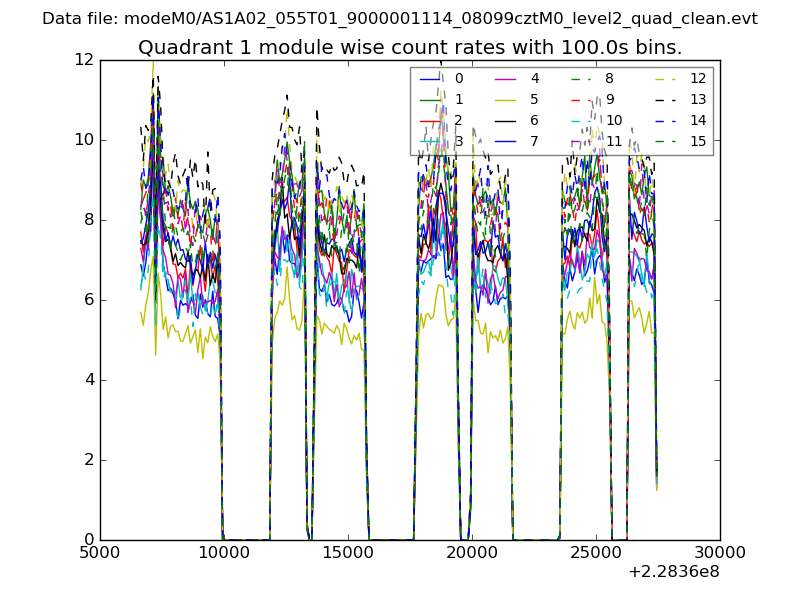
| Module-wise count rates for Quadrant A Data is divided into 100 sec bins |
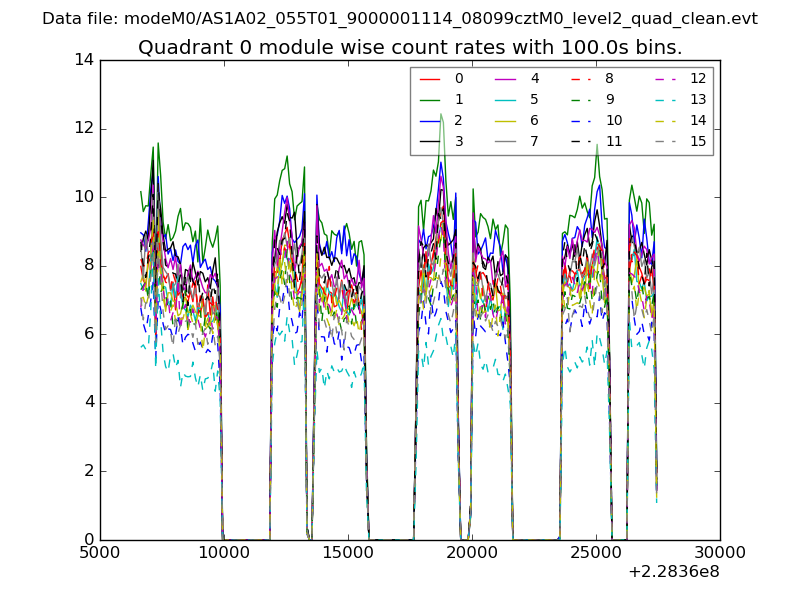 |
 |
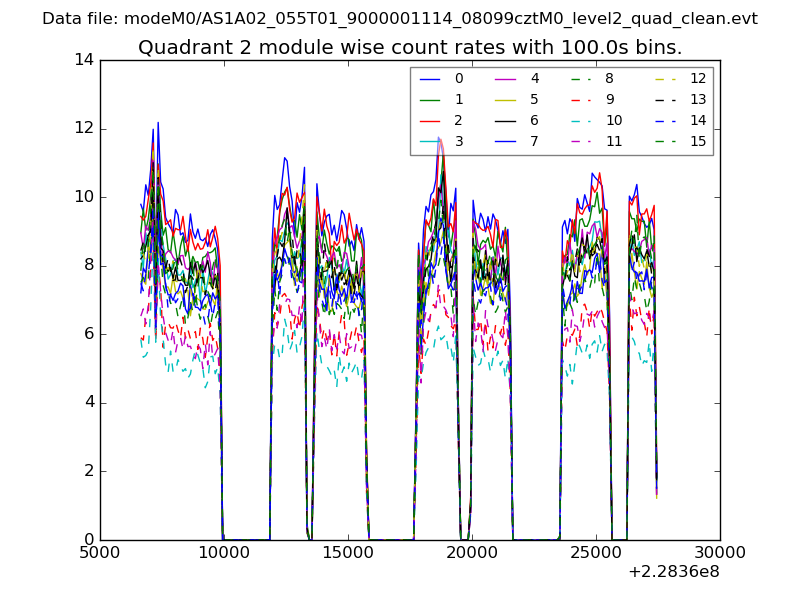
| Module-wise count rates for Quadrant B Data is divided into 100 sec bins |
 |
 |
| Module-wise count rates for Quadrant C Data is divided into 100 sec bins |
 |
 |
| Module-wise count rates for Quadrant D Data is divided into 100 sec bins |
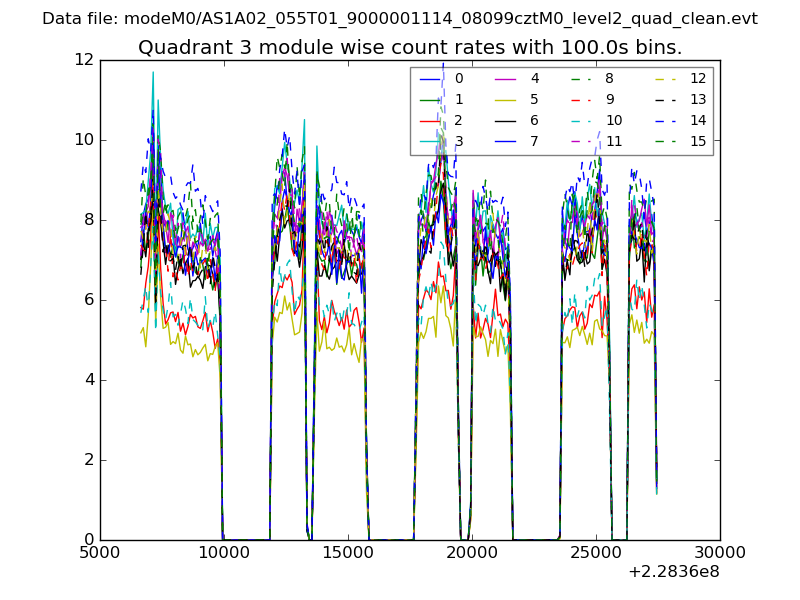 |
 |
| Parameter | Plot |
|---|---|
| CZT HV Monitor | 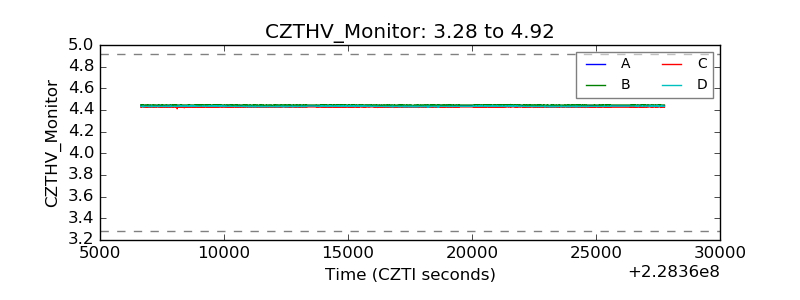 |
| D_VDD | 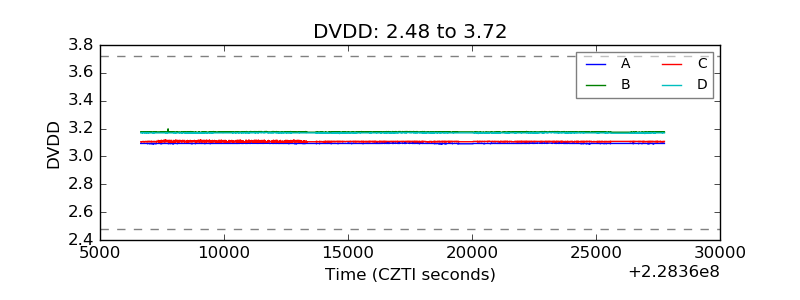 |
| Temperature 1 | 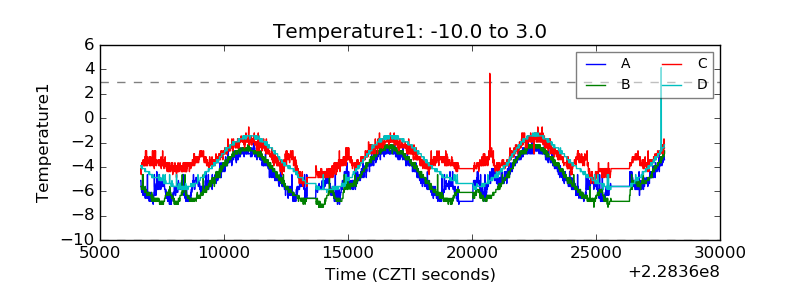 |
| Veto HV Monitor | 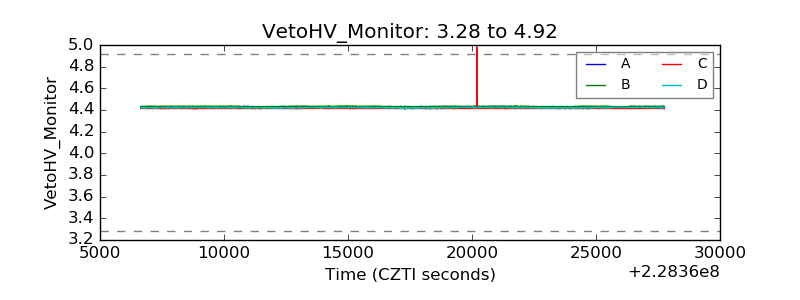 |
| Veto LLD | 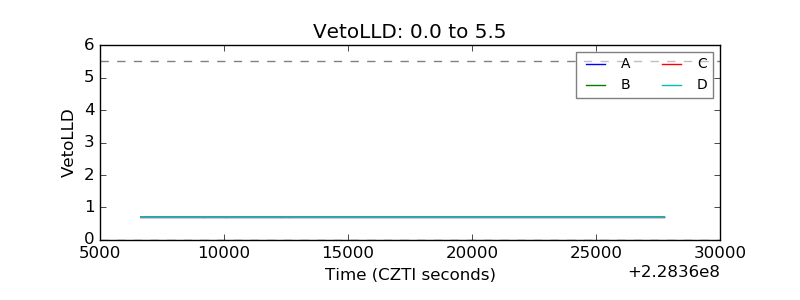 |
| Alpha Counter | 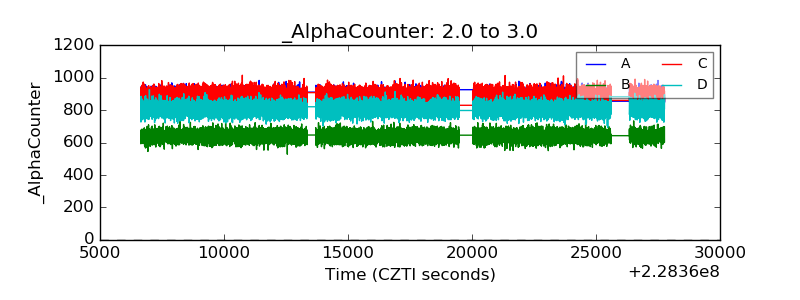 |
| _CPM_Rate | 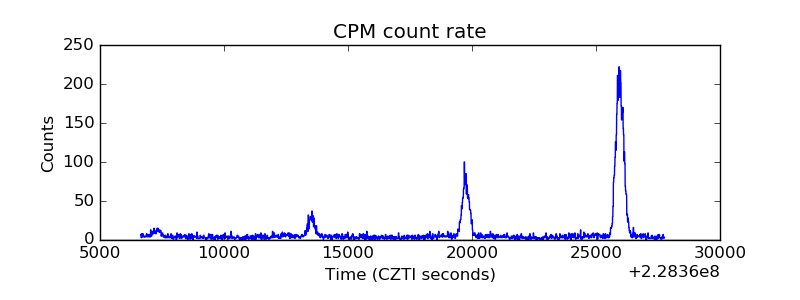 |
| CZT Counter | 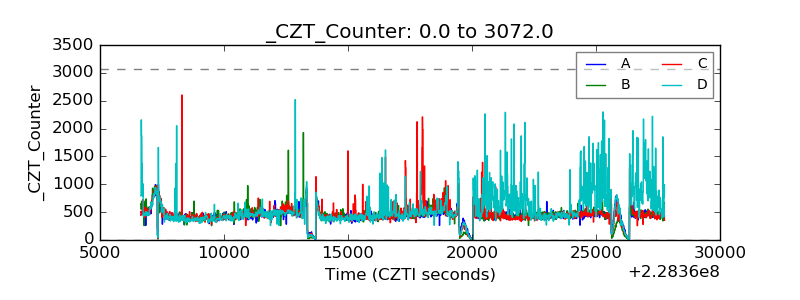 |
| +2.5 Volts monitor |  |
| +5 Volts monitor |  |
| _ROLL_ROT | 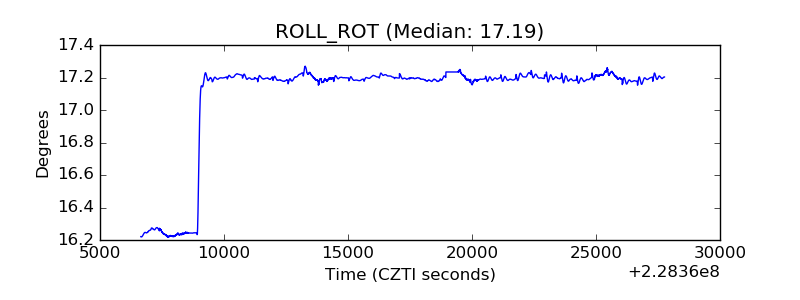 |
| _Roll_DEC |  |
| _Roll_RA | 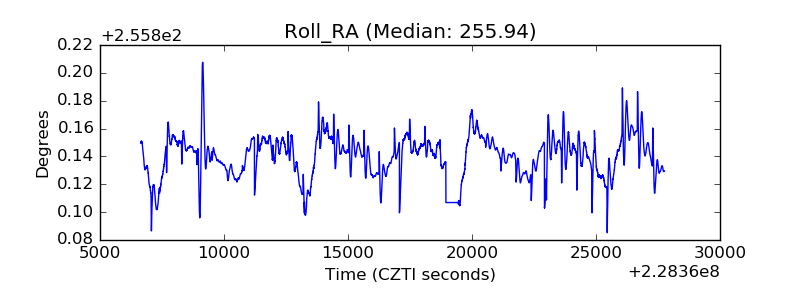 |
| Veto Counter | 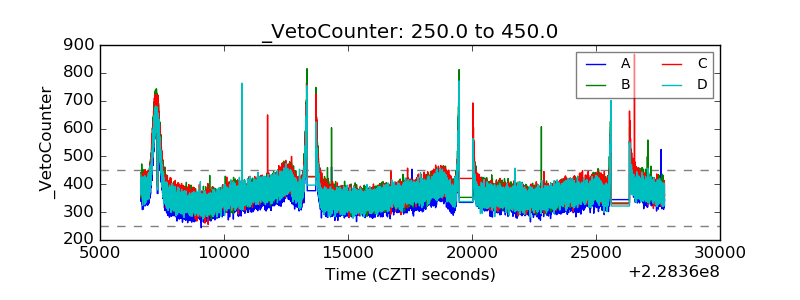 |