| Param | Original file | Final file |
|---|---|---|
| Filename | modeM0/AS1A02_055T01_9000001114_08102cztM0_level2.evt | modeM0/AS1A02_055T01_9000001114_08102cztM0_level2_quad_clean.evt |
| Size (bytes) | 464,281,920 | 73,080,000 |
| Size | 442.8 MB | 69.7 MB |
| Events in quadrant A | 3,119,100 | 436,128 |
| Events in quadrant B | 3,255,823 | 445,088 |
| Events in quadrant C | 3,124,902 | 446,838 |
| Events in quadrant D | 4,111,719 | 423,728 |
| Mode M0 | |||
|---|---|---|---|
| Quadrant | BADHDUFLAG | Total packets | Discarded packets |
| A | 0 | 13628 | 2 |
| B | 0 | 13830 | 1 |
| C | 0 | 13641 | 1 |
| D | 0 | 16706 | 1 |
| Mode M9 | |||
|---|---|---|---|
| Quadrant | BADHDUFLAG | Total packets | Discarded packets |
| A | 0 | 10 | 0 |
| B | 0 | 10 | 0 |
| C | 0 | 10 | 0 |
| D | 0 | 10 | 0 |
| Mode SS | |||
|---|---|---|---|
| Quadrant | BADHDUFLAG | Total packets | Discarded packets |
| A | 0 | 134 | 0 |
| B | 0 | 134 | 0 |
| C | 0 | 134 | 0 |
| D | 0 | 134 | 0 |
| Quadrant | Total seconds | Saturated seconds | Saturation percentage |
|---|---|---|---|
| A | 6610 | 88 | 1.331316% |
| B | 6610 | 92 | 1.391831% |
| C | 6610 | 72 | 1.089259% |
| D | 6610 | 312 | 4.720121% |
Noise dominated data is calculated using 1-second bins in cleaned event files. If a bin has >2000 counts, and if more than 50% of those come from <1% of pixels, then it is considered to be noise-dominated and hence unusable.
| Quadrant | # 1 sec bins | Bins with >0 counts | Bins with >2000 counts | High rate bins dominated by noise | Noise dominated (total time) | Noise dominated (detector-on time) | Marked lightcurve |
|---|---|---|---|---|---|---|---|
| A | 7630 | 6610 | 0 | 0 | 0.00% | 0.00% | 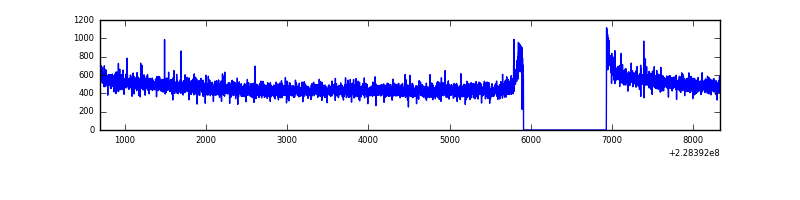 |
| B | 7630 | 6610 | 0 | 0 | 0.00% | 0.00% | 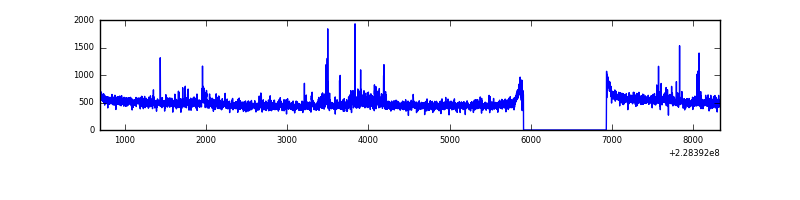 |
| C | 7630 | 6610 | 0 | 0 | 0.00% | 0.00% | 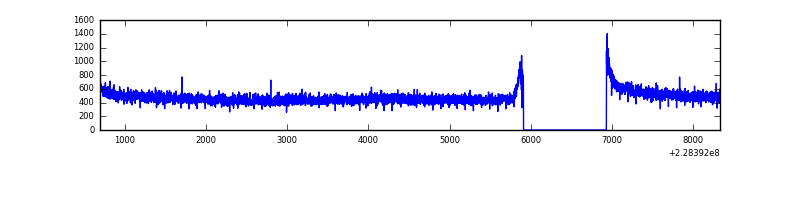 |
| D | 7630 | 6610 | 227 | 227 | 2.98% | 3.43% | 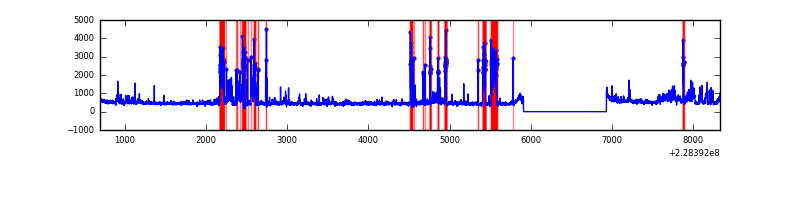 |
Top three noisy pixels from each quadrant. If the there are fewer than three noisy pixels in the level2.evt file, extra rows are filled as -1
| Pixel properties | Quadrant properties | ||||||
|---|---|---|---|---|---|---|---|
| Quadrant | DetID | PixID | Counts | Sigma | Mean | Median | Sigma |
| A | 0 | 226 | 7498 | 40.79 | 809 | 793 | 164.4 |
| A | 12 | 194 | 7276 | 39.44 | 809 | 793 | 164.4 |
| A | 0 | 128 | 3074 | 13.88 | 809 | 793 | 164.4 |
| B | 0 | 214 | 40775 | 257.78 | 811 | 793 | 155.1 |
| B | 11 | 51 | 37191 | 234.67 | 811 | 793 | 155.1 |
| B | 12 | 111 | 16364 | 100.39 | 811 | 793 | 155.1 |
| C | 1 | 16 | 69261 | 379.74 | 783 | 784 | 180.3 |
| C | 13 | 61 | 6040 | 29.15 | 783 | 784 | 180.3 |
| C | 14 | 67 | 2056 | 7.05 | 783 | 784 | 180.3 |
| D | 1 | 52 | 868676 | 4492.27 | 772 | 752 | 193.2 |
| D | 12 | 227 | 180796 | 931.89 | 772 | 752 | 193.2 |
| D | 5 | 233 | 104450 | 536.73 | 772 | 752 | 193.2 |
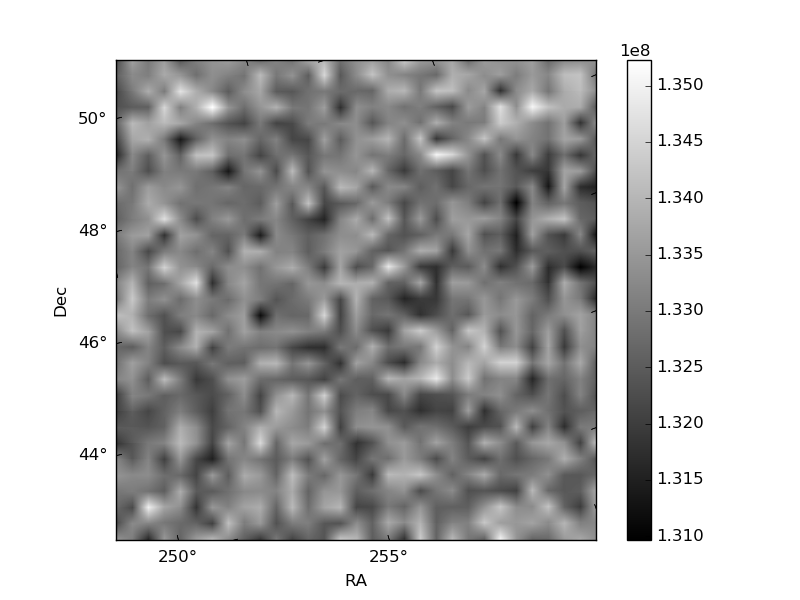
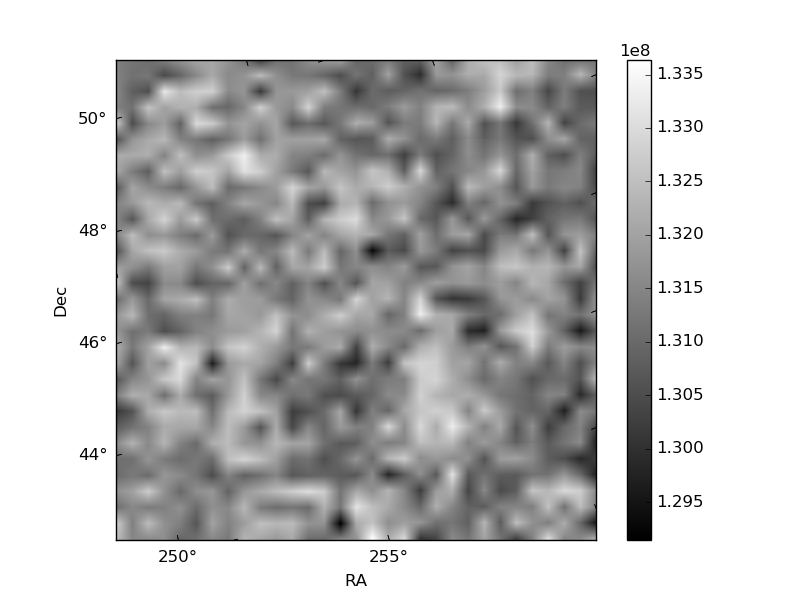
Histogram calculated using DETX and DETY for each event in the final _common_clean file
| Quadrant A |  |
 |
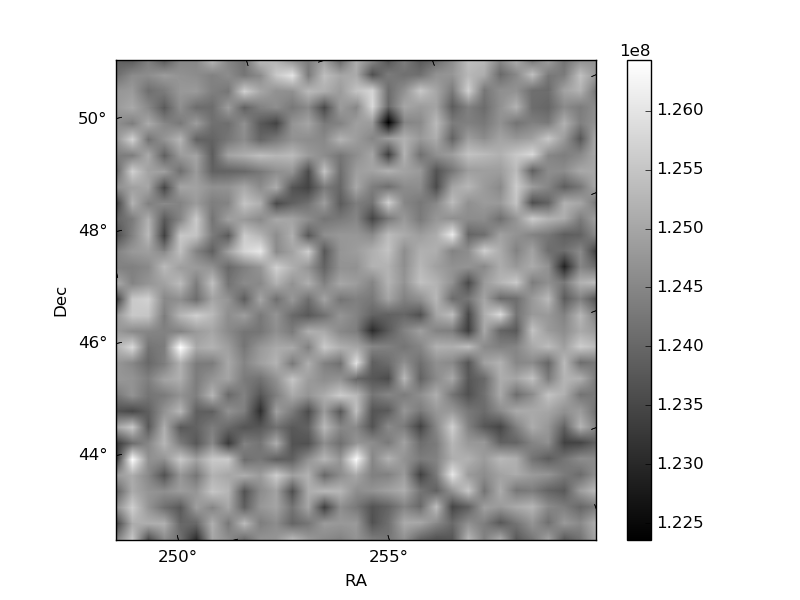
Quadrant B |
|---|---|---|---|
| Quadrant D | 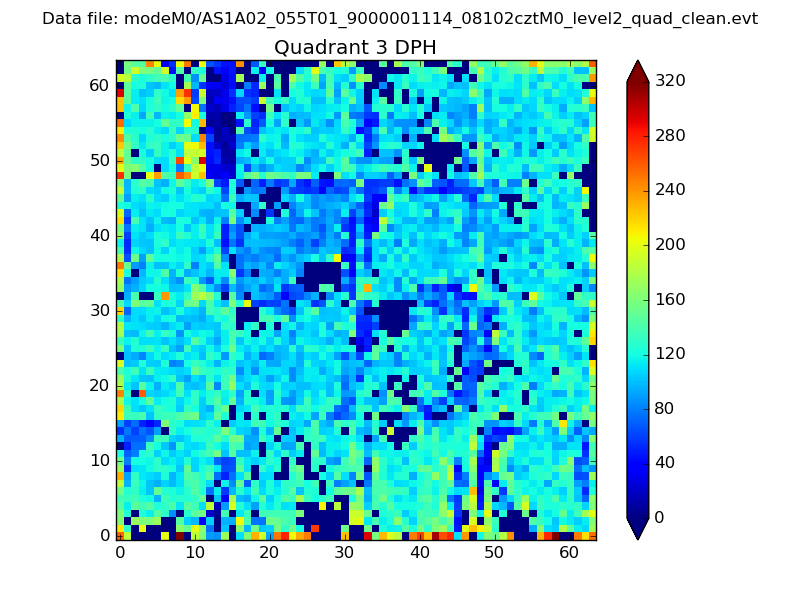 |
 |
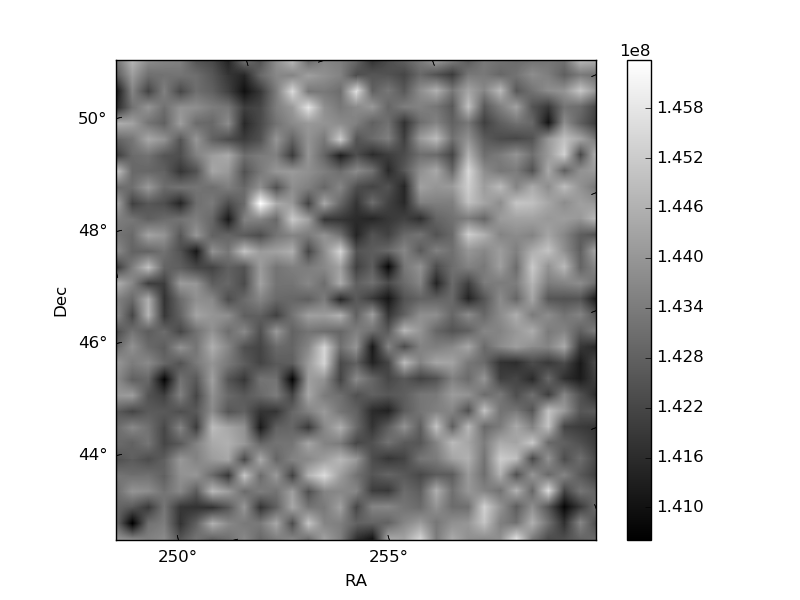
Quadrant C |
| Plot type | Count rate plots | Images |
|---|---|---|
| Comparison with Poisson distribution Blue bars denote a histogram of data divided into 1 sec bins. Red curve is a Poisson curve with rate = median count rate of data. |
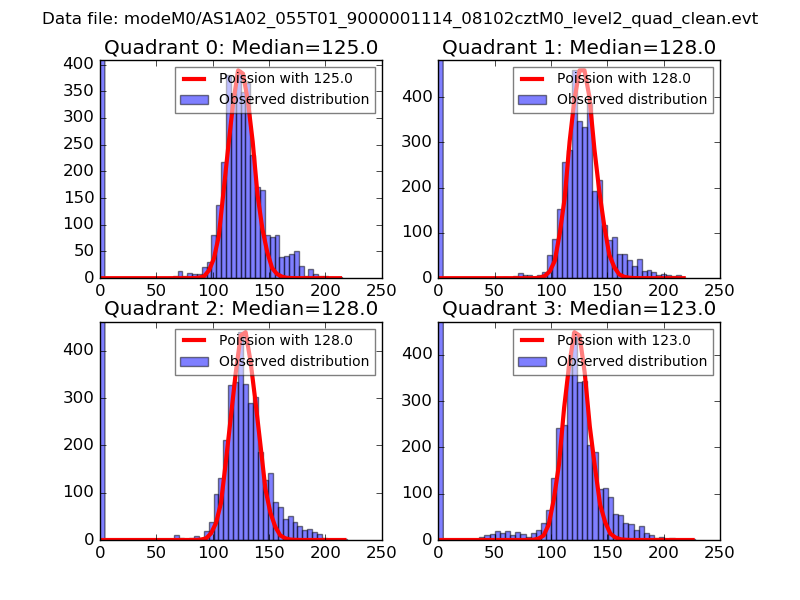 |
 |
| Quadrant-wise count rates Data is divided into 100 sec bins |
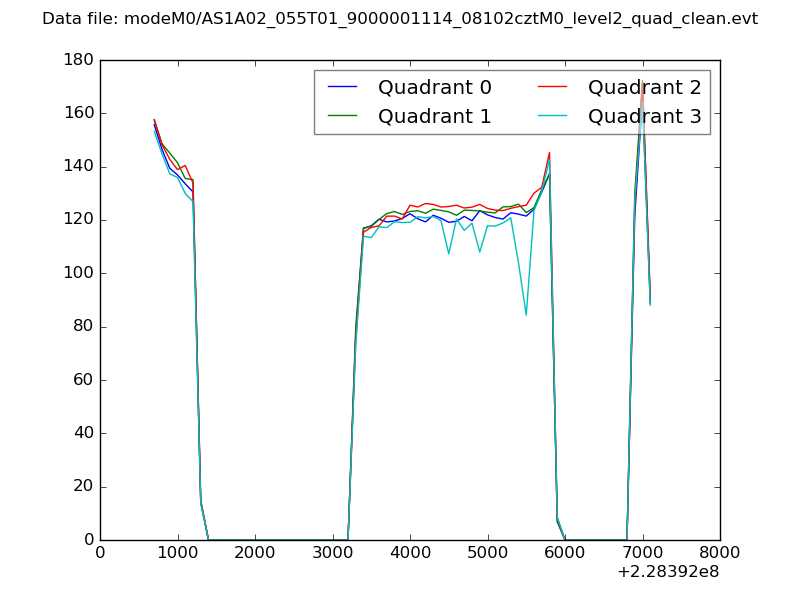 |
|
| Module-wise count rates for Quadrant A Data is divided into 100 sec bins |
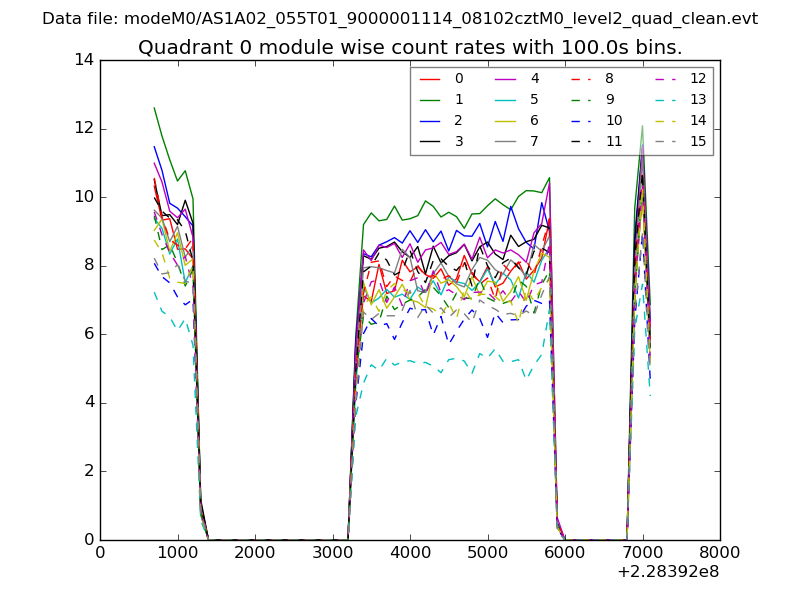 |
 |
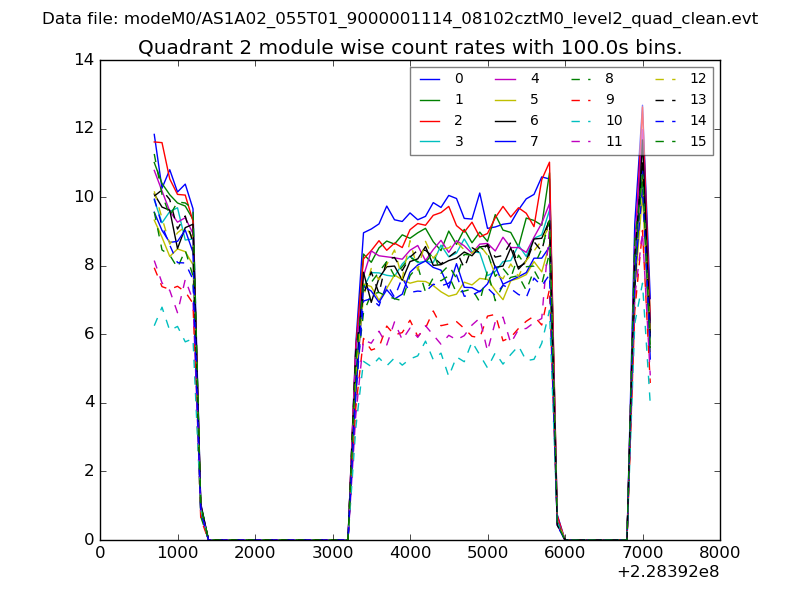
| Module-wise count rates for Quadrant B Data is divided into 100 sec bins |
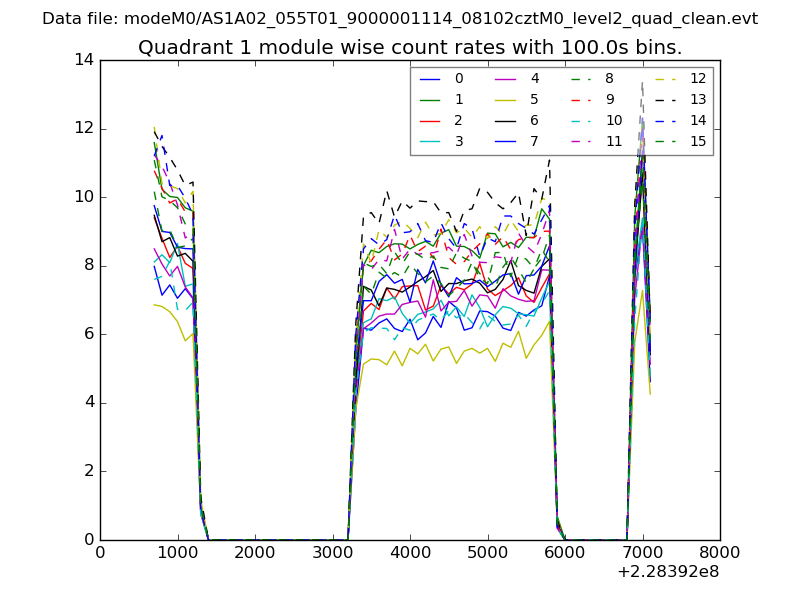 |
 |
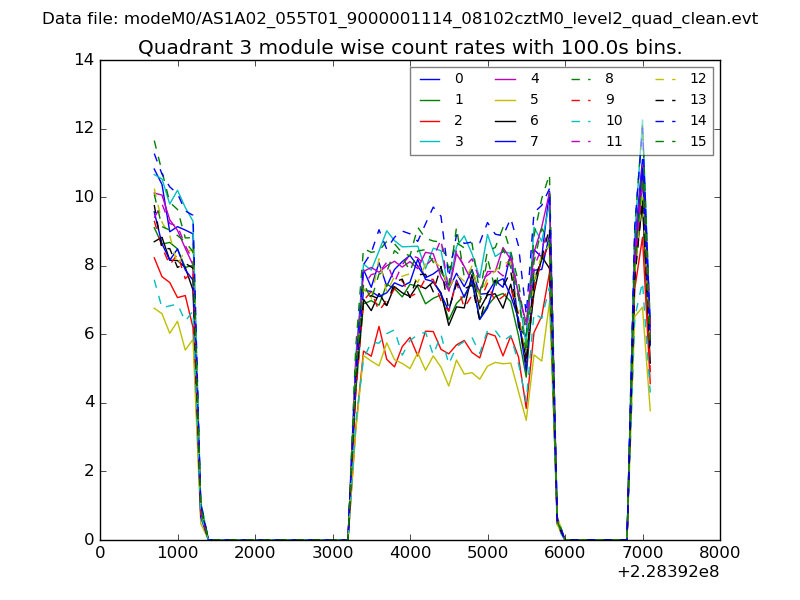
| Module-wise count rates for Quadrant C Data is divided into 100 sec bins |
 |
 |
| Module-wise count rates for Quadrant D Data is divided into 100 sec bins |
 |
 |
| Parameter | Plot |
|---|---|
| CZT HV Monitor | 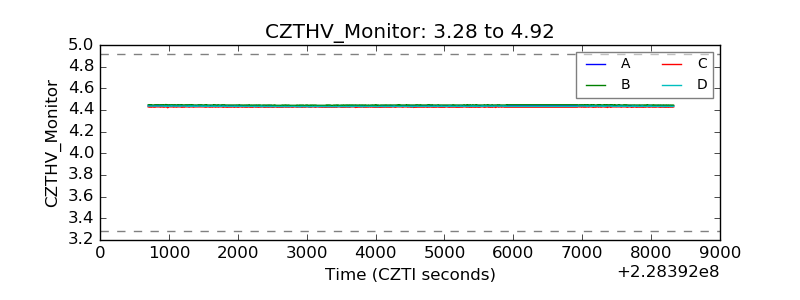 |
| D_VDD | 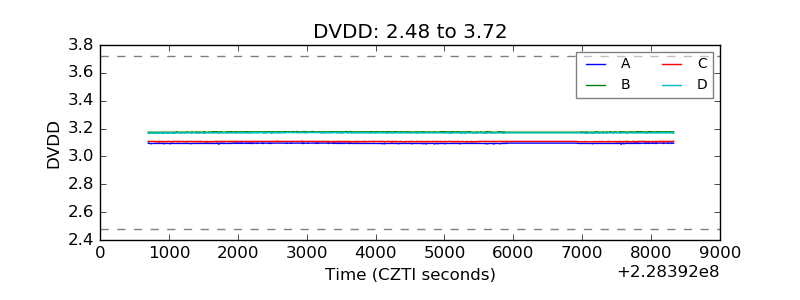 |
| Temperature 1 |  |
| Veto HV Monitor | 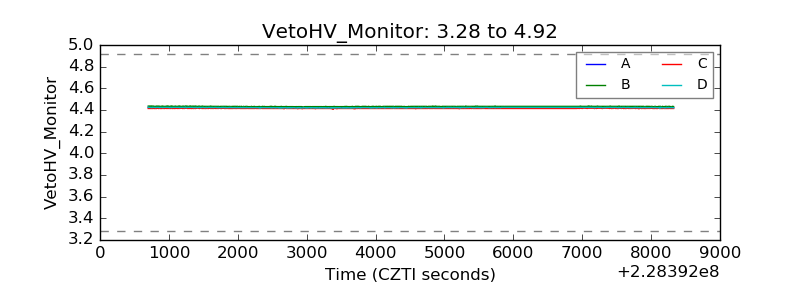 |
| Veto LLD | 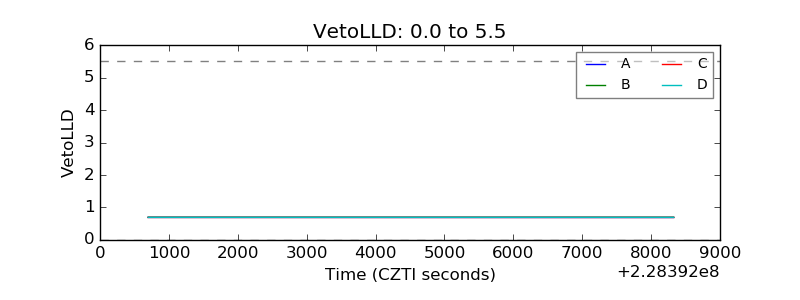 |
| Alpha Counter | 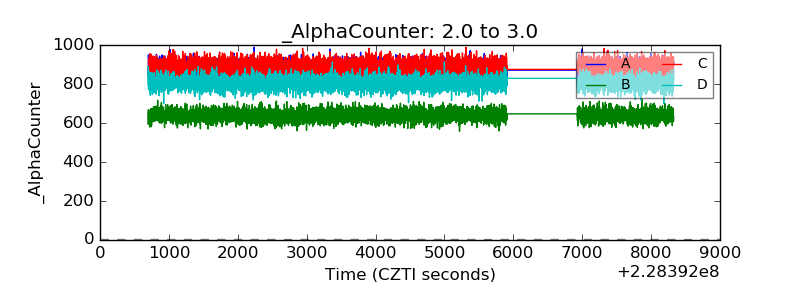 |
| _CPM_Rate | 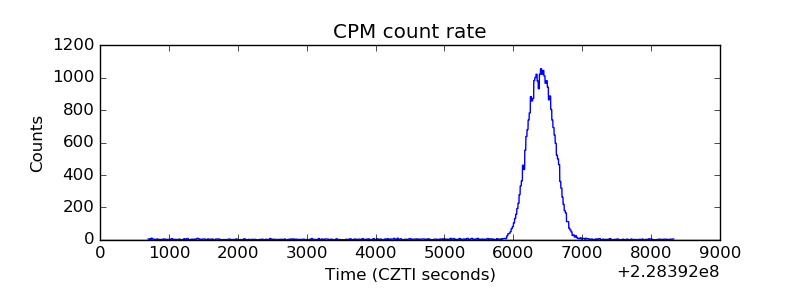 |
| CZT Counter | 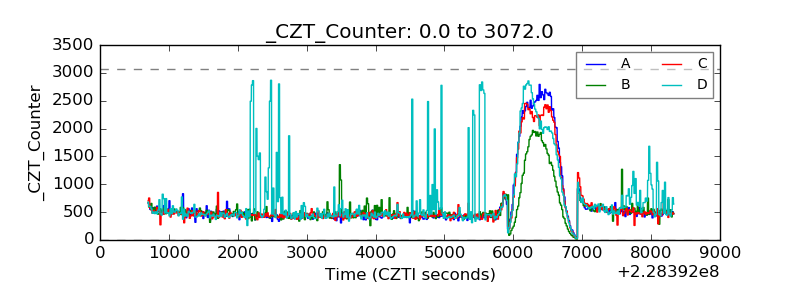 |
| +2.5 Volts monitor |  |
| +5 Volts monitor |  |
| _ROLL_ROT | 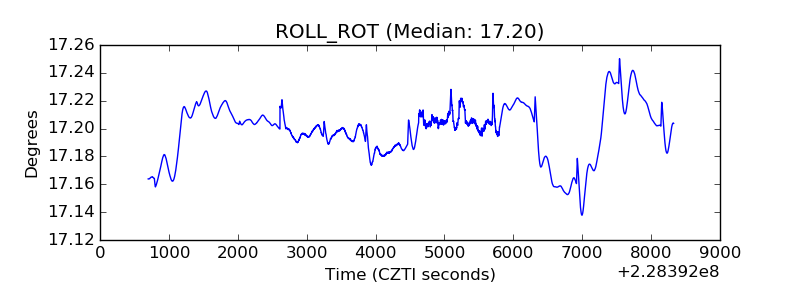 |
| _Roll_DEC | 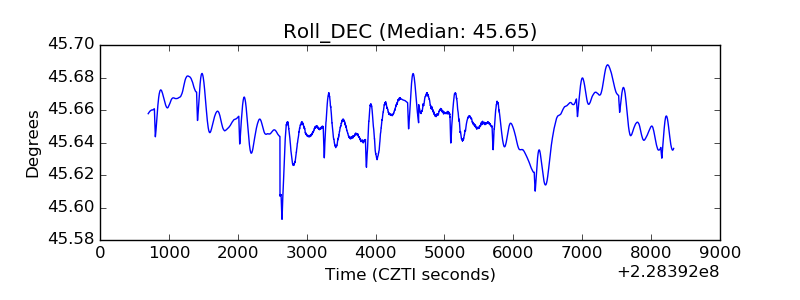 |
| _Roll_RA | 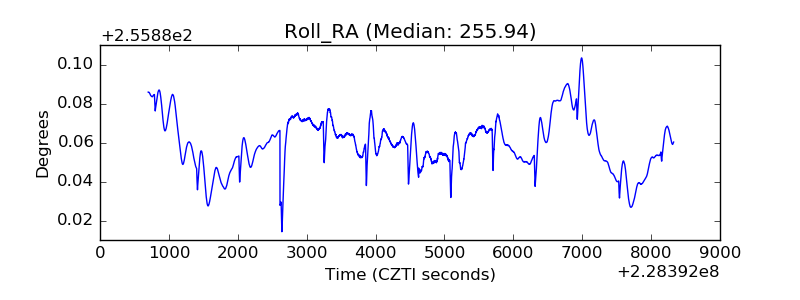 |
| Veto Counter | 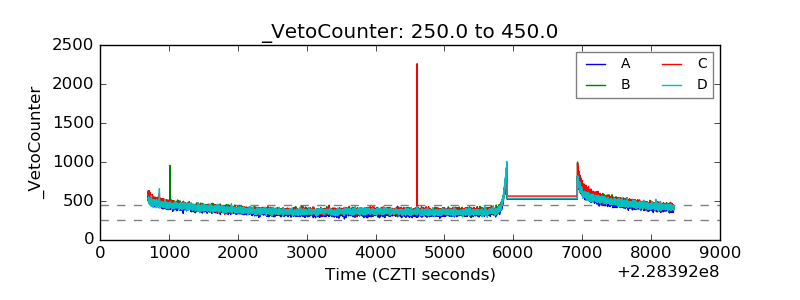 |