| Param | Original file | Final file |
|---|---|---|
| Filename | modeM0/AS1A02_055T01_9000001114_08103cztM0_level2.evt | modeM0/AS1A02_055T01_9000001114_08103cztM0_level2_quad_clean.evt |
| Size (bytes) | 546,382,080 | 66,144,960 |
| Size | 521.1 MB | 63.1 MB |
| Events in quadrant A | 3,262,972 | 394,970 |
| Events in quadrant B | 3,346,670 | 401,283 |
| Events in quadrant C | 3,256,369 | 402,850 |
| Events in quadrant D | 6,237,334 | 347,248 |
| Mode M0 | |||
|---|---|---|---|
| Quadrant | BADHDUFLAG | Total packets | Discarded packets |
| A | 0 | 14080 | 3 |
| B | 0 | 14107 | 2 |
| C | 0 | 13948 | 2 |
| D | 0 | 22959 | 2 |
| Mode M9 | |||
|---|---|---|---|
| Quadrant | BADHDUFLAG | Total packets | Discarded packets |
| A | 0 | 12 | 0 |
| B | 0 | 12 | 0 |
| C | 0 | 12 | 0 |
| D | 0 | 12 | 0 |
| Mode SS | |||
|---|---|---|---|
| Quadrant | BADHDUFLAG | Total packets | Discarded packets |
| A | 0 | 132 | 0 |
| B | 0 | 132 | 0 |
| C | 0 | 132 | 0 |
| D | 0 | 132 | 0 |
| Quadrant | Total seconds | Saturated seconds | Saturation percentage |
|---|---|---|---|
| A | 6542 | 97 | 1.482727% |
| B | 6542 | 93 | 1.421584% |
| C | 6542 | 83 | 1.268725% |
| D | 6542 | 1244 | 19.015592% |
Noise dominated data is calculated using 1-second bins in cleaned event files. If a bin has >2000 counts, and if more than 50% of those come from <1% of pixels, then it is considered to be noise-dominated and hence unusable.
| Quadrant | # 1 sec bins | Bins with >0 counts | Bins with >2000 counts | High rate bins dominated by noise | Noise dominated (total time) | Noise dominated (detector-on time) | Marked lightcurve |
|---|---|---|---|---|---|---|---|
| A | 7697 | 6542 | 0 | 0 | 0.00% | 0.00% | 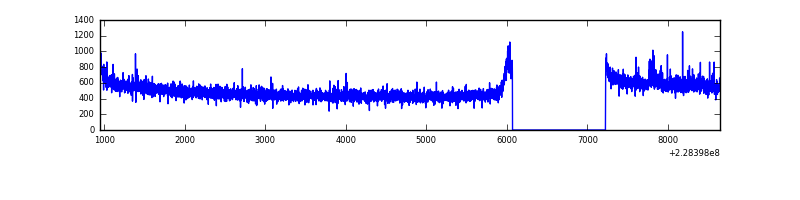 |
| B | 7697 | 6542 | 4 | 4 | 0.05% | 0.06% | 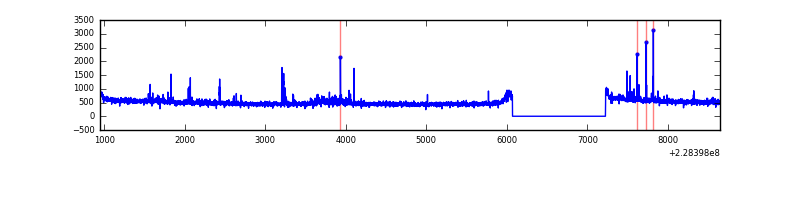 |
| C | 7697 | 6542 | 0 | 0 | 0.00% | 0.00% | 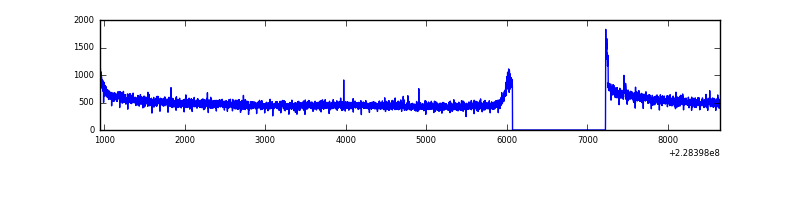 |
| D | 7697 | 6542 | 1115 | 1115 | 14.49% | 17.04% | 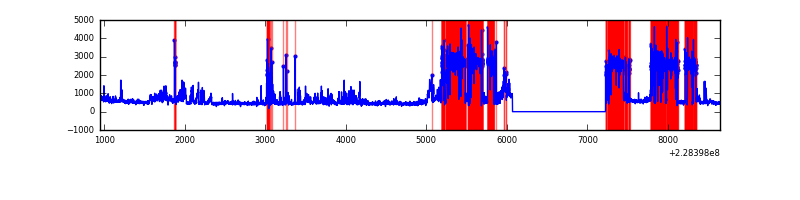 |
Top three noisy pixels from each quadrant. If the there are fewer than three noisy pixels in the level2.evt file, extra rows are filled as -1
| Pixel properties | Quadrant properties | ||||||
|---|---|---|---|---|---|---|---|
| Quadrant | DetID | PixID | Counts | Sigma | Mean | Median | Sigma |
| A | 8 | 15 | 65569 | 387.54 | 830 | 813 | 167.1 |
| A | 0 | 226 | 7938 | 42.64 | 830 | 813 | 167.1 |
| A | 12 | 194 | 7524 | 40.16 | 830 | 813 | 167.1 |
| B | 11 | 51 | 38180 | 236.88 | 831 | 812 | 157.8 |
| B | 0 | 214 | 27709 | 170.5 | 831 | 812 | 157.8 |
| B | 10 | 16 | 23650 | 144.77 | 831 | 812 | 157.8 |
| C | 1 | 16 | 104484 | 559.44 | 808 | 810 | 185.3 |
| C | 13 | 61 | 6169 | 28.92 | 808 | 810 | 185.3 |
| C | 3 | 202 | 2089 | 6.9 | 808 | 810 | 185.3 |
| D | 1 | 52 | 2675087 | 14653.49 | 730 | 710 | 182.5 |
| D | 12 | 227 | 446008 | 2439.88 | 730 | 710 | 182.5 |
| D | 5 | 233 | 324255 | 1772.77 | 730 | 710 | 182.5 |
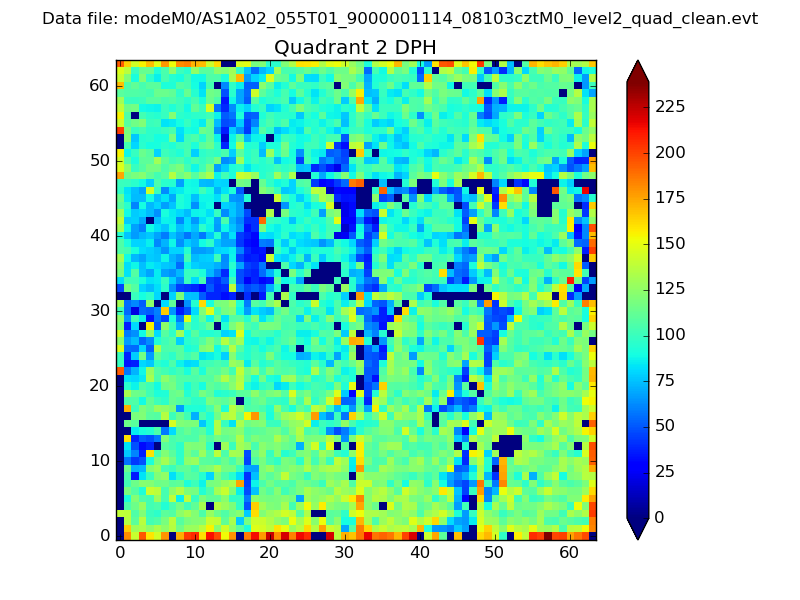
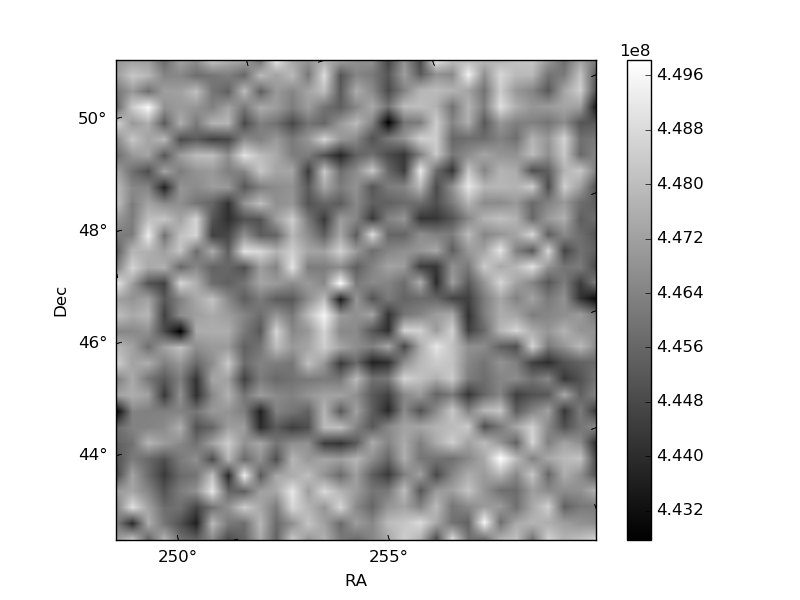
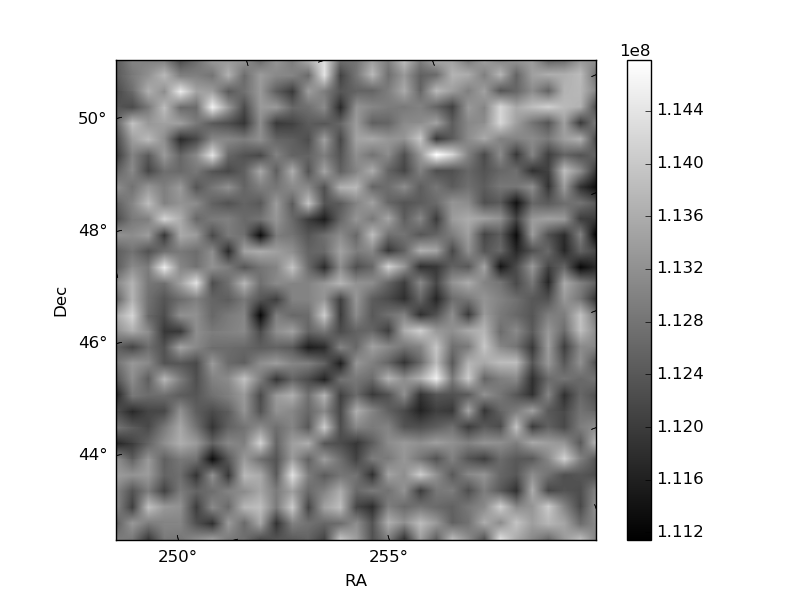
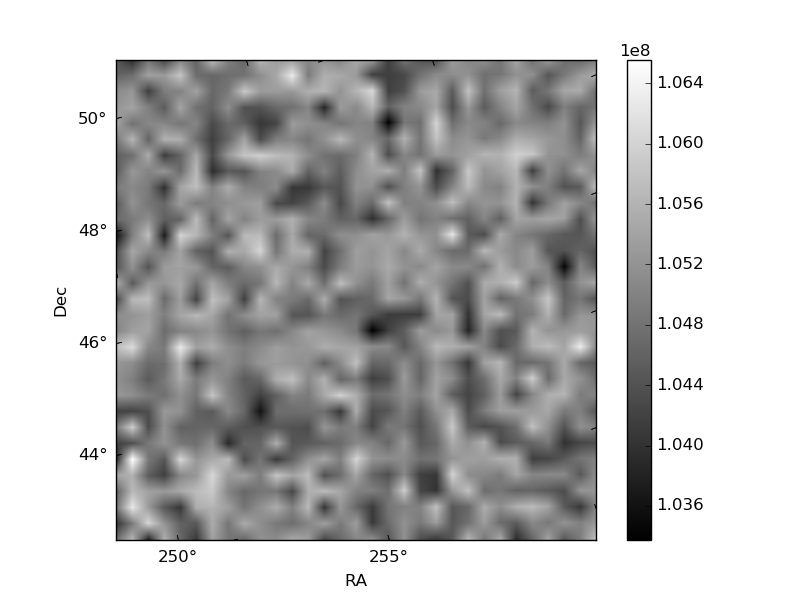
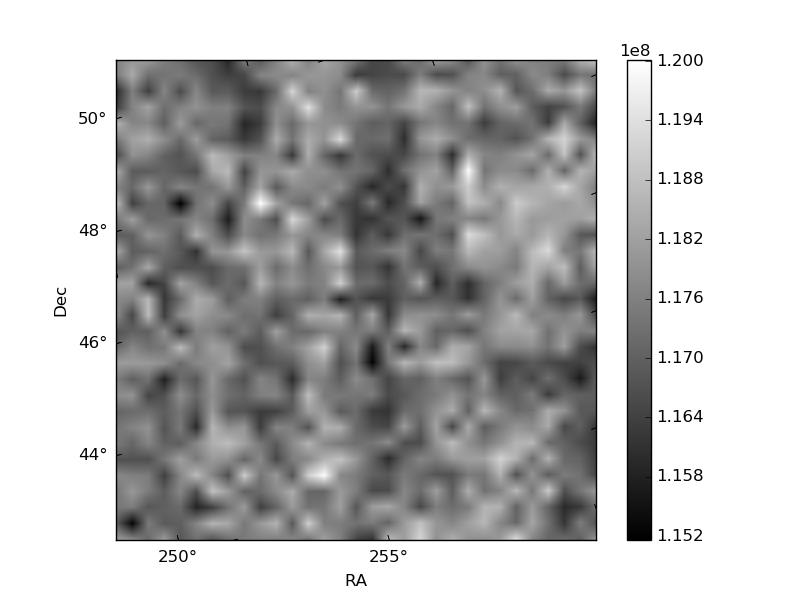
Histogram calculated using DETX and DETY for each event in the final _common_clean file
| Quadrant A | 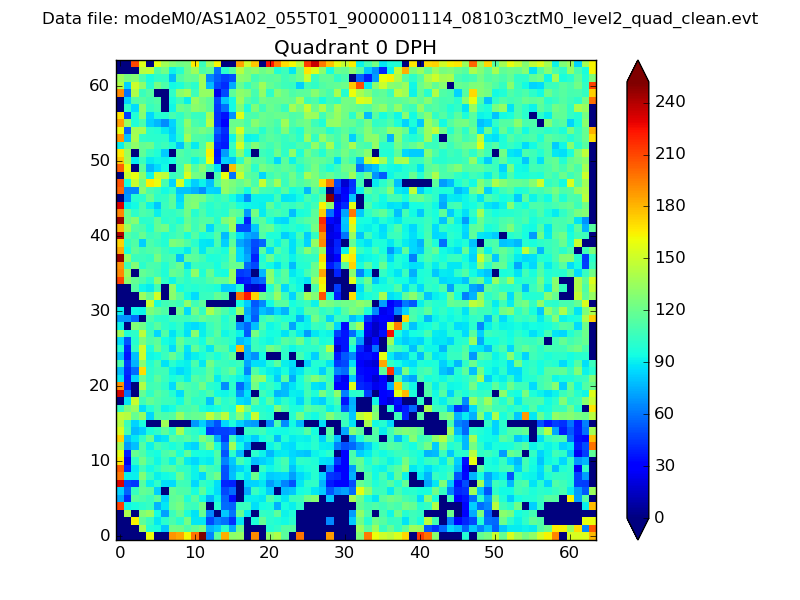 |
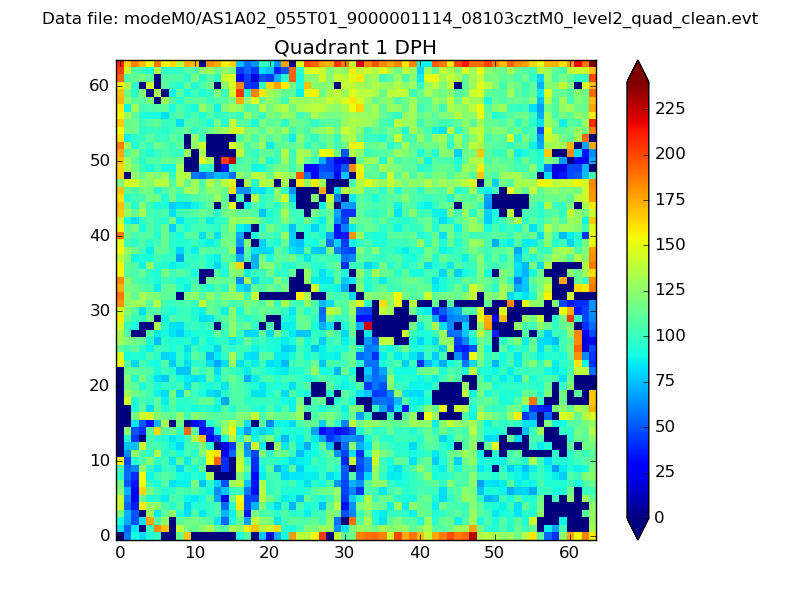 |
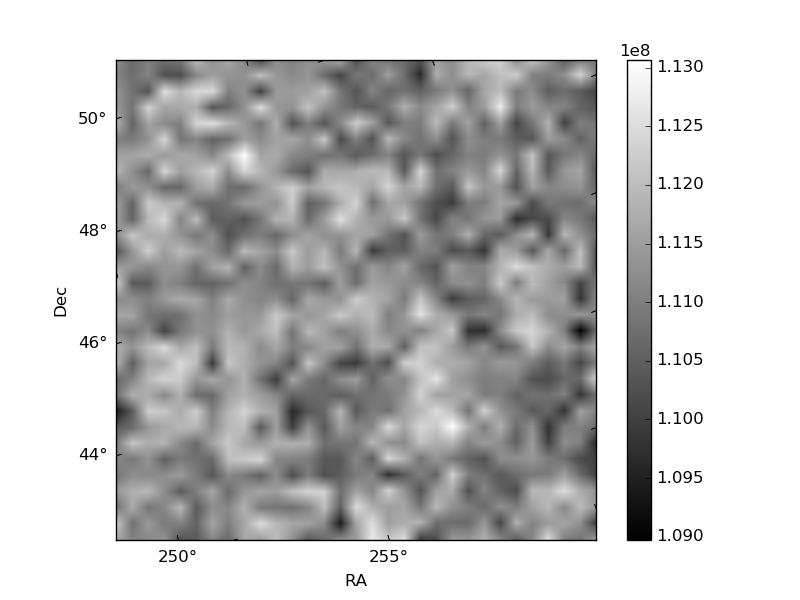
Quadrant B |
|---|---|---|---|
| Quadrant D | 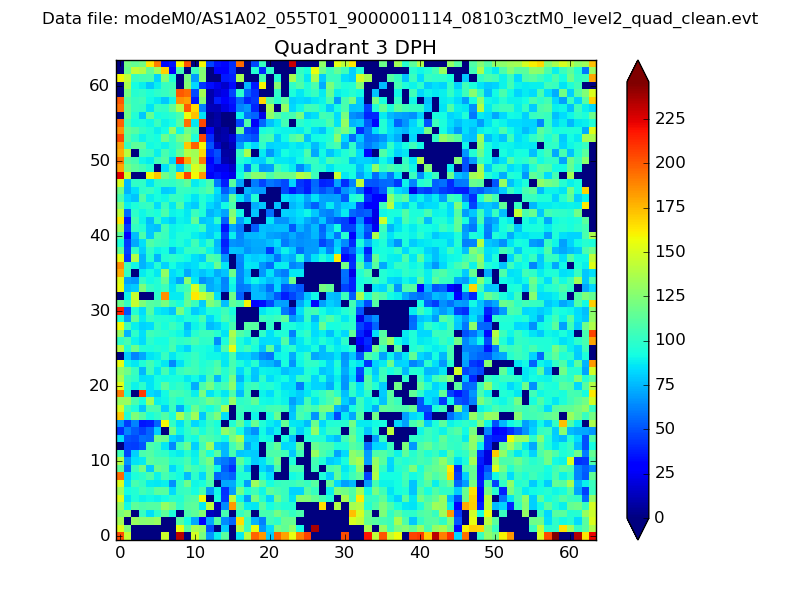 |
 |
Quadrant C |
| Plot type | Count rate plots | Images |
|---|---|---|
| Comparison with Poisson distribution Blue bars denote a histogram of data divided into 1 sec bins. Red curve is a Poisson curve with rate = median count rate of data. |
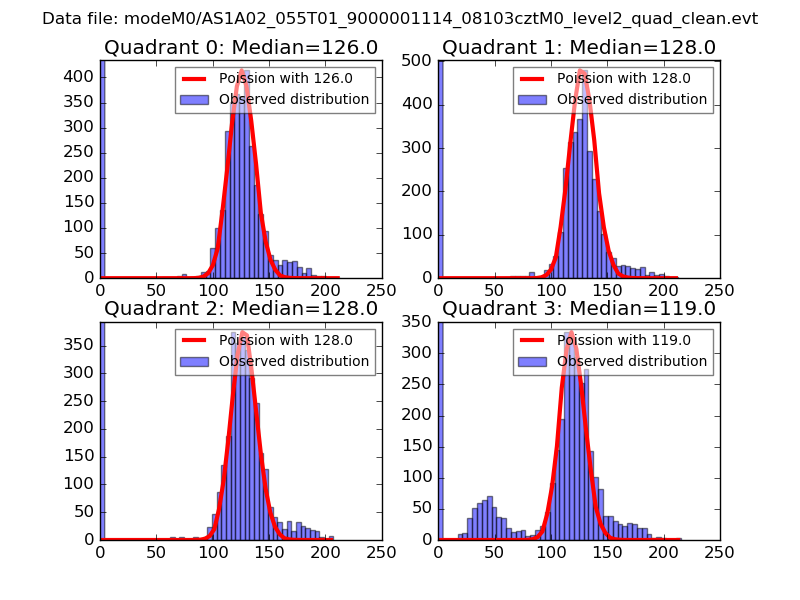 |
 |
| Quadrant-wise count rates Data is divided into 100 sec bins |
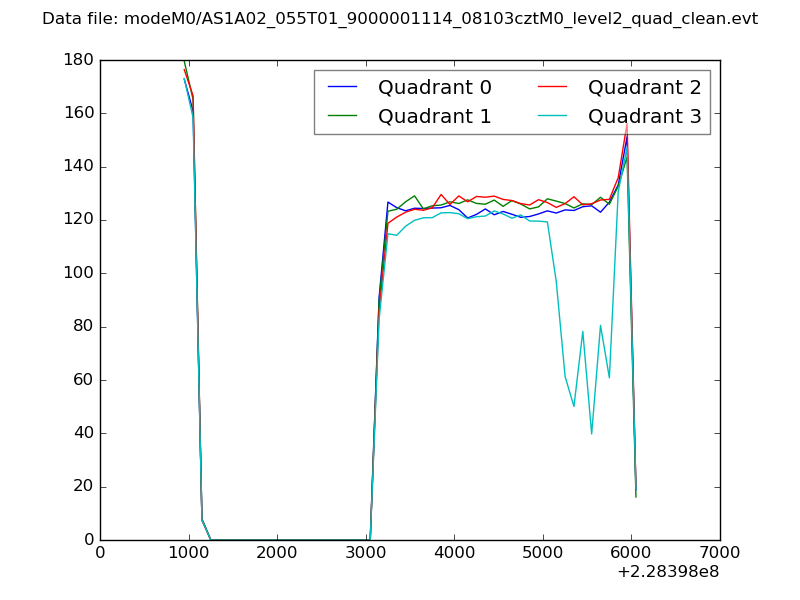 |
|
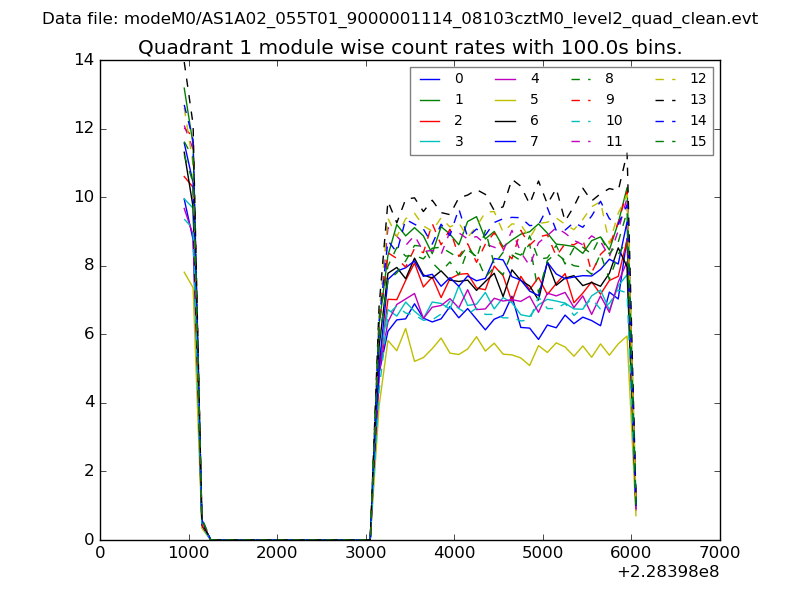
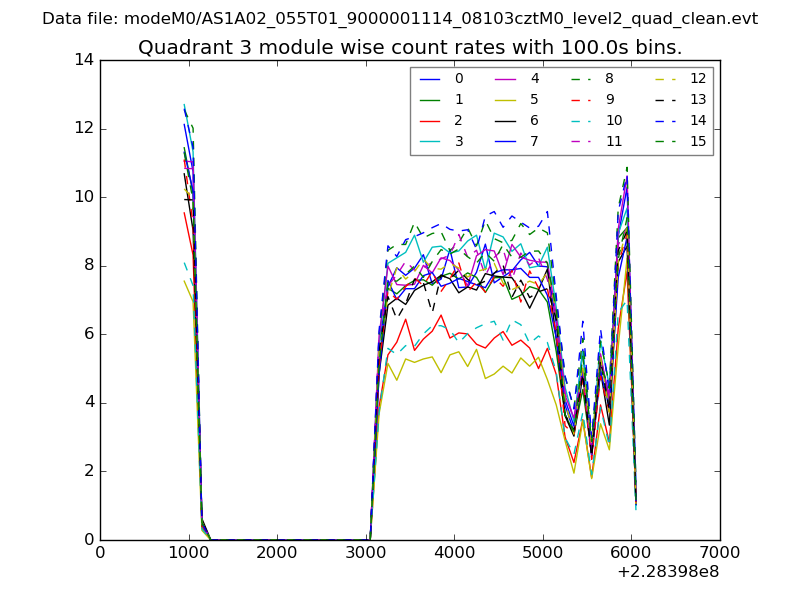
| Module-wise count rates for Quadrant A Data is divided into 100 sec bins |
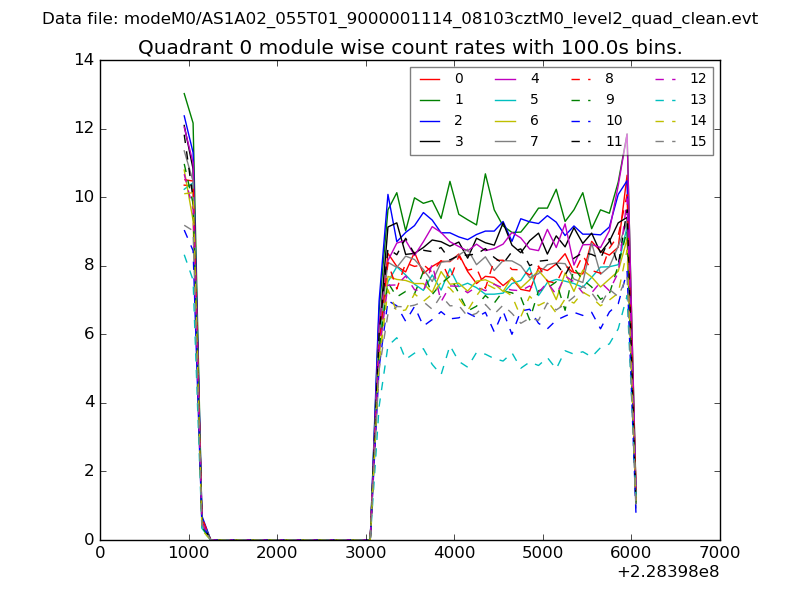 |
 |
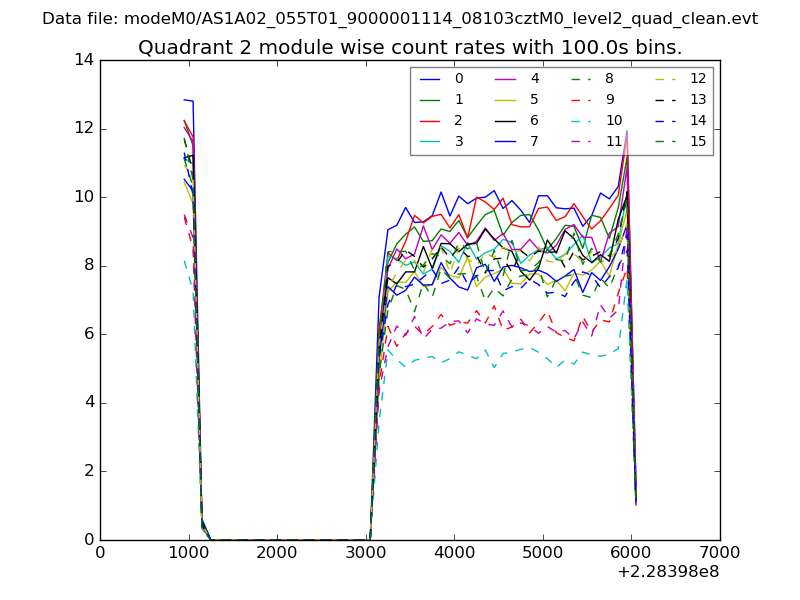
| Module-wise count rates for Quadrant B Data is divided into 100 sec bins |
 |
 |
| Module-wise count rates for Quadrant C Data is divided into 100 sec bins |
 |
 |
| Module-wise count rates for Quadrant D Data is divided into 100 sec bins |
 |
 |
| Parameter | Plot |
|---|---|
| CZT HV Monitor | 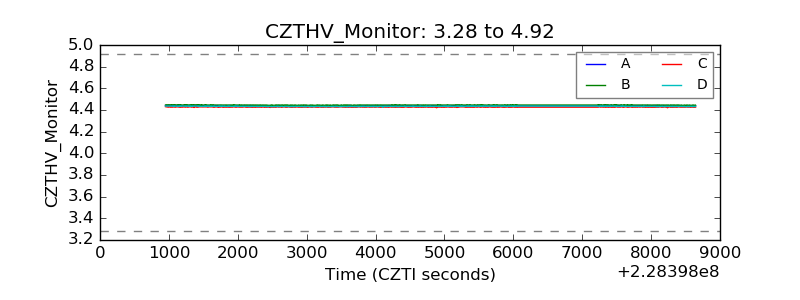 |
| D_VDD | 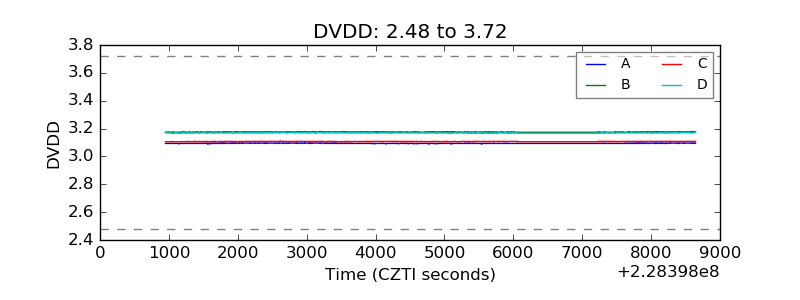 |
| Temperature 1 | 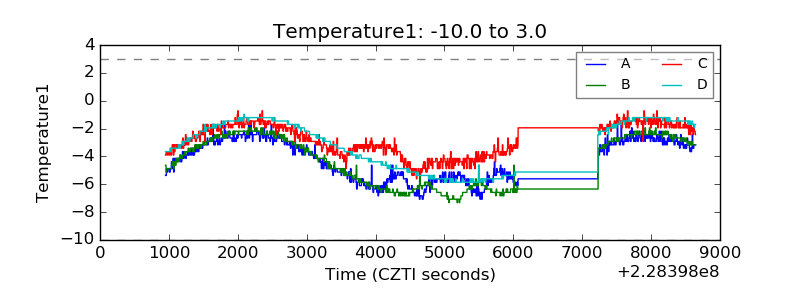 |
| Veto HV Monitor |  |
| Veto LLD | 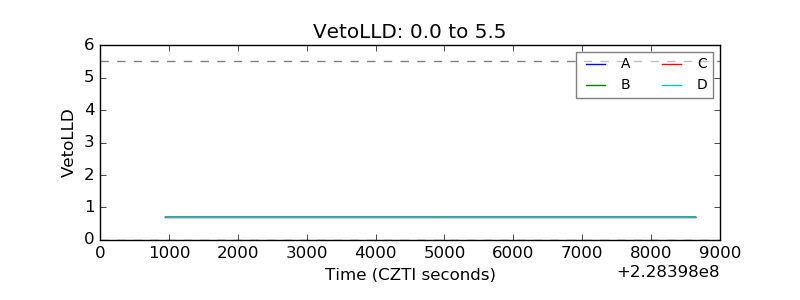 |
| Alpha Counter | 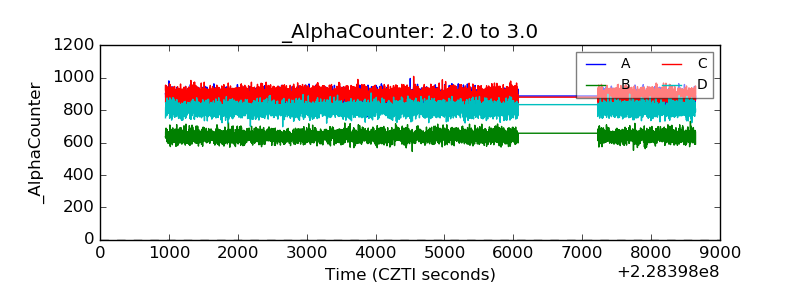 |
| _CPM_Rate |  |
| CZT Counter | 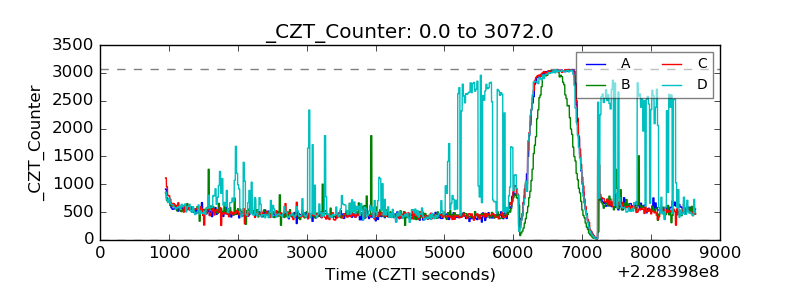 |
| +2.5 Volts monitor |  |
| +5 Volts monitor |  |
| _ROLL_ROT | 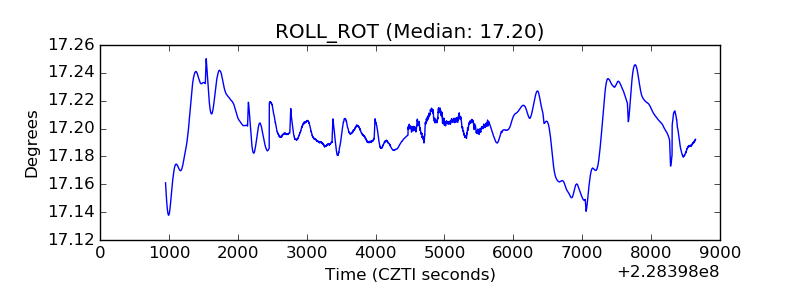 |
| _Roll_DEC | 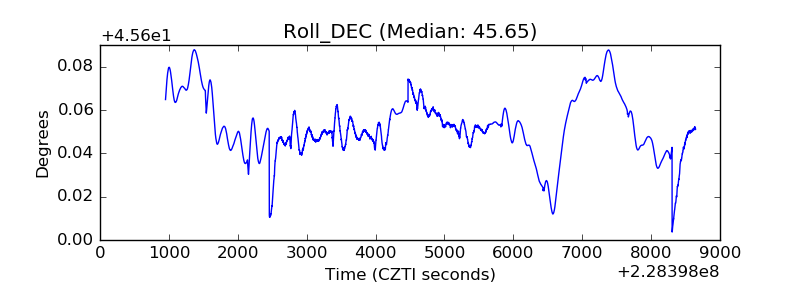 |
| _Roll_RA | 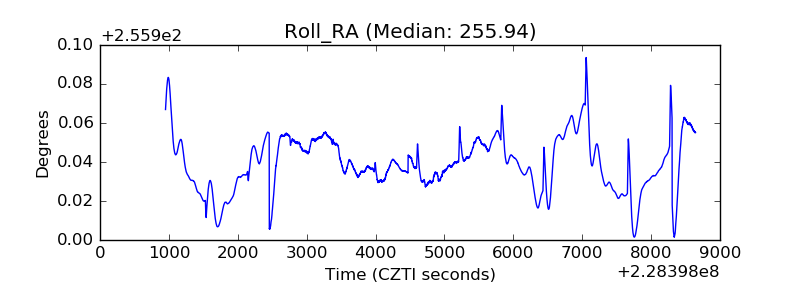 |
| Veto Counter | 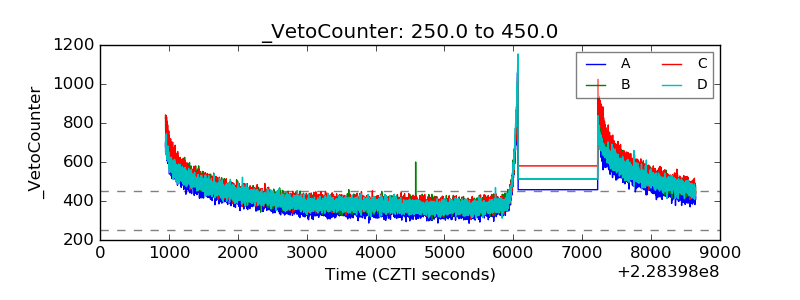 |