| Param | Original file | Final file |
|---|---|---|
| Filename | modeM0/AS1A02_055T01_9000001114_08104cztM0_level2.evt | modeM0/AS1A02_055T01_9000001114_08104cztM0_level2_quad_clean.evt |
| Size (bytes) | 494,907,840 | 68,734,080 |
| Size | 472.0 MB | 65.5 MB |
| Events in quadrant A | 3,718,885 | 407,328 |
| Events in quadrant B | 3,308,765 | 414,635 |
| Events in quadrant C | 3,148,614 | 420,300 |
| Events in quadrant D | 4,390,153 | 404,908 |
| Mode M0 | |||
|---|---|---|---|
| Quadrant | BADHDUFLAG | Total packets | Discarded packets |
| A | 0 | 15113 | 3 |
| B | 0 | 13840 | 2 |
| C | 0 | 13406 | 2 |
| D | 0 | 17148 | 2 |
| Mode M9 | |||
|---|---|---|---|
| Quadrant | BADHDUFLAG | Total packets | Discarded packets |
| A | 0 | 12 | 0 |
| B | 0 | 12 | 0 |
| C | 0 | 12 | 0 |
| D | 0 | 12 | 0 |
| Mode SS | |||
|---|---|---|---|
| Quadrant | BADHDUFLAG | Total packets | Discarded packets |
| A | 0 | 128 | 0 |
| B | 0 | 128 | 0 |
| C | 0 | 128 | 0 |
| D | 0 | 128 | 0 |
| Quadrant | Total seconds | Saturated seconds | Saturation percentage |
|---|---|---|---|
| A | 6210 | 84 | 1.352657% |
| B | 6210 | 105 | 1.690821% |
| C | 6210 | 53 | 0.853462% |
| D | 6210 | 662 | 10.660225% |
Noise dominated data is calculated using 1-second bins in cleaned event files. If a bin has >2000 counts, and if more than 50% of those come from <1% of pixels, then it is considered to be noise-dominated and hence unusable.
| Quadrant | # 1 sec bins | Bins with >0 counts | Bins with >2000 counts | High rate bins dominated by noise | Noise dominated (total time) | Noise dominated (detector-on time) | Marked lightcurve |
|---|---|---|---|---|---|---|---|
| A | 7480 | 6210 | 0 | 0 | 0.00% | 0.00% | 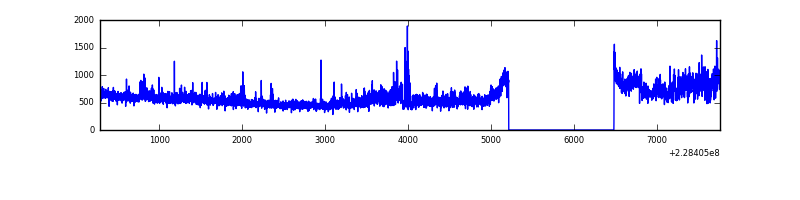 |
| B | 7480 | 6211 | 28 | 28 | 0.37% | 0.45% | 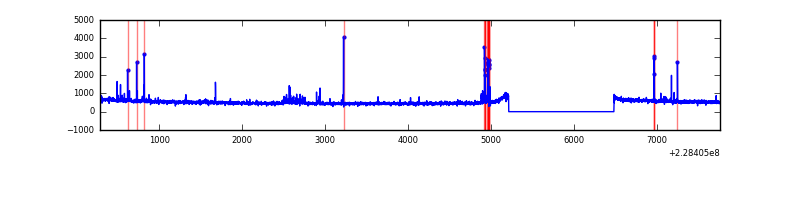 |
| C | 7480 | 6211 | 0 | 0 | 0.00% | 0.00% | 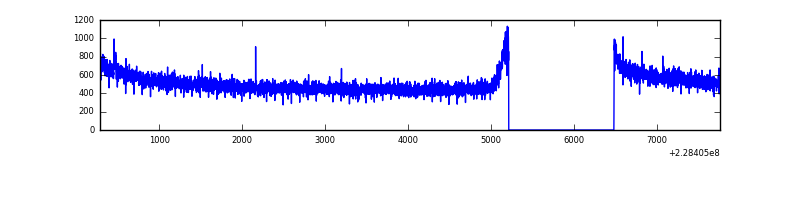 |
| D | 7480 | 6210 | 571 | 571 | 7.63% | 9.19% | 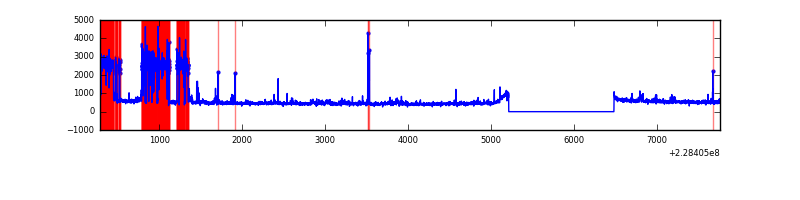 |
Top three noisy pixels from each quadrant. If the there are fewer than three noisy pixels in the level2.evt file, extra rows are filled as -1
| Pixel properties | Quadrant properties | ||||||
|---|---|---|---|---|---|---|---|
| Quadrant | DetID | PixID | Counts | Sigma | Mean | Median | Sigma |
| A | 8 | 15 | 623146 | 3828.26 | 804 | 787 | 162.6 |
| A | 0 | 226 | 7489 | 41.23 | 804 | 787 | 162.6 |
| A | 12 | 194 | 7385 | 40.59 | 804 | 787 | 162.6 |
| B | 0 | 214 | 96567 | 633.18 | 806 | 790 | 151.3 |
| B | 10 | 16 | 35978 | 232.63 | 806 | 790 | 151.3 |
| B | 11 | 51 | 25527 | 163.54 | 806 | 790 | 151.3 |
| C | 1 | 16 | 65882 | 358.81 | 790 | 793 | 181.4 |
| C | 13 | 61 | 6172 | 29.65 | 790 | 793 | 181.4 |
| C | 3 | 202 | 2090 | 7.15 | 790 | 793 | 181.4 |
| D | 1 | 52 | 1437003 | 7305.59 | 743 | 726 | 196.6 |
| D | 5 | 233 | 59808 | 300.52 | 743 | 726 | 196.6 |
| D | 2 | 234 | 20793 | 102.07 | 743 | 726 | 196.6 |
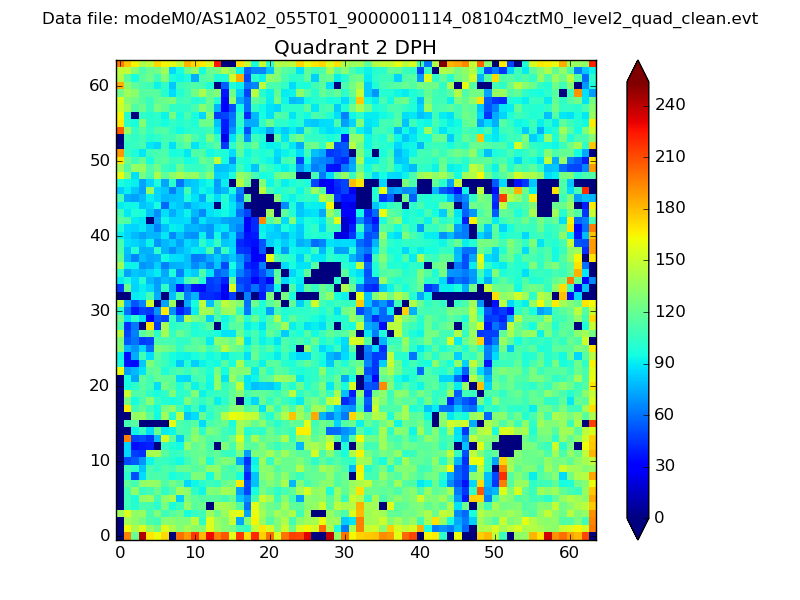
Histogram calculated using DETX and DETY for each event in the final _common_clean file
| Quadrant A | 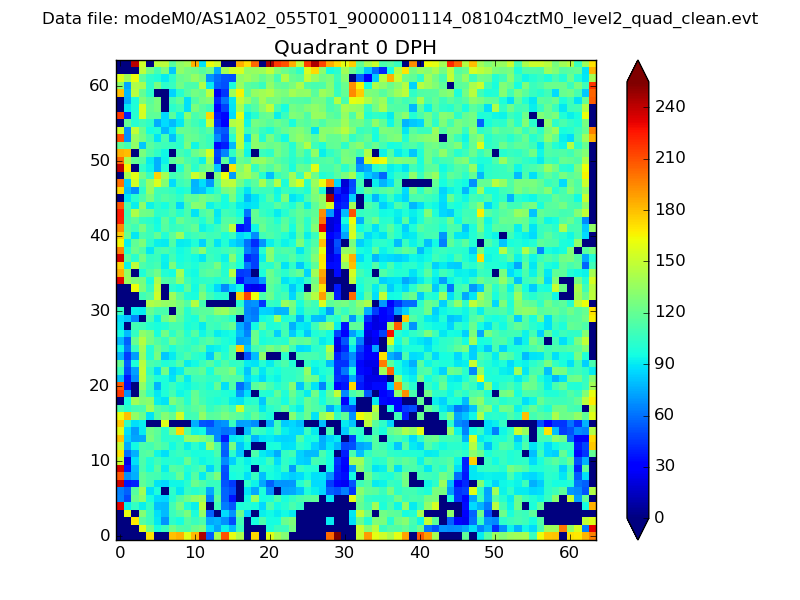 |
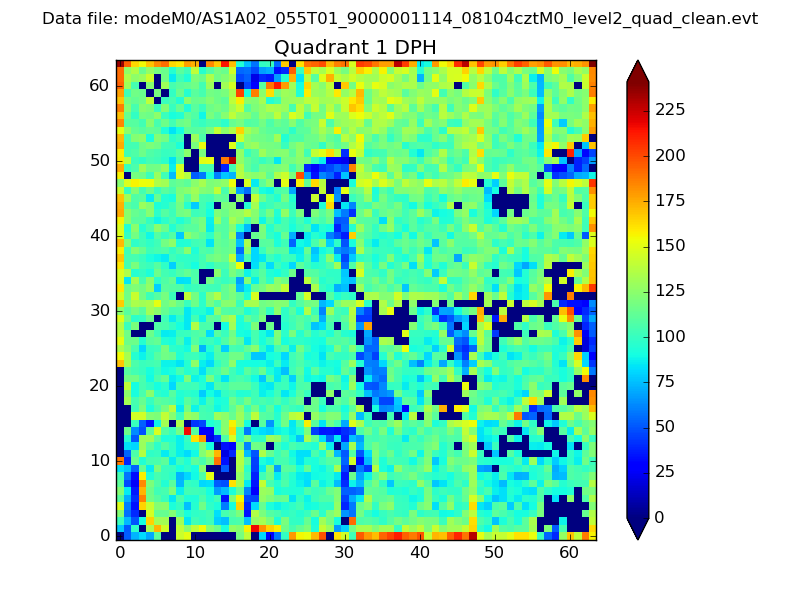 |
Quadrant B |
|---|---|---|---|
| Quadrant D | 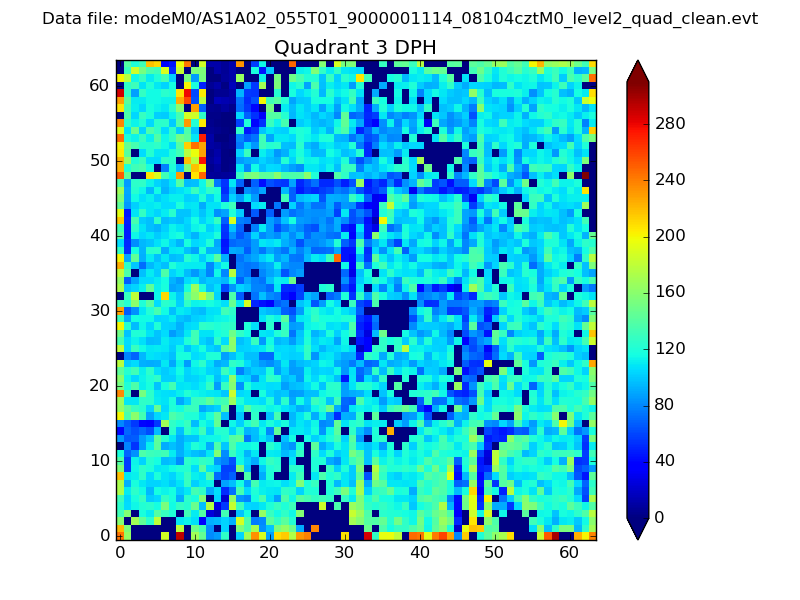 |
 |
Quadrant C |
| Plot type | Count rate plots | Images |
|---|---|---|
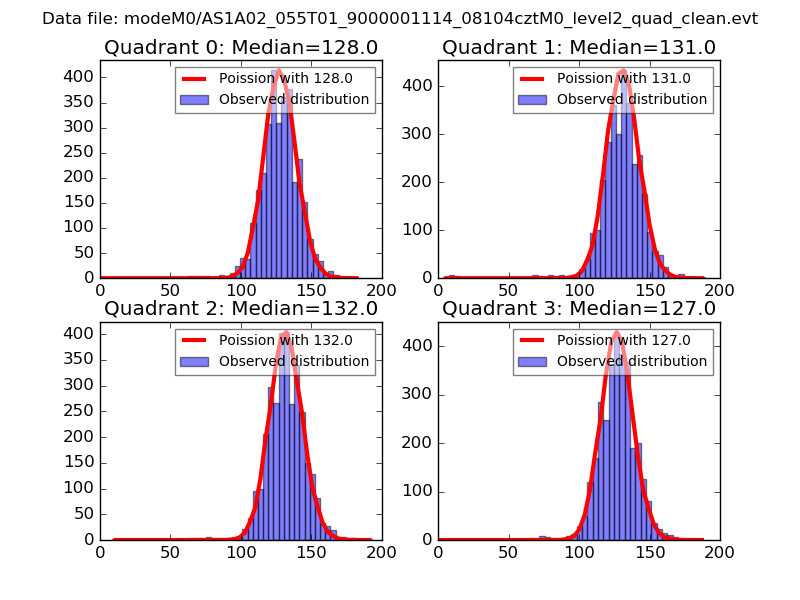
| Comparison with Poisson distribution Blue bars denote a histogram of data divided into 1 sec bins. Red curve is a Poisson curve with rate = median count rate of data. |
 |
 |
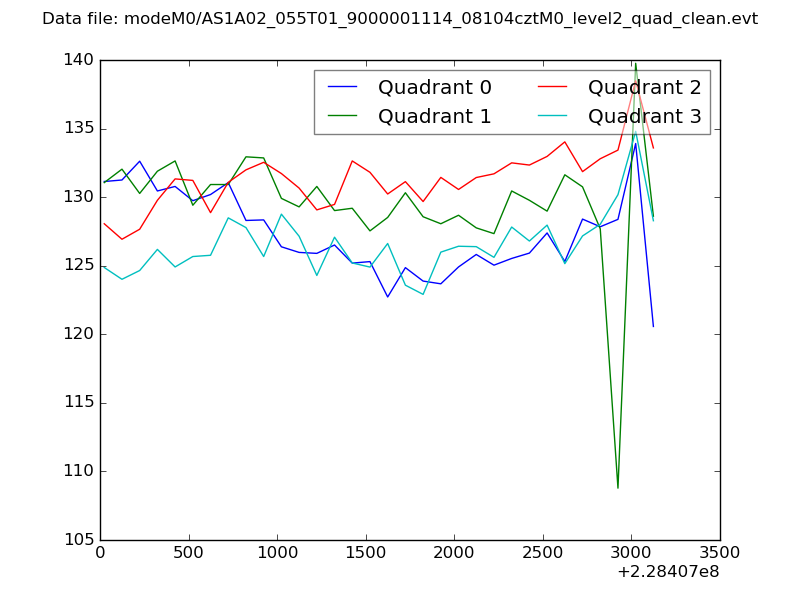
| Quadrant-wise count rates Data is divided into 100 sec bins |
 |
|
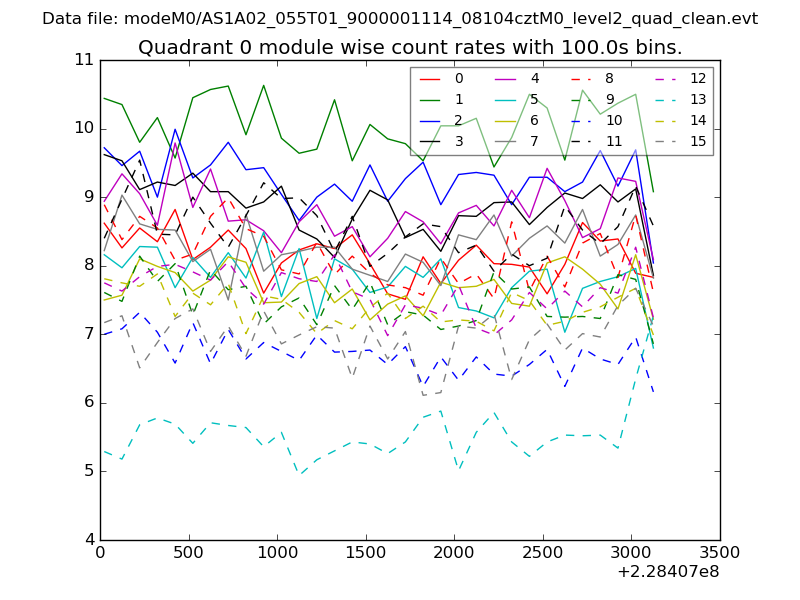
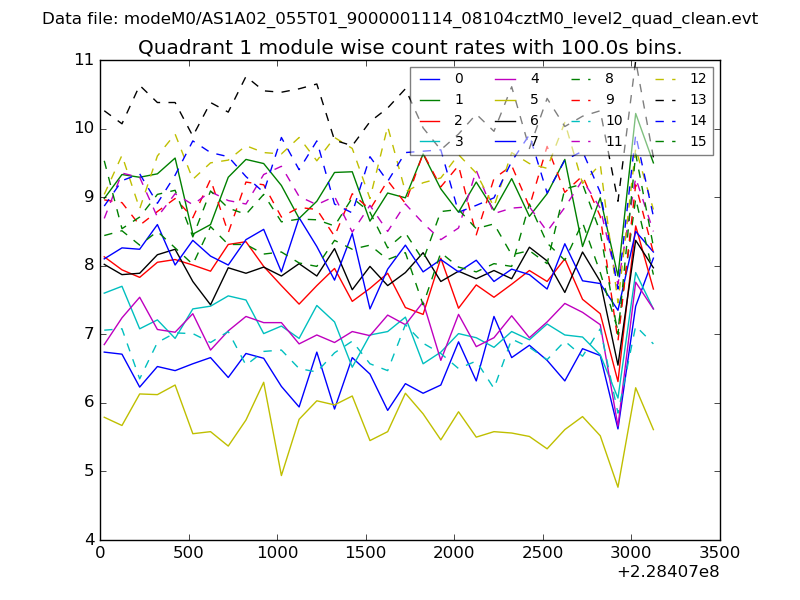
| Module-wise count rates for Quadrant A Data is divided into 100 sec bins |
 |
 |
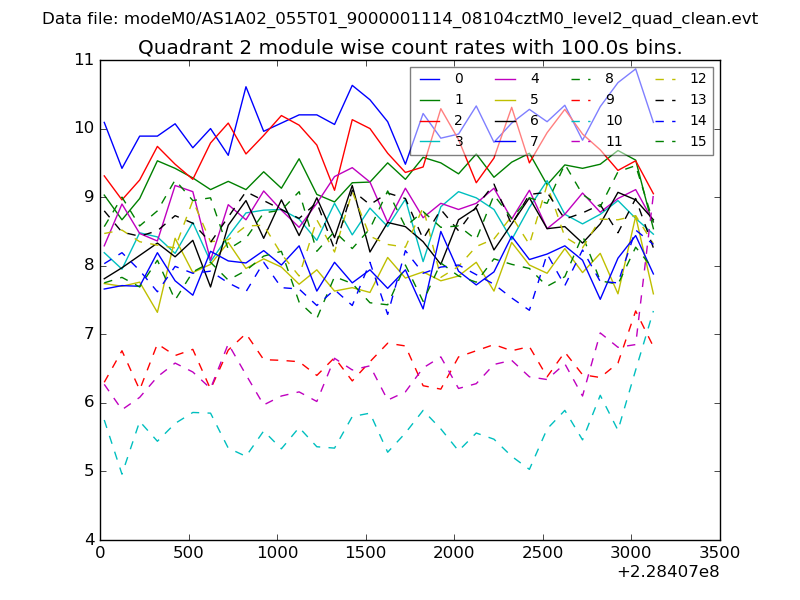
| Module-wise count rates for Quadrant B Data is divided into 100 sec bins |
 |
 |
| Module-wise count rates for Quadrant C Data is divided into 100 sec bins |
 |
 |
| Module-wise count rates for Quadrant D Data is divided into 100 sec bins |
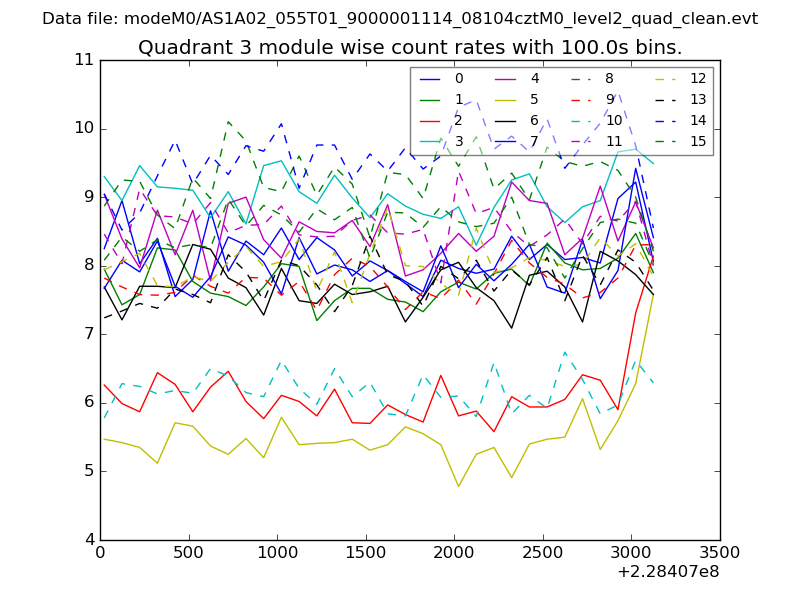 |
 |
| Parameter | Plot |
|---|---|
| CZT HV Monitor | 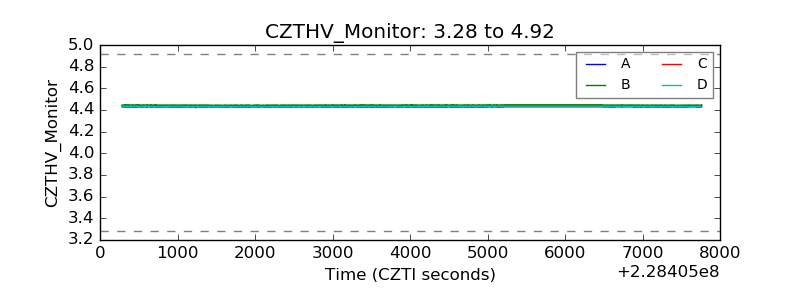 |
| D_VDD | 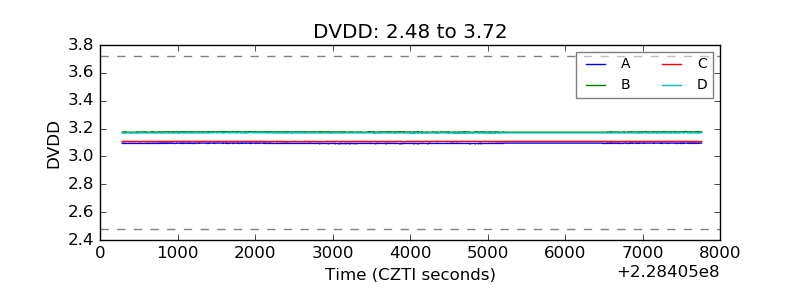 |
| Temperature 1 | 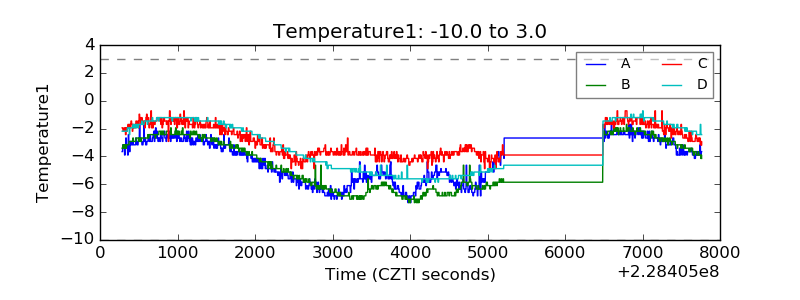 |
| Veto HV Monitor | 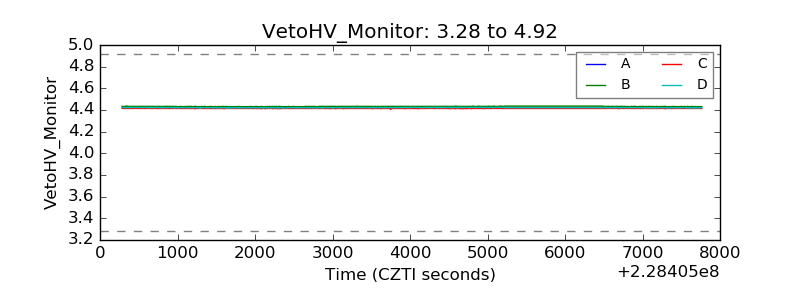 |
| Veto LLD | 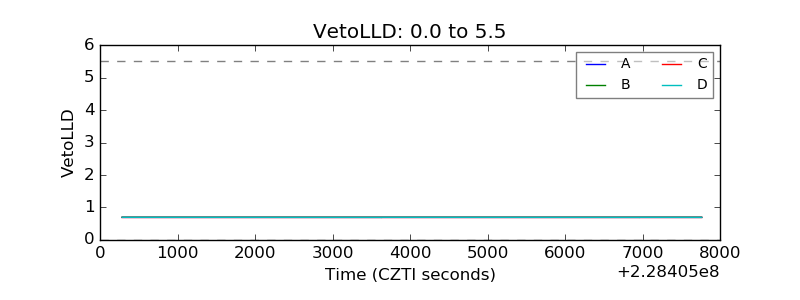 |
| Alpha Counter | 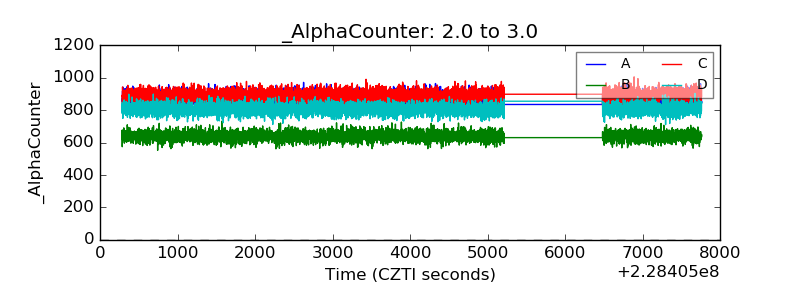 |
| _CPM_Rate | 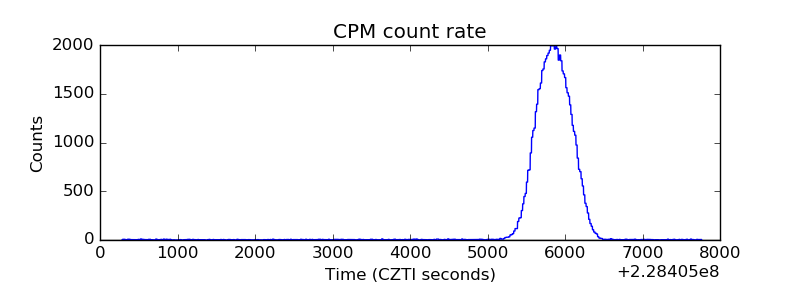 |
| CZT Counter | 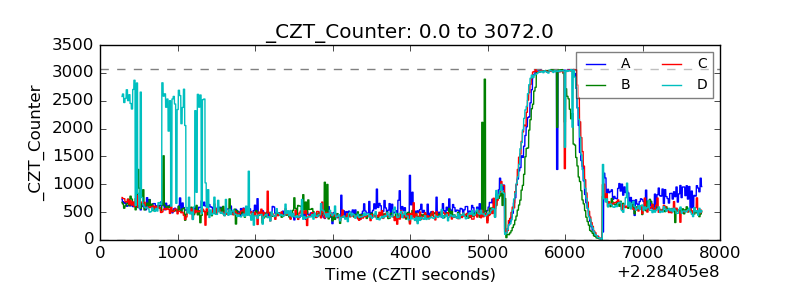 |
| +2.5 Volts monitor |  |
| +5 Volts monitor |  |
| _ROLL_ROT | 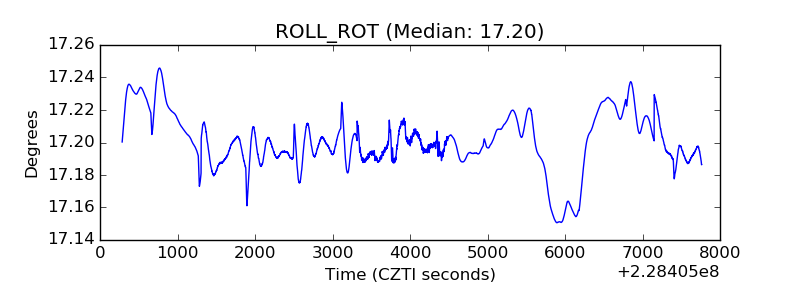 |
| _Roll_DEC | 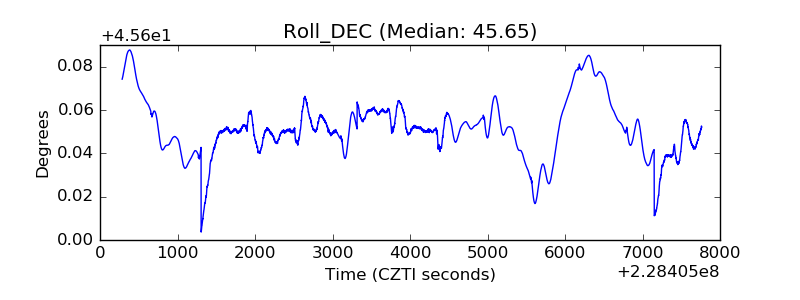 |
| _Roll_RA | 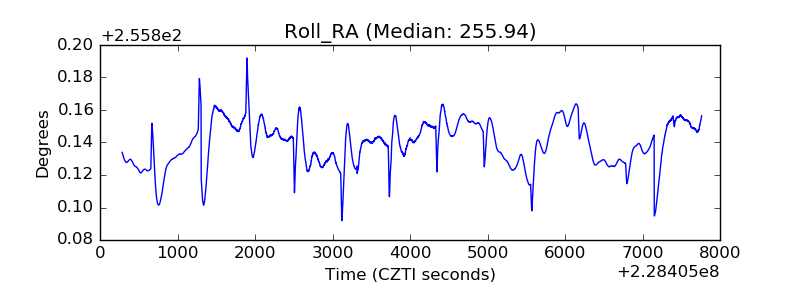 |
| Veto Counter | 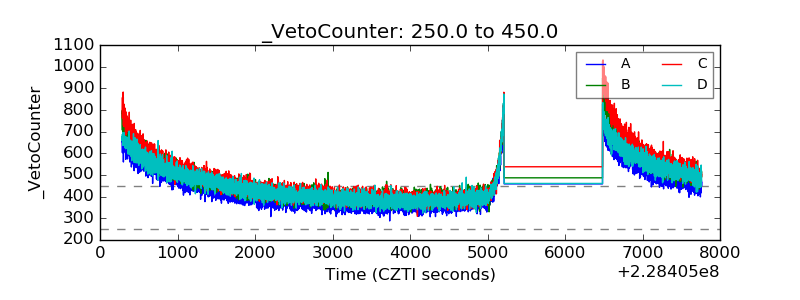 |