| Param | Original file | Final file |
|---|---|---|
| Filename | modeM0/AS1A02_055T01_9000001114_08105cztM0_level2.evt | modeM0/AS1A02_055T01_9000001114_08105cztM0_level2_quad_clean.evt |
| Size (bytes) | 465,269,760 | 81,106,560 |
| Size | 443.7 MB | 77.3 MB |
| Events in quadrant A | 3,973,191 | 497,456 |
| Events in quadrant B | 3,194,733 | 514,635 |
| Events in quadrant C | 3,161,019 | 518,785 |
| Events in quadrant D | 3,343,964 | 495,492 |
| Mode M0 | |||
|---|---|---|---|
| Quadrant | BADHDUFLAG | Total packets | Discarded packets |
| A | 0 | 16111 | 3 |
| B | 0 | 13400 | 2 |
| C | 0 | 13373 | 2 |
| D | 0 | 14092 | 2 |
| Mode M9 | |||
|---|---|---|---|
| Quadrant | BADHDUFLAG | Total packets | Discarded packets |
| A | 0 | 24 | 0 |
| B | 0 | 24 | 0 |
| C | 0 | 24 | 0 |
| D | 0 | 24 | 0 |
| Mode SS | |||
|---|---|---|---|
| Quadrant | BADHDUFLAG | Total packets | Discarded packets |
| A | 0 | 126 | 0 |
| B | 0 | 126 | 0 |
| C | 0 | 126 | 0 |
| D | 0 | 126 | 0 |
| Quadrant | Total seconds | Saturated seconds | Saturation percentage |
|---|---|---|---|
| A | 6151 | 119 | 1.934645% |
| B | 6151 | 93 | 1.511949% |
| C | 6151 | 72 | 1.170541% |
| D | 6151 | 83 | 1.349374% |
Noise dominated data is calculated using 1-second bins in cleaned event files. If a bin has >2000 counts, and if more than 50% of those come from <1% of pixels, then it is considered to be noise-dominated and hence unusable.
| Quadrant | # 1 sec bins | Bins with >0 counts | Bins with >2000 counts | High rate bins dominated by noise | Noise dominated (total time) | Noise dominated (detector-on time) | Marked lightcurve |
|---|---|---|---|---|---|---|---|
| A | 7461 | 6152 | 0 | 0 | 0.00% | 0.00% | 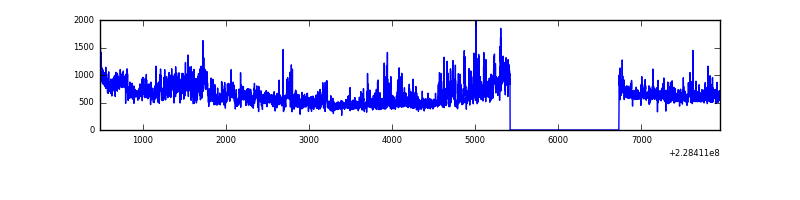 |
| B | 7461 | 6152 | 4 | 4 | 0.05% | 0.07% | 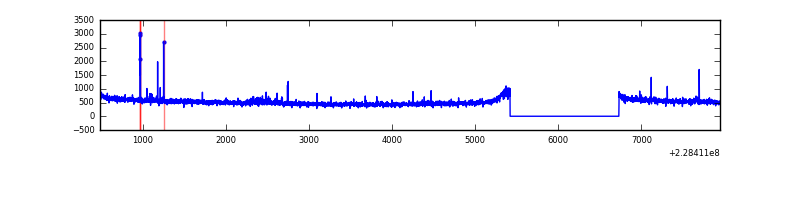 |
| C | 7461 | 6152 | 0 | 0 | 0.00% | 0.00% | 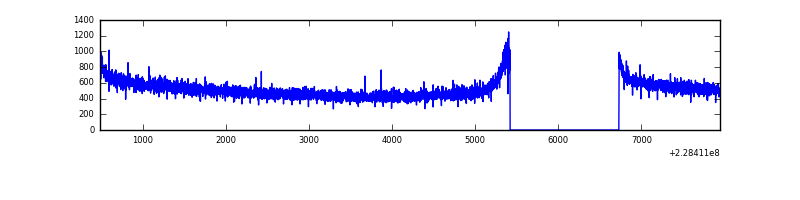 |
| D | 7461 | 6152 | 8 | 8 | 0.11% | 0.13% | 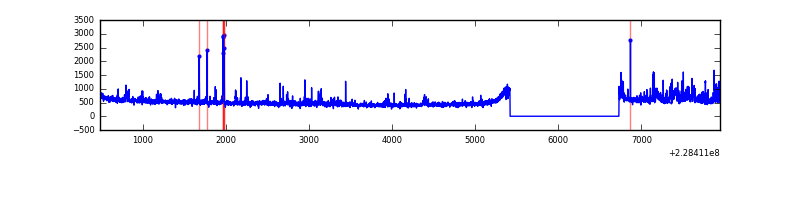 |
Top three noisy pixels from each quadrant. If the there are fewer than three noisy pixels in the level2.evt file, extra rows are filled as -1
| Pixel properties | Quadrant properties | ||||||
|---|---|---|---|---|---|---|---|
| Quadrant | DetID | PixID | Counts | Sigma | Mean | Median | Sigma |
| A | 8 | 15 | 878384 | 5428.48 | 802 | 787 | 161.7 |
| A | 0 | 226 | 7500 | 41.52 | 802 | 787 | 161.7 |
| A | 12 | 194 | 7187 | 39.59 | 802 | 787 | 161.7 |
| B | 10 | 16 | 19877 | 126.3 | 810 | 792 | 151.1 |
| B | 11 | 51 | 19528 | 123.99 | 810 | 792 | 151.1 |
| B | 12 | 111 | 15344 | 96.3 | 810 | 792 | 151.1 |
| C | 1 | 16 | 47917 | 259.04 | 798 | 804 | 181.9 |
| C | 13 | 61 | 6120 | 29.23 | 798 | 804 | 181.9 |
| C | 3 | 202 | 2079 | 7.01 | 798 | 804 | 181.9 |
| D | 1 | 52 | 248598 | 1172.42 | 785 | 771 | 211.4 |
| D | 5 | 233 | 52578 | 245.09 | 785 | 771 | 211.4 |
| D | 12 | 233 | 27814 | 127.94 | 785 | 771 | 211.4 |
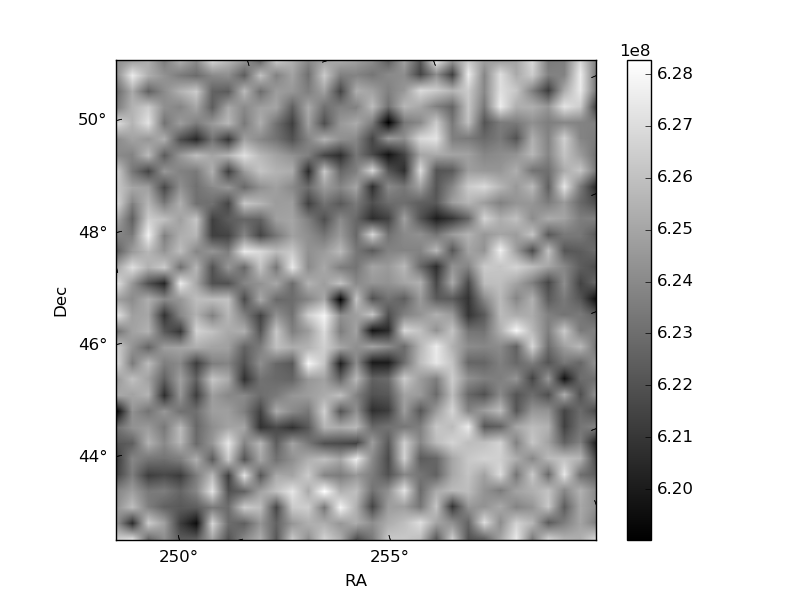
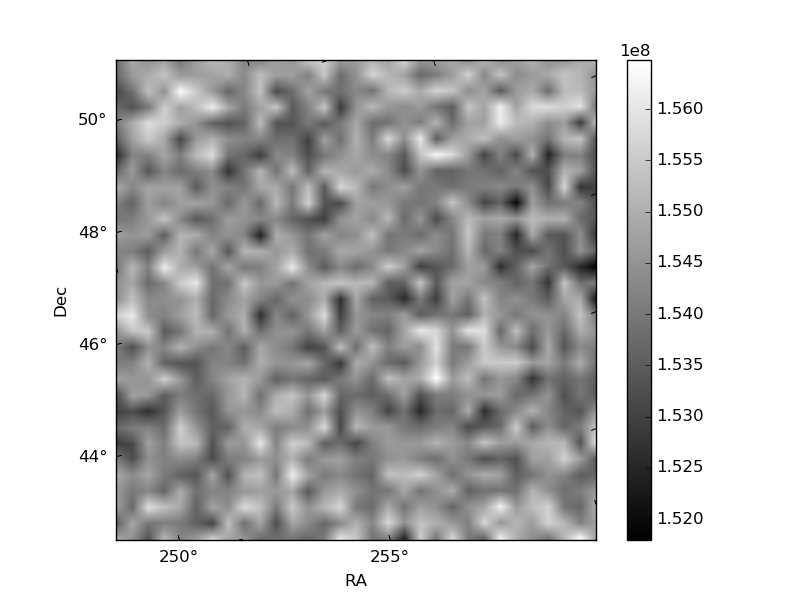
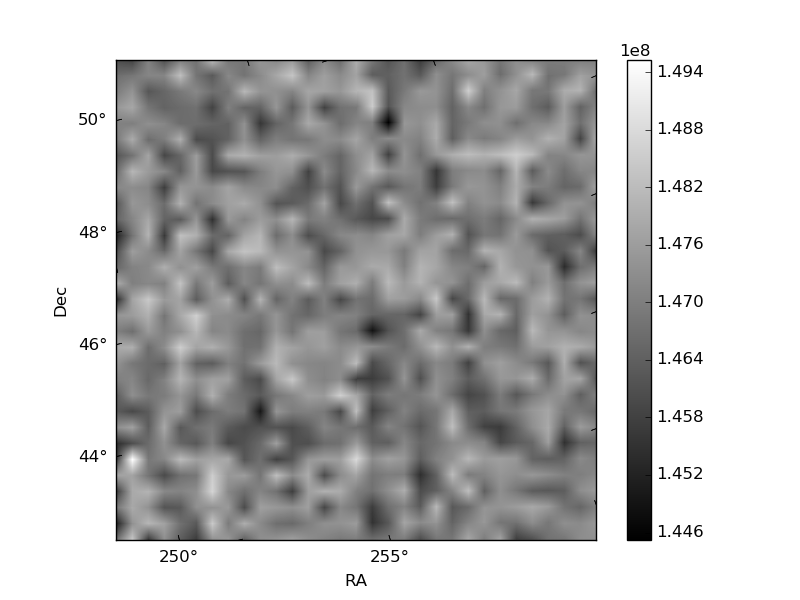
Histogram calculated using DETX and DETY for each event in the final _common_clean file
| Quadrant A | 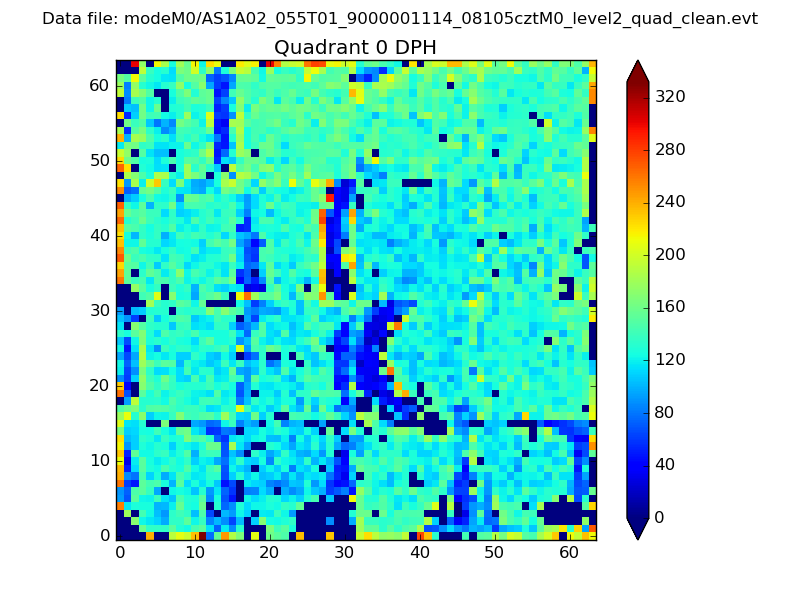 |
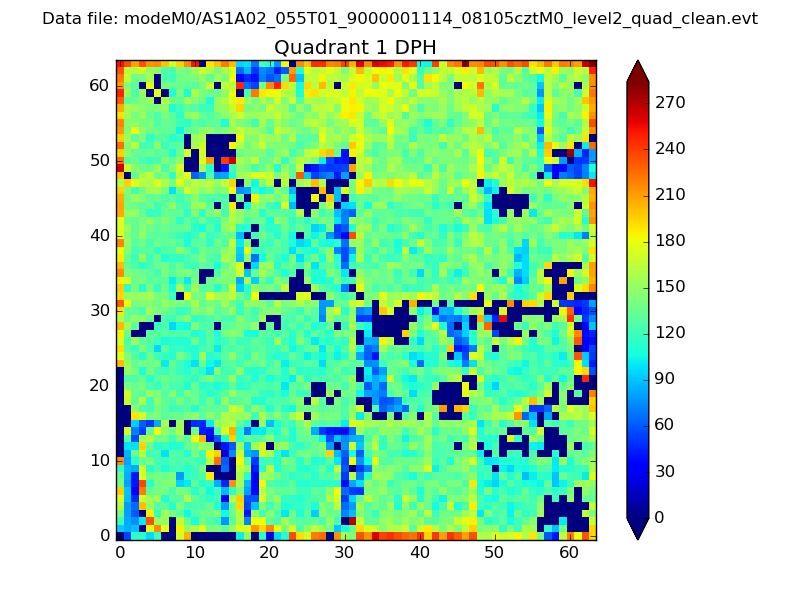 |
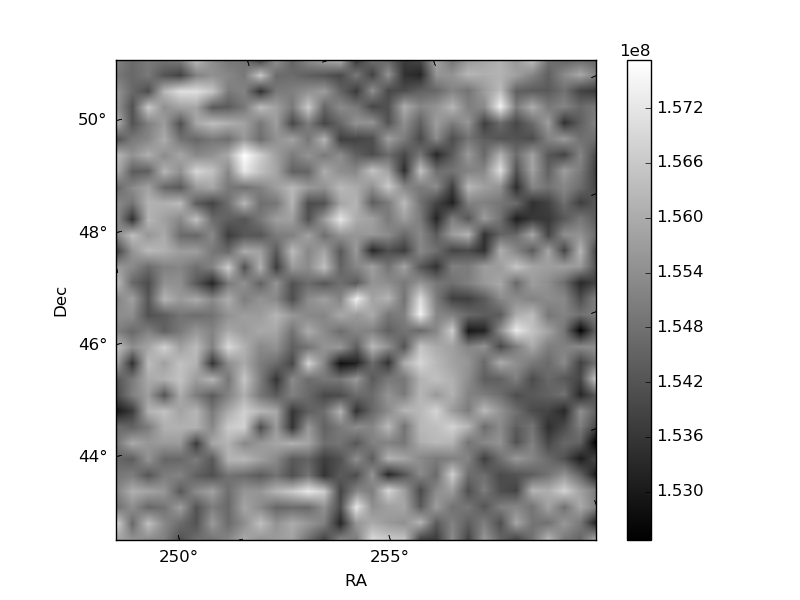
Quadrant B |
|---|---|---|---|
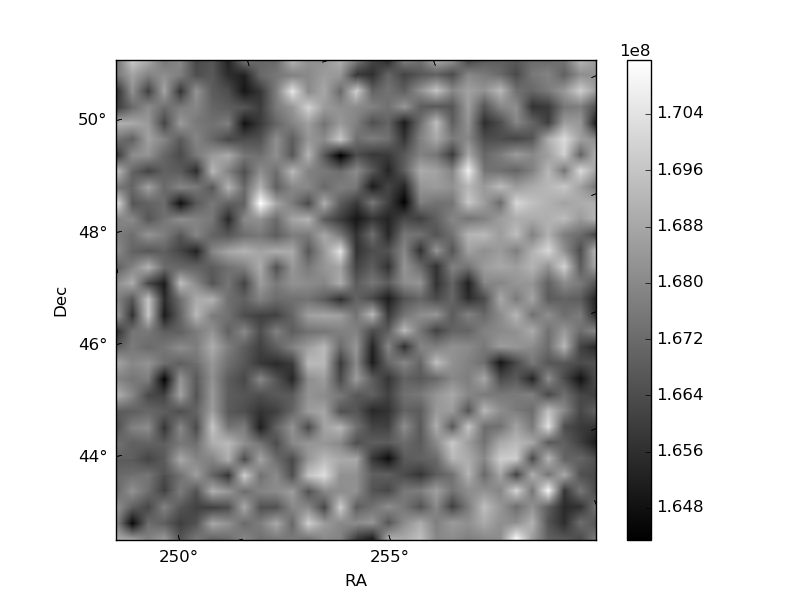
| Quadrant D | 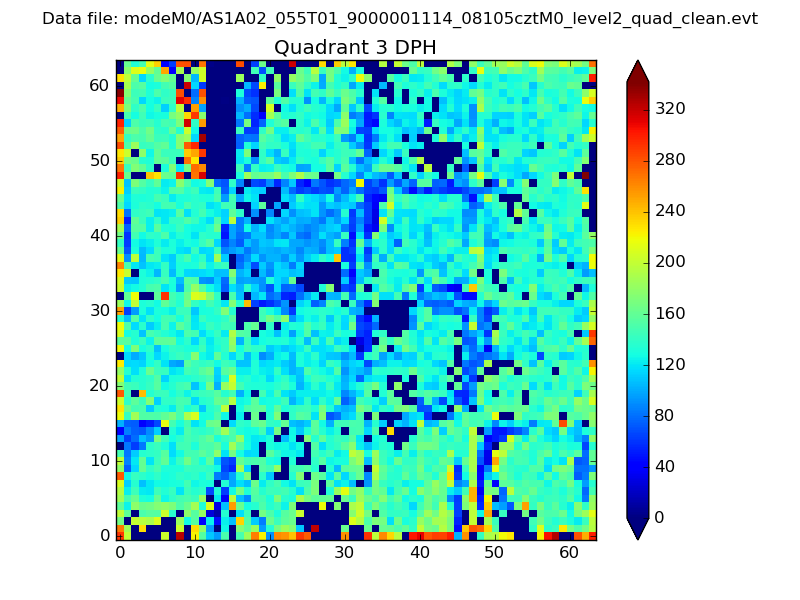 |
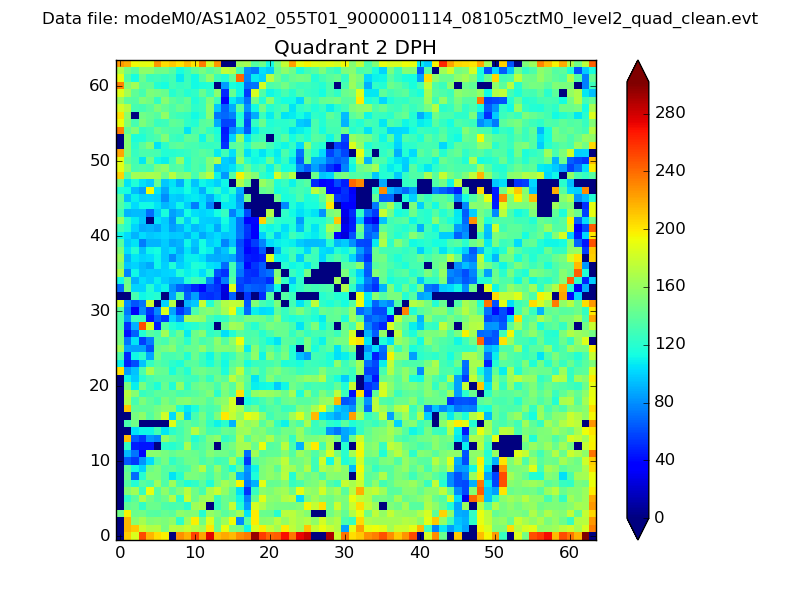 |
Quadrant C |
| Plot type | Count rate plots | Images |
|---|---|---|
| Comparison with Poisson distribution Blue bars denote a histogram of data divided into 1 sec bins. Red curve is a Poisson curve with rate = median count rate of data. |
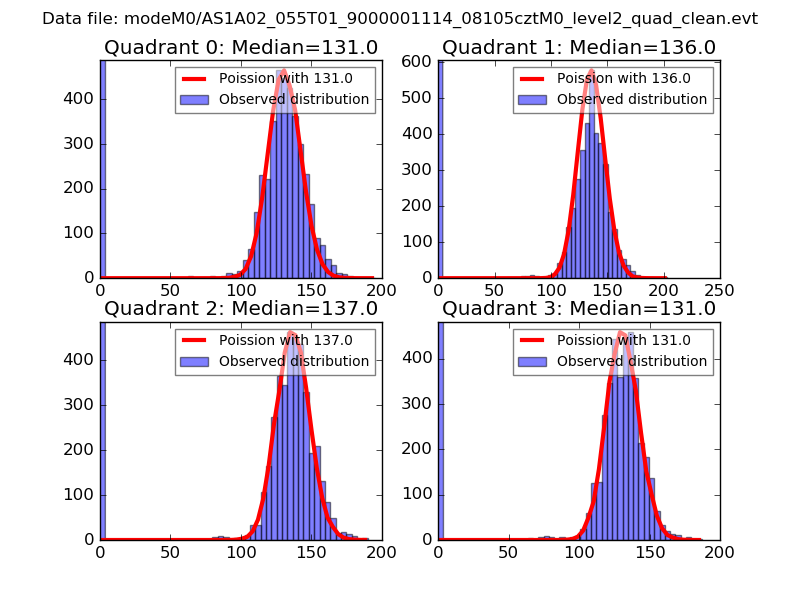 |
 |
| Quadrant-wise count rates Data is divided into 100 sec bins |
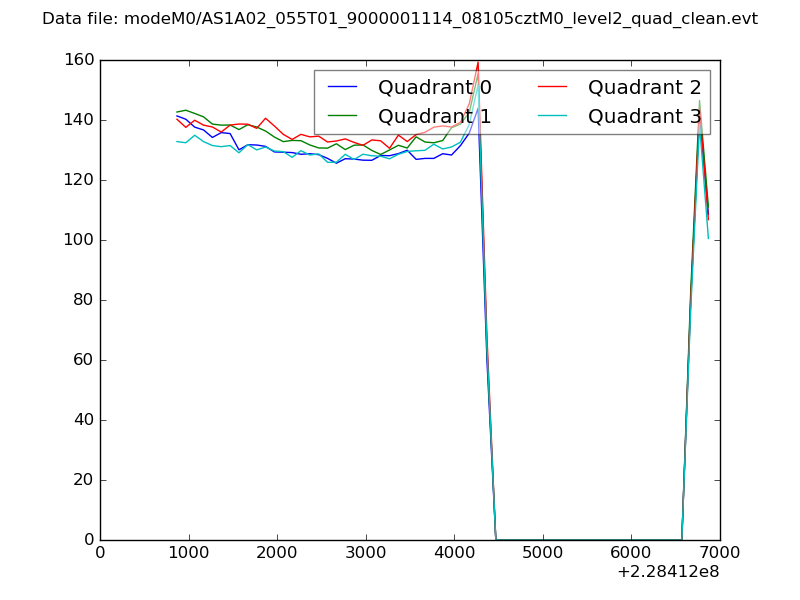 |
|
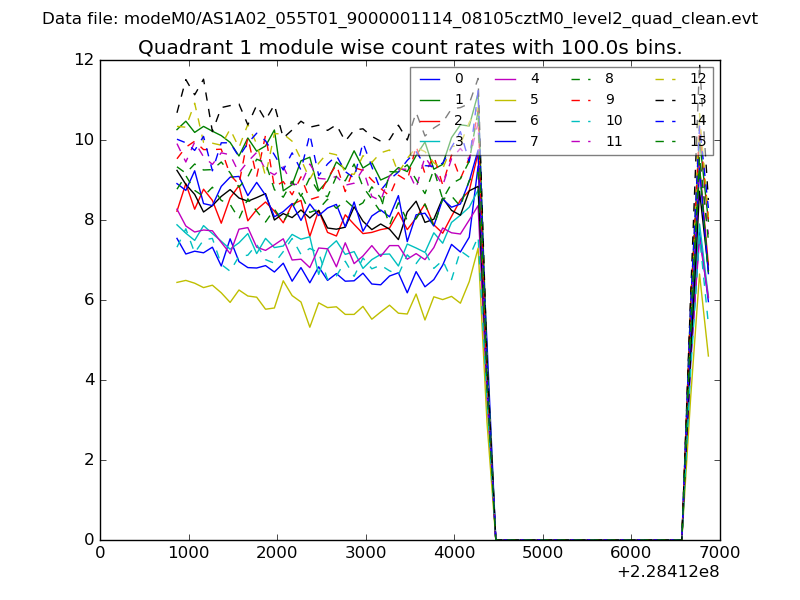
| Module-wise count rates for Quadrant A Data is divided into 100 sec bins |
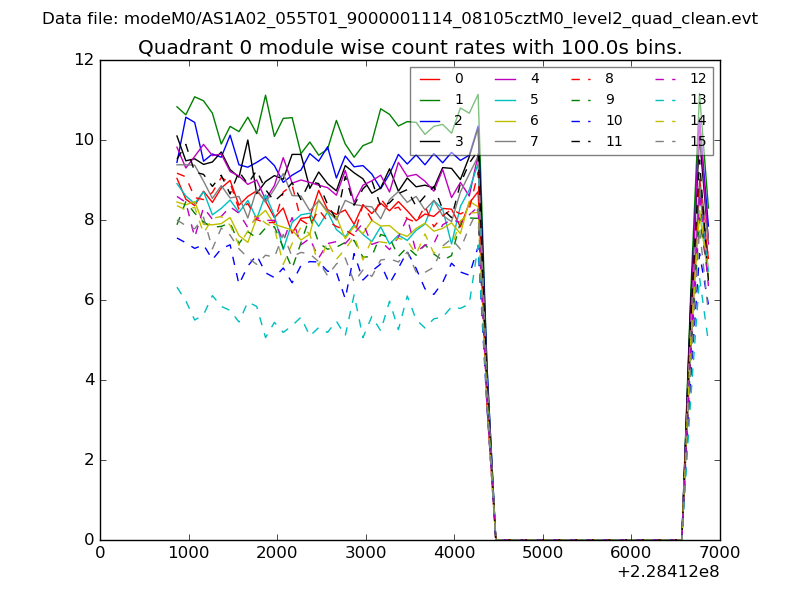 |
 |
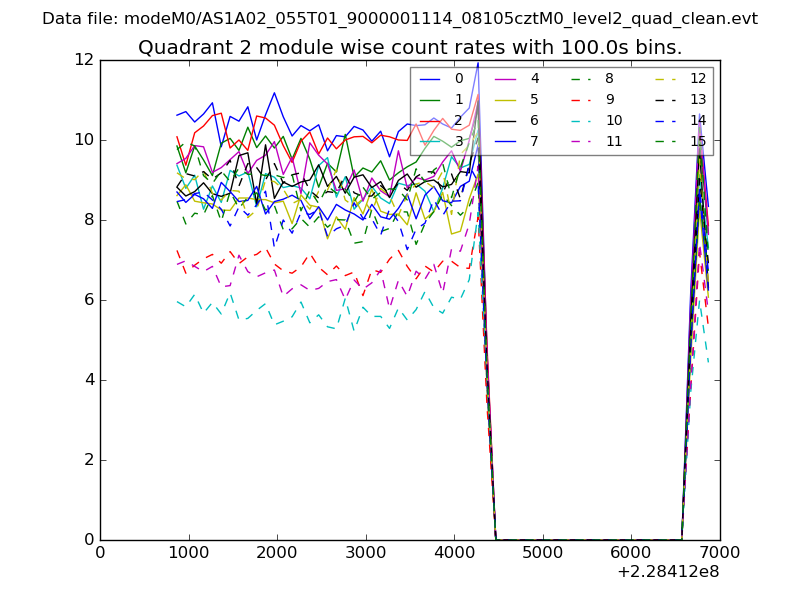
| Module-wise count rates for Quadrant B Data is divided into 100 sec bins |
 |
 |
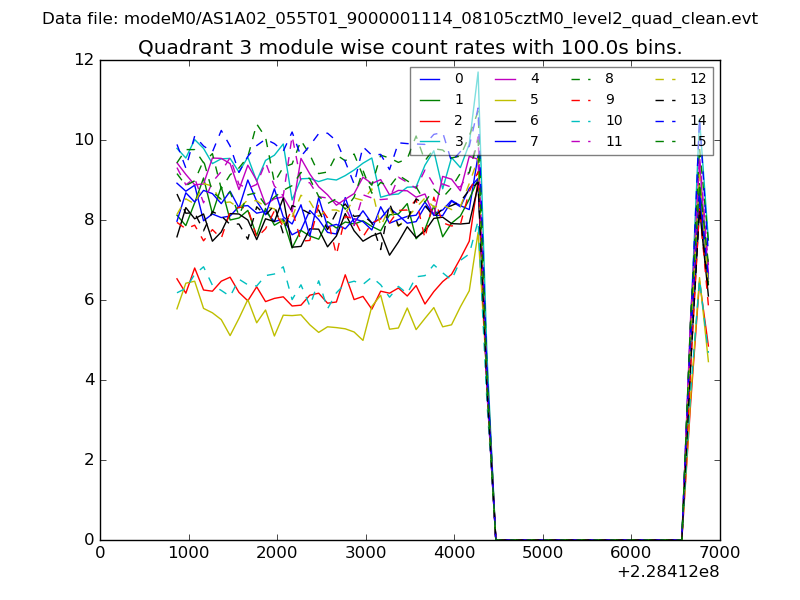
| Module-wise count rates for Quadrant C Data is divided into 100 sec bins |
 |
 |
| Module-wise count rates for Quadrant D Data is divided into 100 sec bins |
 |
 |
| Parameter | Plot |
|---|---|
| CZT HV Monitor | 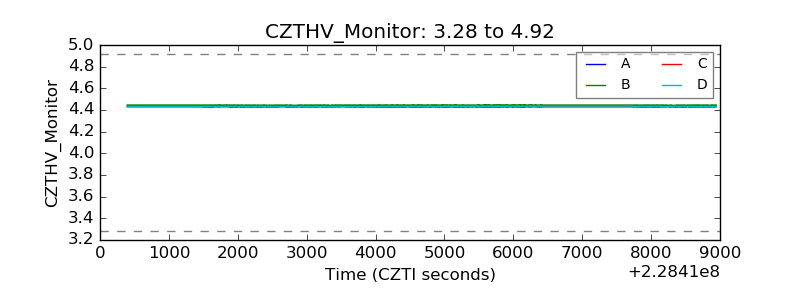 |
| D_VDD | 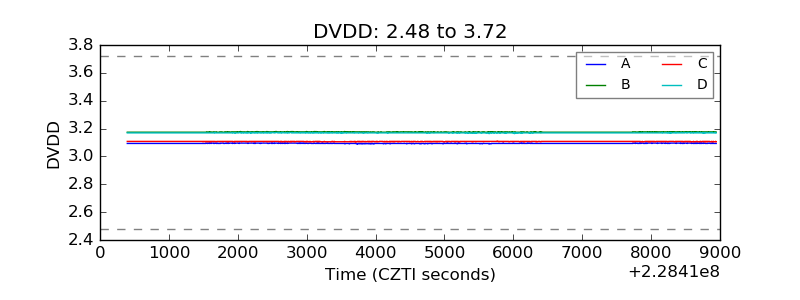 |
| Temperature 1 | 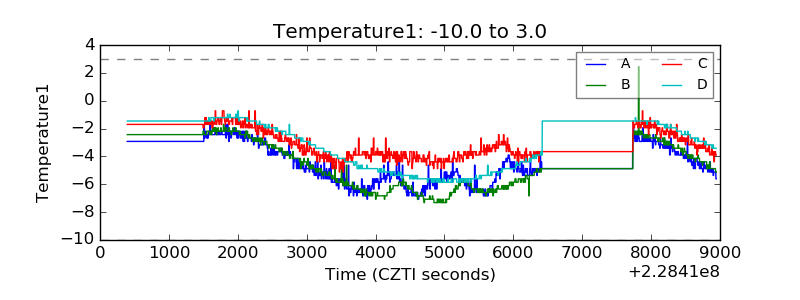 |
| Veto HV Monitor | 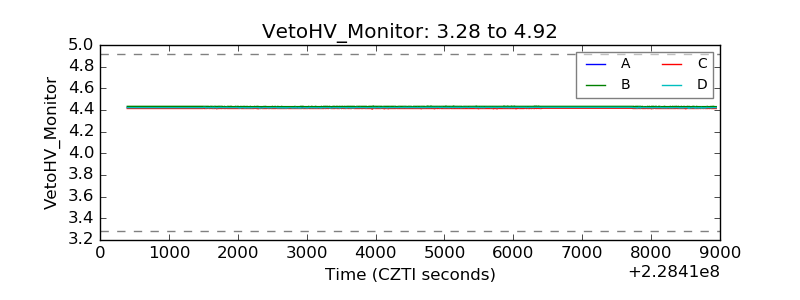 |
| Veto LLD | 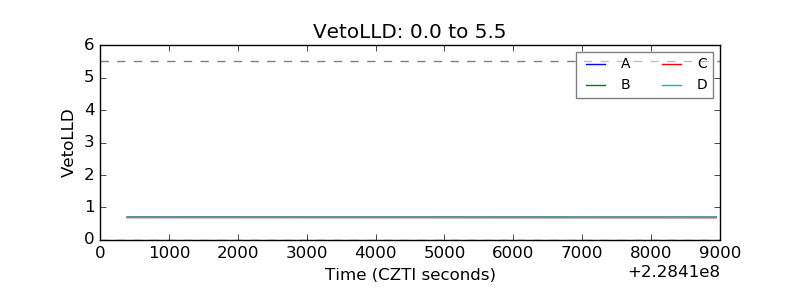 |
| Alpha Counter |  |
| _CPM_Rate | 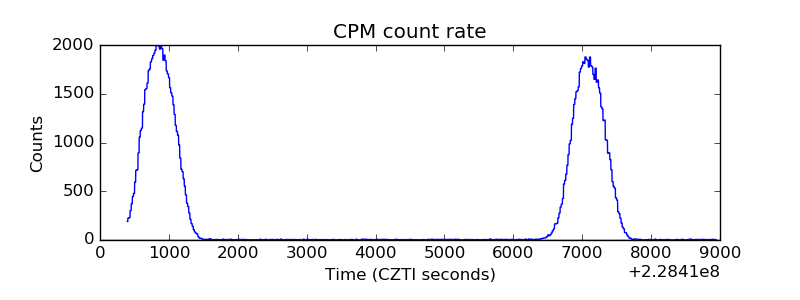 |
| CZT Counter | 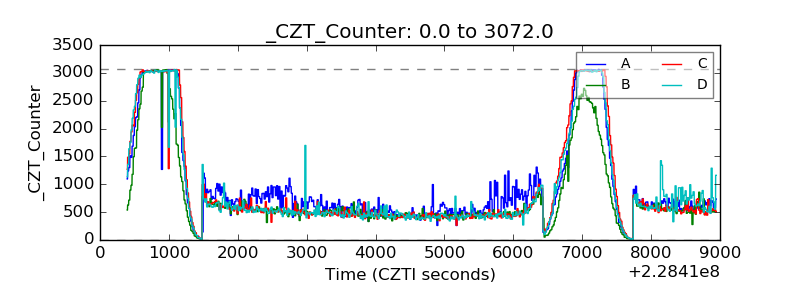 |
| +2.5 Volts monitor |  |
| +5 Volts monitor | 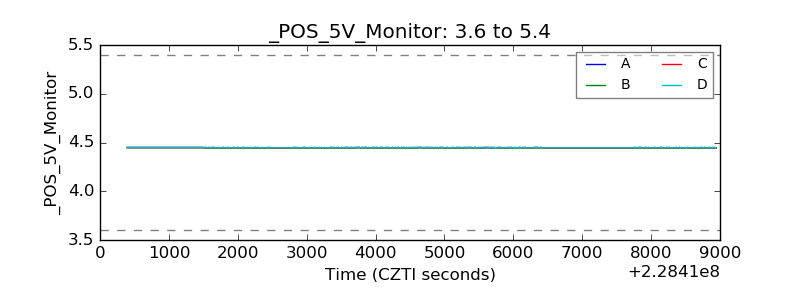 |
| _ROLL_ROT | 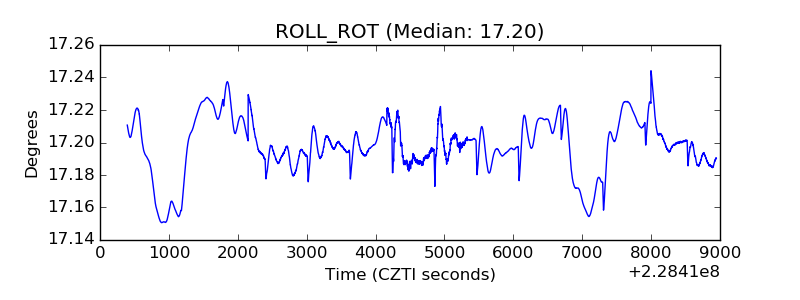 |
| _Roll_DEC | 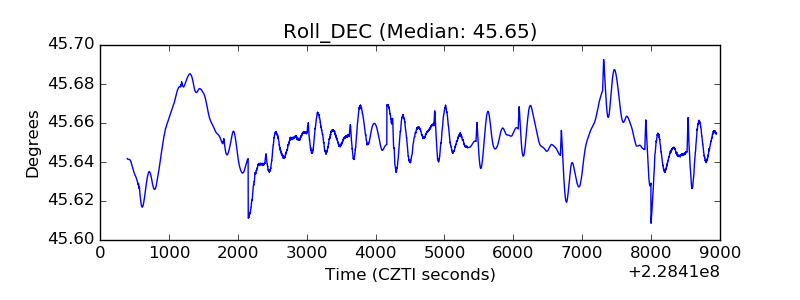 |
| _Roll_RA | 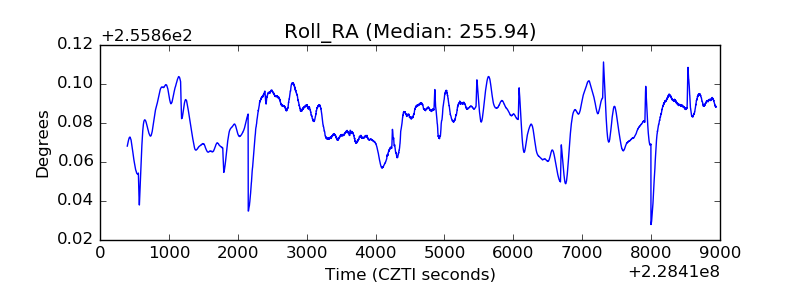 |
| Veto Counter | 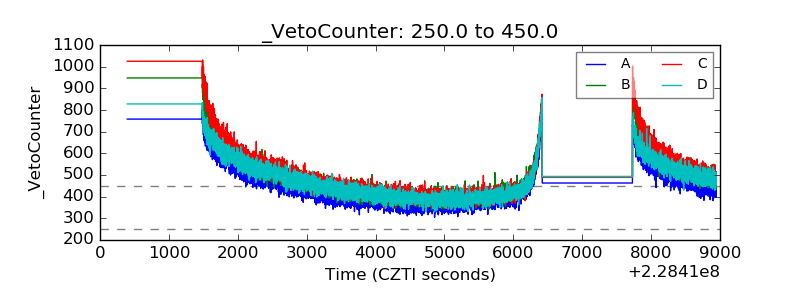 |