| Param | Original file | Final file |
|---|---|---|
| Filename | modeM0/AS1G06_168T15_9000001110cztM0_level2.fits | modeM0/AS1G06_168T15_9000001110cztM0_level2_quad_clean.evt |
| Size (bytes) | 101,836,800 | 87,082,560 |
| Size | 97.1 MB | 83.0 MB |
| Events in quadrant A | 599,300 | 466,428 |
| Events in quadrant B | 586,992 | 491,184 |
| Events in quadrant C | 605,008 | 475,001 |
| Events in quadrant D | 511,932 | 422,680 |
| Mode M0 | |||
|---|---|---|---|
| Quadrant | BADHDUFLAG | Total packets | Discarded packets |
| A | 0 | 24562 | 0 |
| B | 0 | 23629 | 0 |
| C | 0 | 23202 | 0 |
| D | 0 | 27814 | 0 |
| Mode M9 | |||
|---|---|---|---|
| Quadrant | BADHDUFLAG | Total packets | Discarded packets |
| A | 0 | 12 | 0 |
| B | 0 | 12 | 0 |
| C | 0 | 12 | 0 |
| D | 0 | 12 | 0 |
| Mode SS | |||
|---|---|---|---|
| Quadrant | BADHDUFLAG | Total packets | Discarded packets |
| A | 0 | 230 | 0 |
| B | 0 | 230 | 0 |
| C | 0 | 230 | 0 |
| D | 0 | 230 | 0 |
| Quadrant | Total seconds | Saturated seconds | Saturation percentage |
|---|---|---|---|
| A | 11293 | 289 | 2.559107% |
| B | 11293 | 110 | 0.974055% |
| C | 11293 | 46 | 0.407332% |
| D | 11291 | 275 | 2.435568% |
Noise dominated data is calculated using 1-second bins in cleaned event files. If a bin has >2000 counts, and if more than 50% of those come from <1% of pixels, then it is considered to be noise-dominated and hence unusable.
| Quadrant | # 1 sec bins | Bins with >0 counts | Bins with >2000 counts | High rate bins dominated by noise | Noise dominated (total time) | Noise dominated (detector-on time) | Marked lightcurve |
|---|---|---|---|---|---|---|---|
| A | 12403 | 11294 | 0 | 0 | 0.00% | 0.00% |  |
| B | 12403 | 11293 | 0 | 0 | 0.00% | 0.00% |  |
| C | 12403 | 11293 | 0 | 0 | 0.00% | 0.00% |  |
| D | 12403 | 11288 | 0 | 0 | 0.00% | 0.00% |  |
Top three noisy pixels from each quadrant. If the there are fewer than three noisy pixels in the level2.evt file, extra rows are filled as -1
| Pixel properties | Quadrant properties | ||||||
|---|---|---|---|---|---|---|---|
| Quadrant | DetID | PixID | Counts | Sigma | Mean | Median | Sigma |
| A | 0 | 29 | 580 | 10.44 | 155 | 146 | 41.6 |
| A | 7 | 110 | 523 | 9.07 | 155 | 146 | 41.6 |
| A | 0 | 30 | 444 | 7.17 | 155 | 146 | 41.6 |
| B | 2 | 9 | 515 | 10.94 | 155 | 147 | 33.6 |
| B | 2 | 8 | 412 | 7.88 | 155 | 147 | 33.6 |
| B | 3 | 17 | 387 | 7.14 | 155 | 147 | 33.6 |
| C | 1 | 80 | 465 | 7.23 | 159 | 149 | 43.7 |
| C | 1 | 81 | 442 | 6.7 | 159 | 149 | 43.7 |
| C | 2 | 191 | 431 | 6.45 | 159 | 149 | 43.7 |
| D | 3 | 14 | 378 | 6.05 | 145 | 132 | 40.6 |
| D | 10 | 189 | 364 | 5.7 | 145 | 132 | 40.6 |
| D | 15 | 30 | 362 | 5.66 | 145 | 132 | 40.6 |
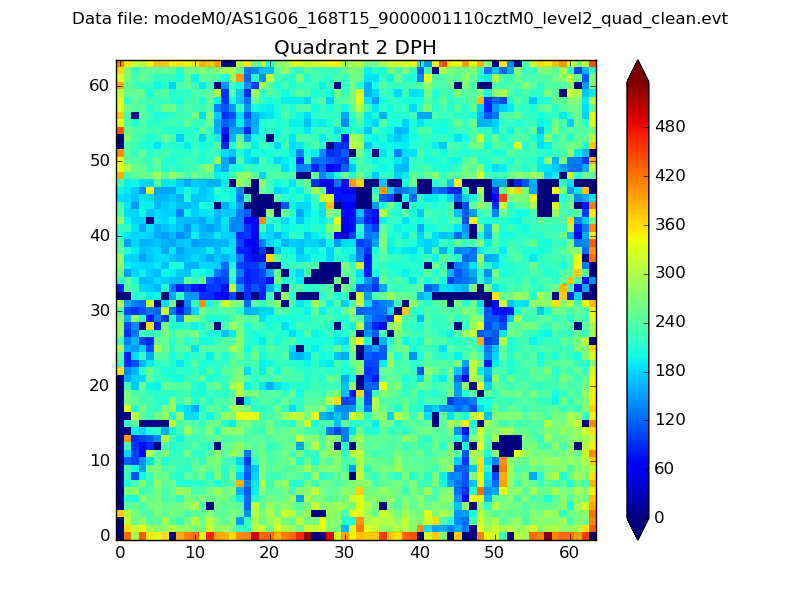
Histogram calculated using DETX and DETY for each event in the final _common_clean file
| Quadrant A |  |
 |
Quadrant B |
|---|---|---|---|
| Quadrant D |  |
 |
Quadrant C |
| Plot type | Count rate plots | Images |
|---|---|---|
| Comparison with Poisson distribution Blue bars denote a histogram of data divided into 1 sec bins. Red curve is a Poisson curve with rate = median count rate of data. |
 |
 |
| Quadrant-wise count rates Data is divided into 100 sec bins |
 |
|
| Module-wise count rates for Quadrant A Data is divided into 100 sec bins |
 |
 |
| Module-wise count rates for Quadrant B Data is divided into 100 sec bins |
 |
 |
| Module-wise count rates for Quadrant C Data is divided into 100 sec bins |
 |
 |
| Module-wise count rates for Quadrant D Data is divided into 100 sec bins |
 |
 |
| Parameter | Plot |
|---|---|
| CZT HV Monitor |  |
| D_VDD | 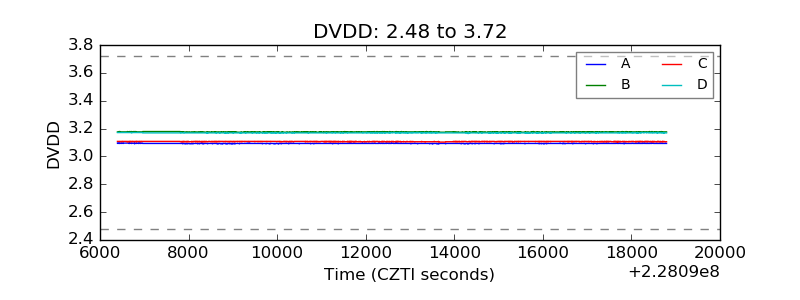 |
| Temperature 1 |  |
| Veto HV Monitor |  |
| Veto LLD |  |
| Alpha Counter |  |
| _CPM_Rate |  |
| CZT Counter |  |
| +2.5 Volts monitor |  |
| +5 Volts monitor |  |
| _ROLL_ROT |  |
| _Roll_DEC |  |
| _Roll_RA | 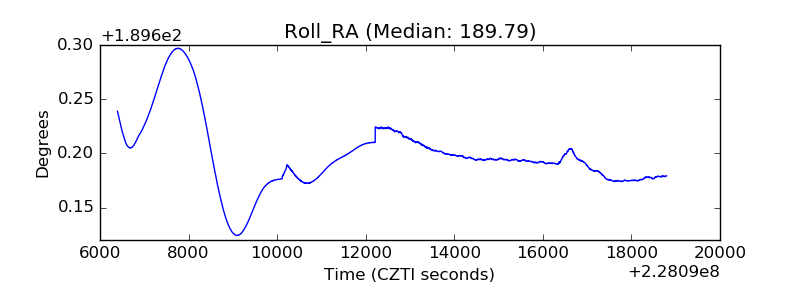 |
| Veto Counter |  |