| Param | Original file | Final file |
|---|---|---|
| Filename | modeM0/AS1G06_168T15_9000001110_08051cztM0_level2.evt | modeM0/AS1G06_168T15_9000001110_08051cztM0_level2_quad_clean.evt |
| Size (bytes) | 506,453,760 | 102,070,080 |
| Size | 483.0 MB | 97.3 MB |
| Events in quadrant A | 3,282,030 | 643,683 |
| Events in quadrant B | 3,486,670 | 656,370 |
| Events in quadrant C | 3,349,932 | 658,351 |
| Events in quadrant D | 4,713,625 | 614,626 |
| Mode M0 | |||
|---|---|---|---|
| Quadrant | BADHDUFLAG | Total packets | Discarded packets |
| A | 0 | 15215 | 3 |
| B | 0 | 15586 | 2 |
| C | 0 | 15328 | 2 |
| D | 0 | 19323 | 2 |
| Mode M9 | |||
|---|---|---|---|
| Quadrant | BADHDUFLAG | Total packets | Discarded packets |
| A | 0 | 8 | 0 |
| B | 0 | 8 | 0 |
| C | 0 | 8 | 0 |
| D | 0 | 9 | 0 |
| Mode SS | |||
|---|---|---|---|
| Quadrant | BADHDUFLAG | Total packets | Discarded packets |
| A | 0 | 152 | 0 |
| B | 0 | 152 | 0 |
| C | 0 | 152 | 0 |
| D | 0 | 152 | 0 |
| Quadrant | Total seconds | Saturated seconds | Saturation percentage |
|---|---|---|---|
| A | 7448 | 54 | 0.725027% |
| B | 7448 | 95 | 1.275510% |
| C | 7448 | 40 | 0.537057% |
| D | 7448 | 244 | 3.276047% |
Noise dominated data is calculated using 1-second bins in cleaned event files. If a bin has >2000 counts, and if more than 50% of those come from <1% of pixels, then it is considered to be noise-dominated and hence unusable.
| Quadrant | # 1 sec bins | Bins with >0 counts | Bins with >2000 counts | High rate bins dominated by noise | Noise dominated (total time) | Noise dominated (detector-on time) | Marked lightcurve |
|---|---|---|---|---|---|---|---|
| A | 7718 | 7450 | 0 | 0 | 0.00% | 0.00% | 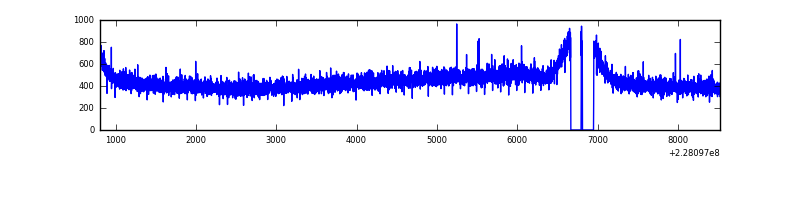 |
| B | 7718 | 7450 | 9 | 9 | 0.12% | 0.12% | 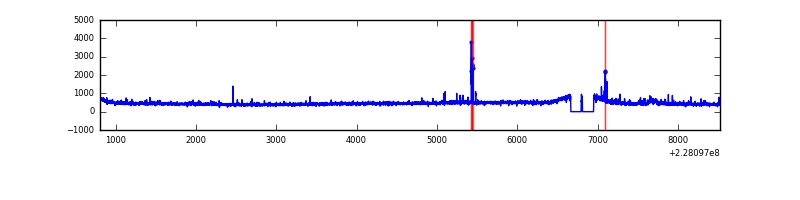 |
| C | 7718 | 7450 | 0 | 0 | 0.00% | 0.00% | 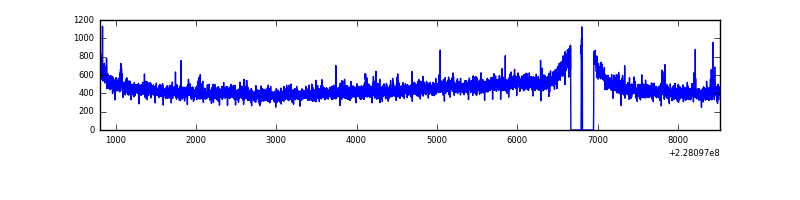 |
| D | 7718 | 7450 | 187 | 187 | 2.42% | 2.51% | 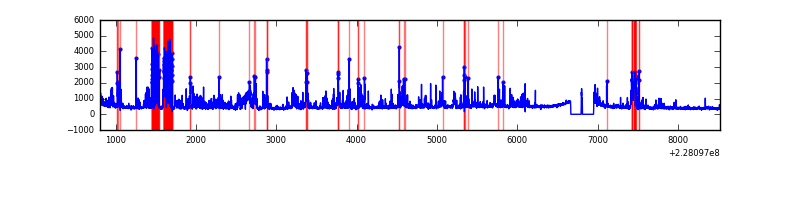 |
Top three noisy pixels from each quadrant. If the there are fewer than three noisy pixels in the level2.evt file, extra rows are filled as -1
| Pixel properties | Quadrant properties | ||||||
|---|---|---|---|---|---|---|---|
| Quadrant | DetID | PixID | Counts | Sigma | Mean | Median | Sigma |
| A | 0 | 226 | 7801 | 40.09 | 849 | 831 | 173.9 |
| A | 12 | 194 | 7479 | 38.24 | 849 | 831 | 173.9 |
| A | 15 | 234 | 6463 | 32.39 | 849 | 831 | 173.9 |
| B | 5 | 250 | 96272 | 574.69 | 860 | 835 | 166.1 |
| B | 4 | 81 | 41826 | 246.84 | 860 | 835 | 166.1 |
| B | 12 | 111 | 18413 | 105.85 | 860 | 835 | 166.1 |
| C | 1 | 16 | 58618 | 297.09 | 839 | 843 | 194.5 |
| C | 14 | 67 | 13675 | 65.98 | 839 | 843 | 194.5 |
| C | 13 | 61 | 6390 | 28.52 | 839 | 843 | 194.5 |
| D | 1 | 52 | 1057418 | 4924.05 | 811 | 790 | 214.6 |
| D | 4 | 95 | 205537 | 954.15 | 811 | 790 | 214.6 |
| D | 2 | 136 | 164245 | 761.73 | 811 | 790 | 214.6 |
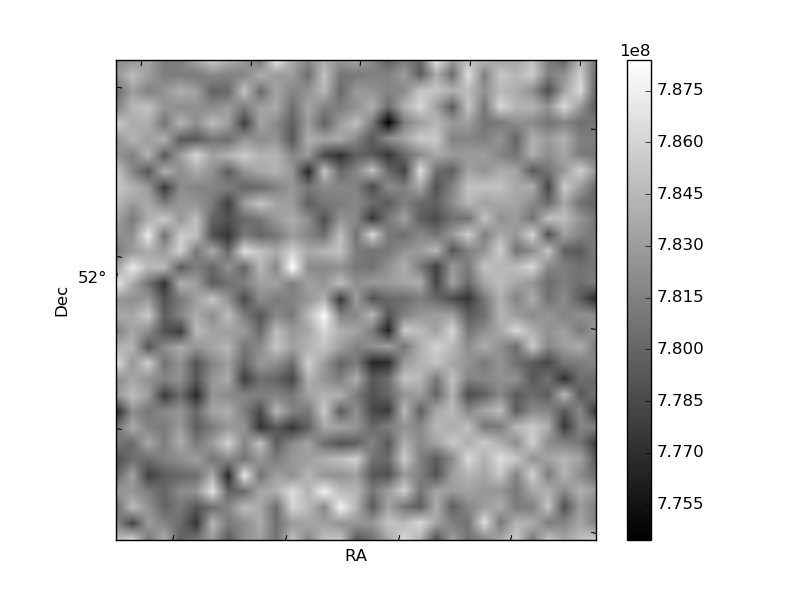
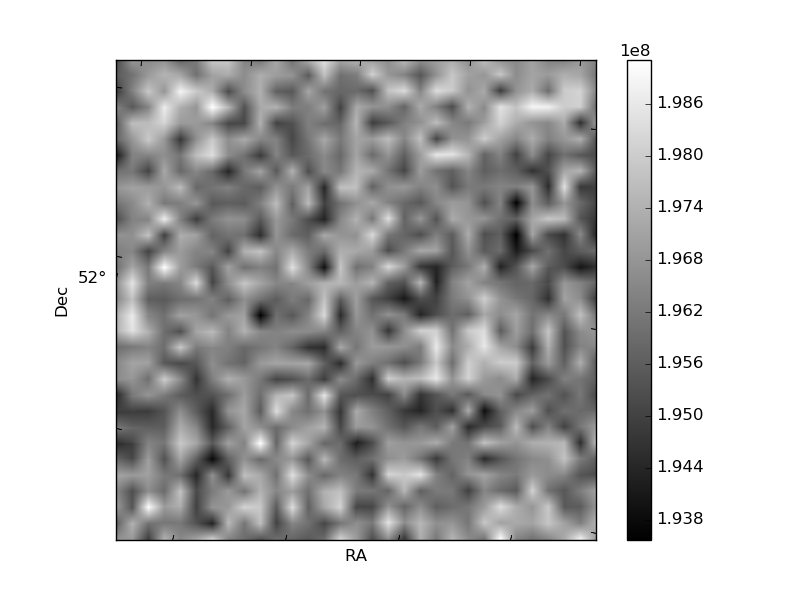
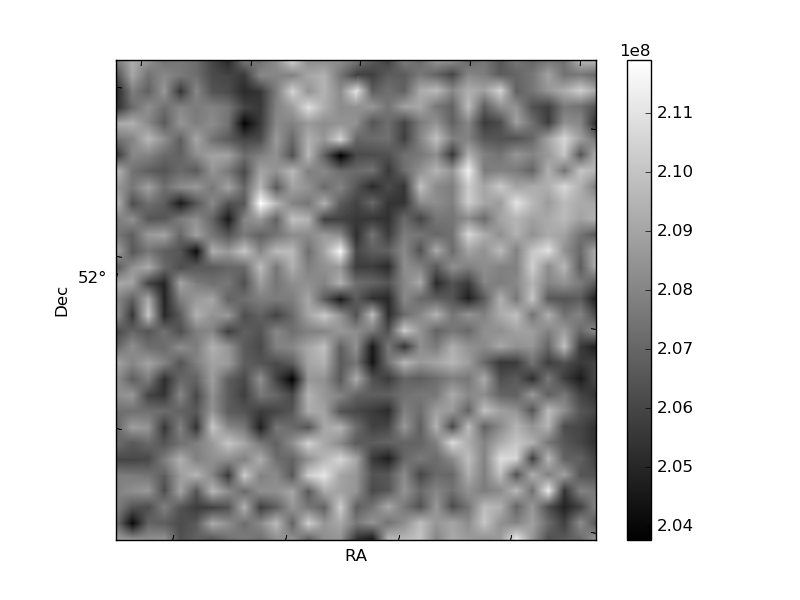
Histogram calculated using DETX and DETY for each event in the final _common_clean file
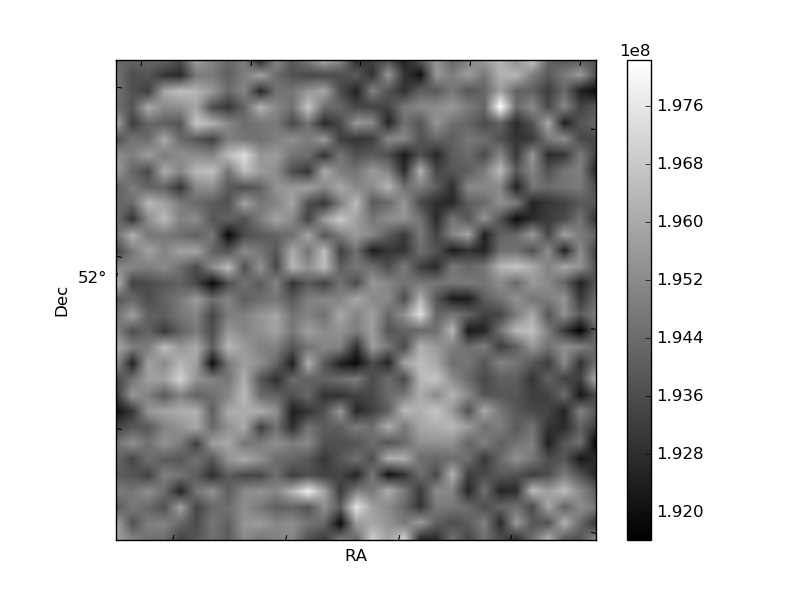
| Quadrant A | 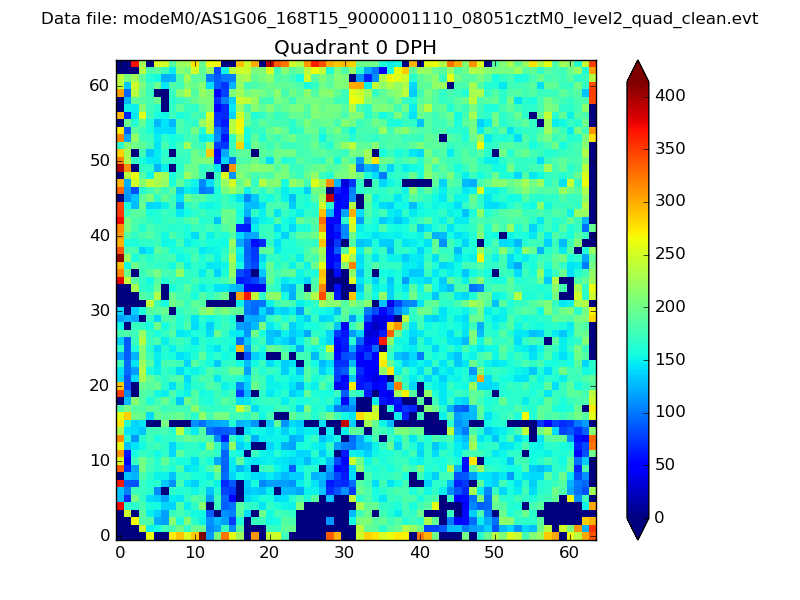 |
 |
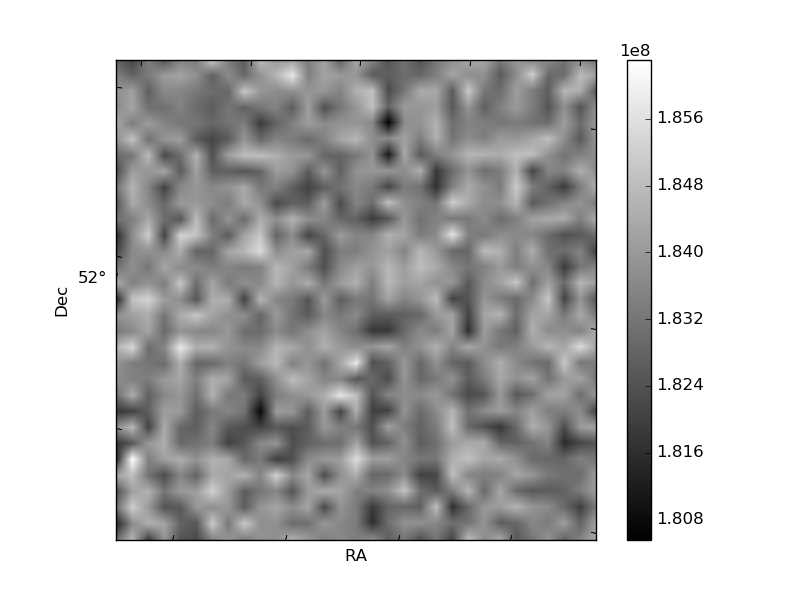
Quadrant B |
|---|---|---|---|
| Quadrant D | 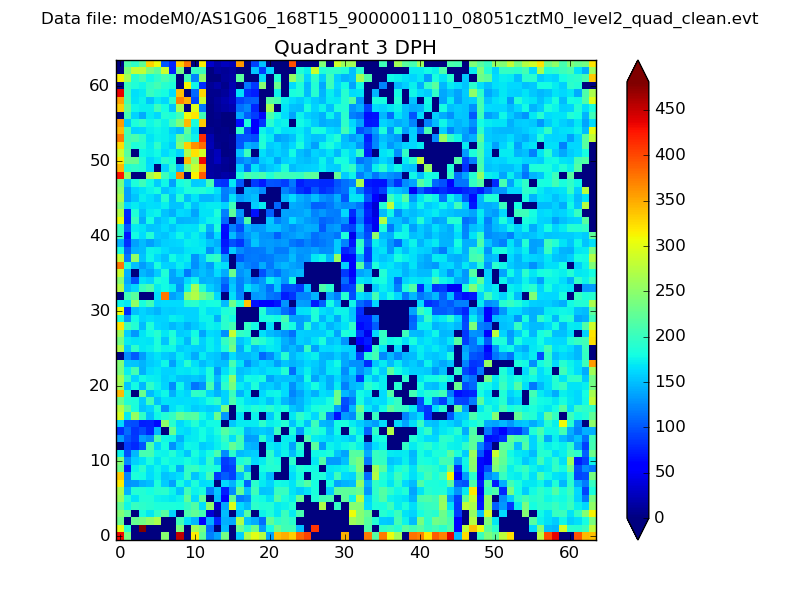 |
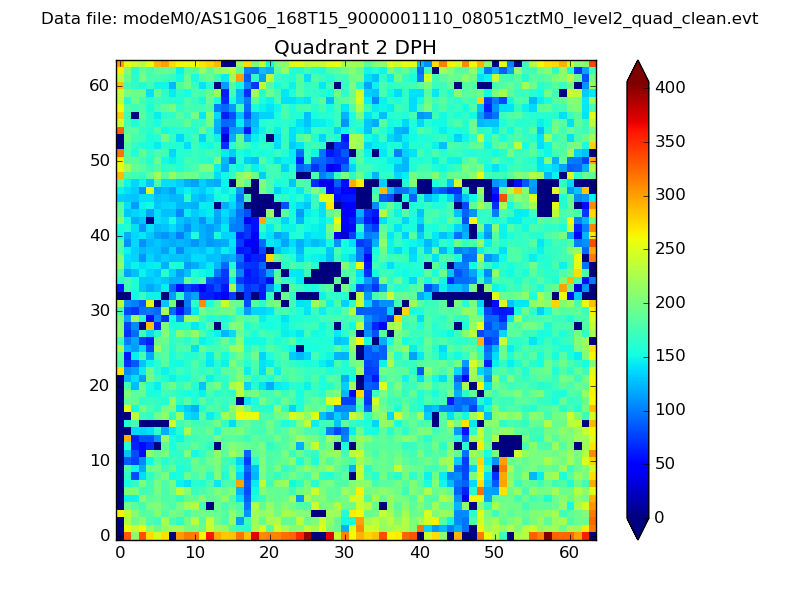 |
Quadrant C |
| Plot type | Count rate plots | Images |
|---|---|---|
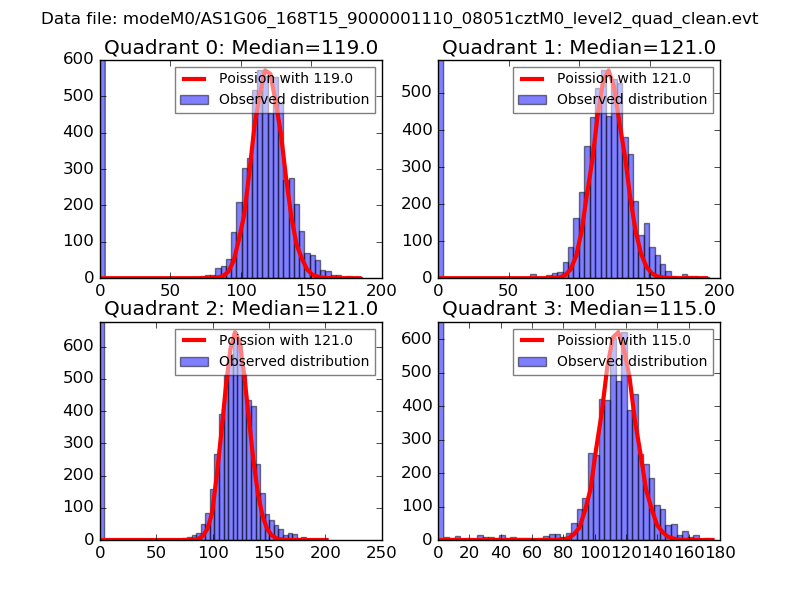
| Comparison with Poisson distribution Blue bars denote a histogram of data divided into 1 sec bins. Red curve is a Poisson curve with rate = median count rate of data. |
 |
 |
| Quadrant-wise count rates Data is divided into 100 sec bins |
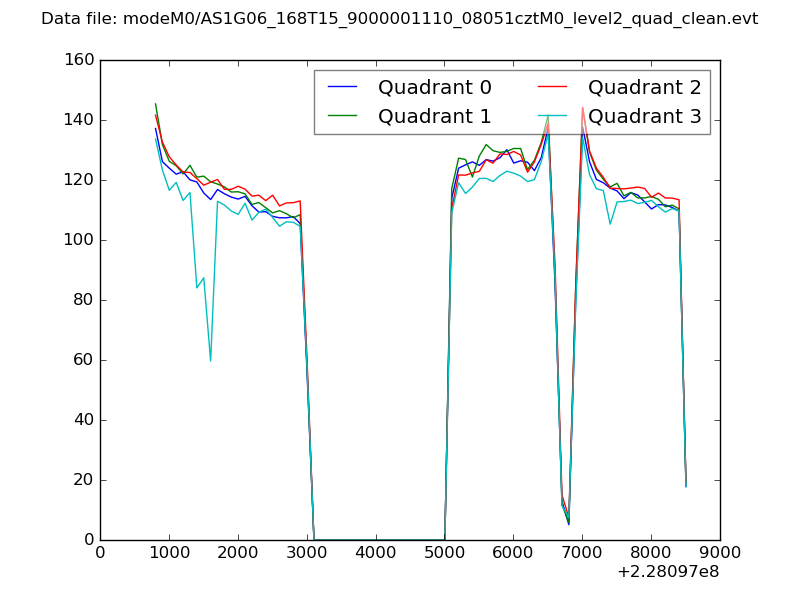 |
|
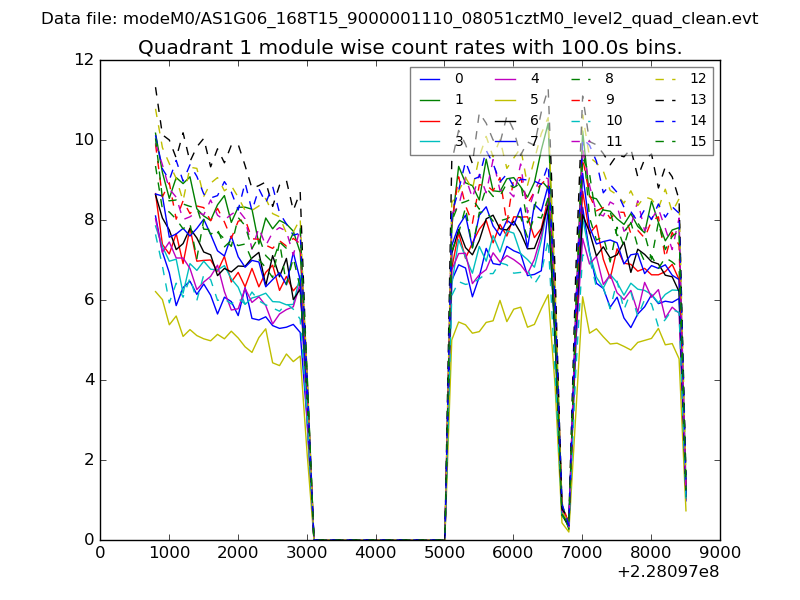
| Module-wise count rates for Quadrant A Data is divided into 100 sec bins |
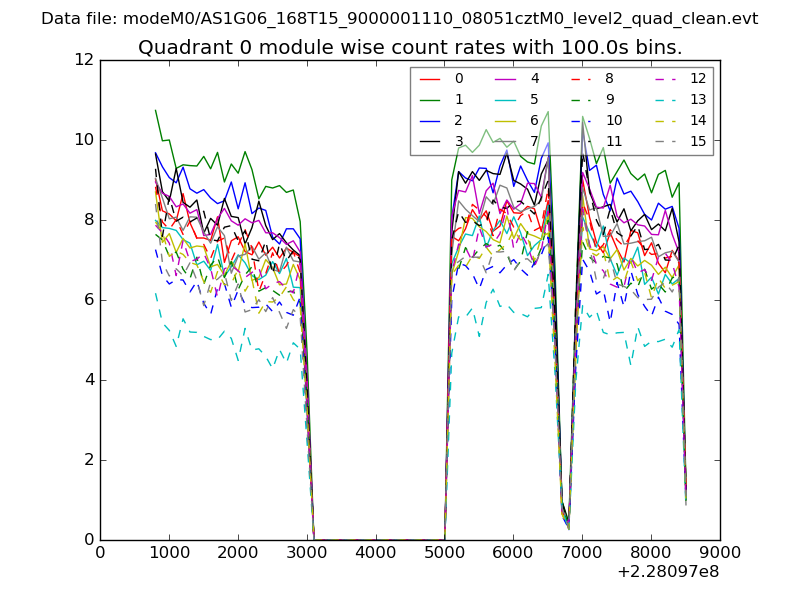 |
 |
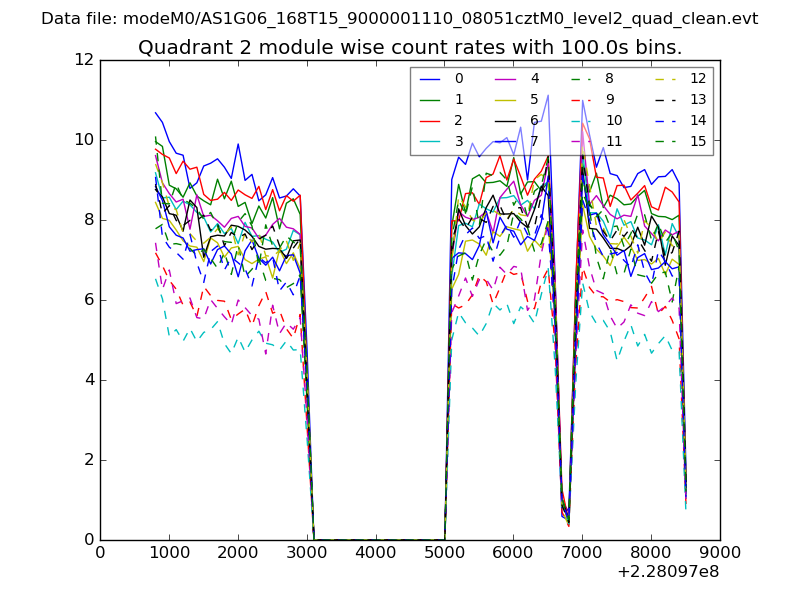
| Module-wise count rates for Quadrant B Data is divided into 100 sec bins |
 |
 |
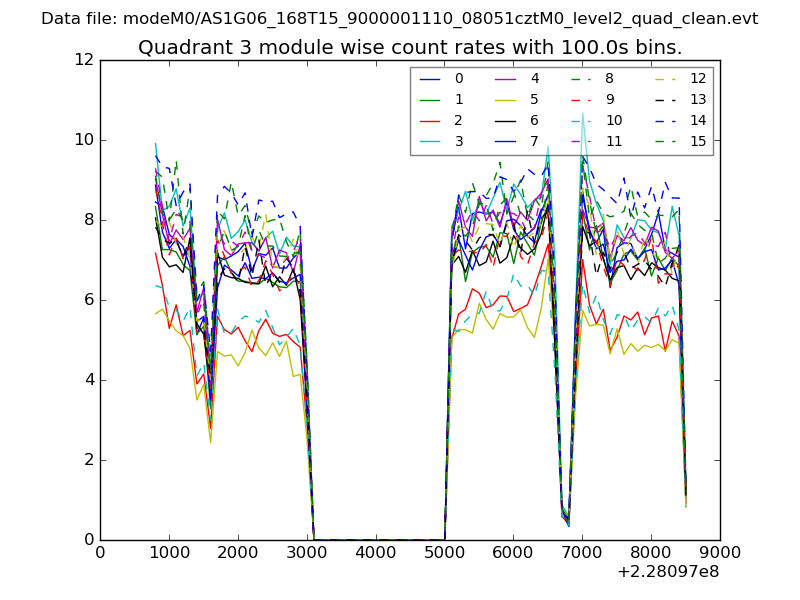
| Module-wise count rates for Quadrant C Data is divided into 100 sec bins |
 |
 |
| Module-wise count rates for Quadrant D Data is divided into 100 sec bins |
 |
 |
| Parameter | Plot |
|---|---|
| CZT HV Monitor | 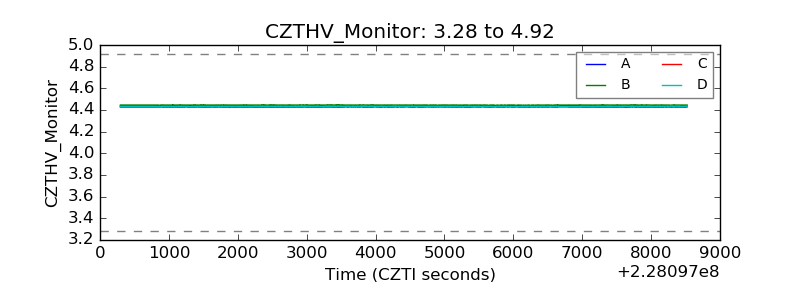 |
| D_VDD | 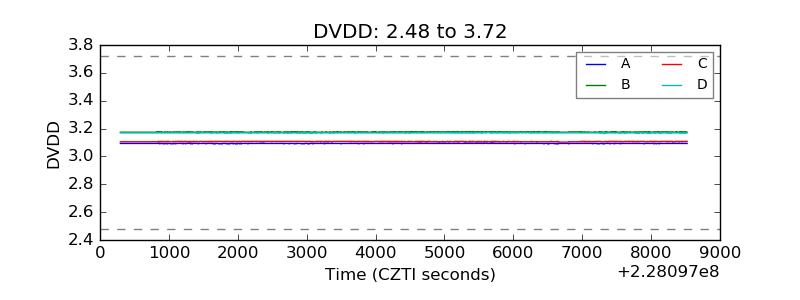 |
| Temperature 1 | 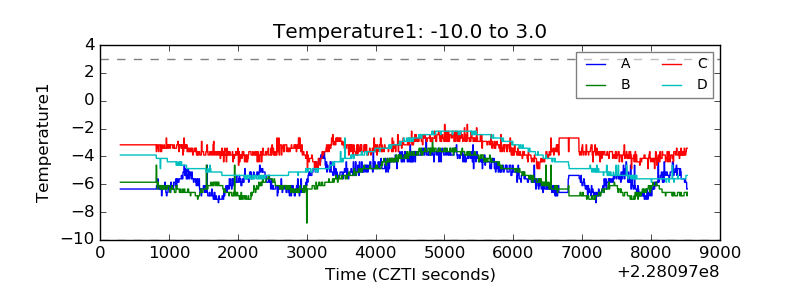 |
| Veto HV Monitor | 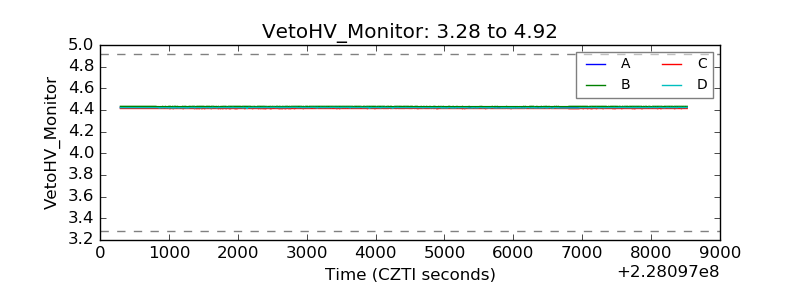 |
| Veto LLD | 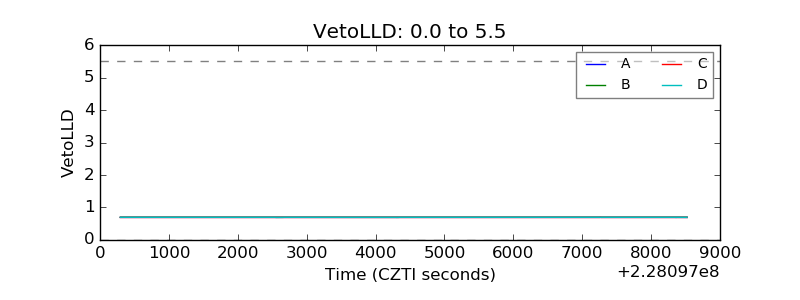 |
| Alpha Counter | 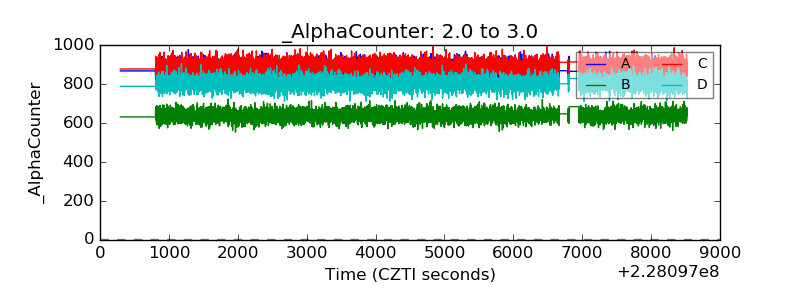 |
| _CPM_Rate | 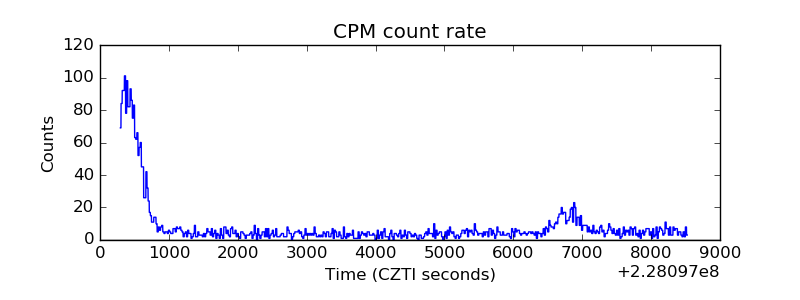 |
| CZT Counter | 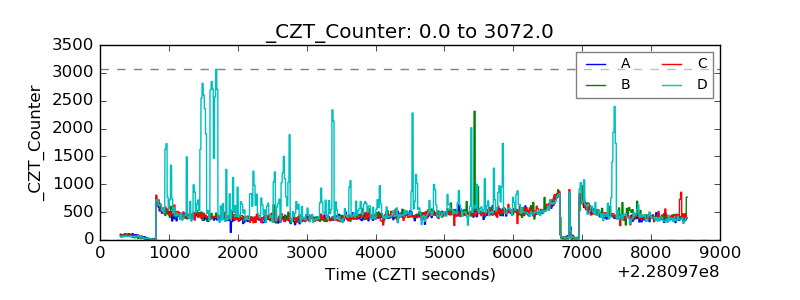 |
| +2.5 Volts monitor |  |
| +5 Volts monitor |  |
| _ROLL_ROT | 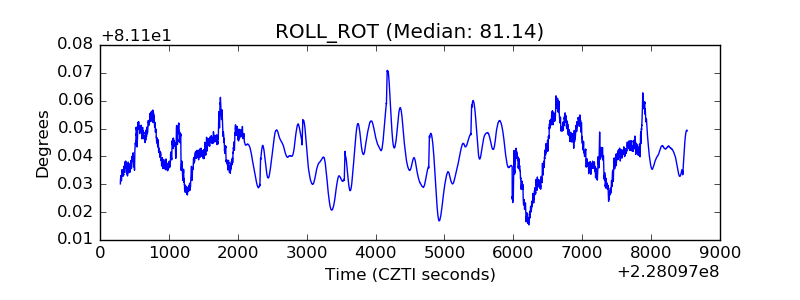 |
| _Roll_DEC |  |
| _Roll_RA | 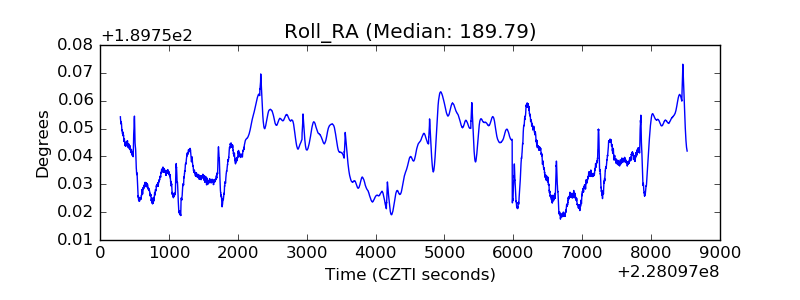 |
| Veto Counter | 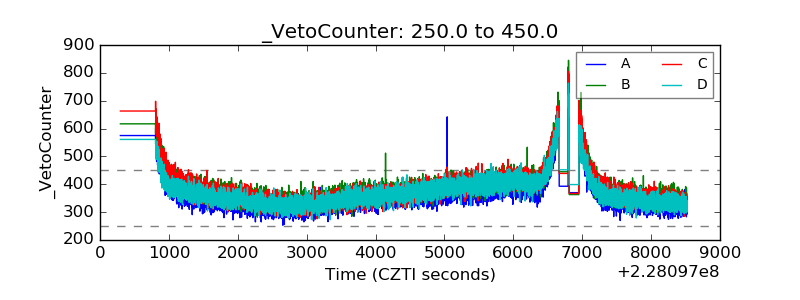 |