| Param | Original file | Final file |
|---|---|---|
| Filename | modeM0/AS1G06_168T16_9000001112cztM0_level2.fits | modeM0/AS1G06_168T16_9000001112cztM0_level2_quad_clean.evt |
| Size (bytes) | 58,305,600 | 49,461,120 |
| Size | 55.6 MB | 47.2 MB |
| Events in quadrant A | 344,742 | 277,086 |
| Events in quadrant B | 335,710 | 276,953 |
| Events in quadrant C | 347,316 | 268,600 |
| Events in quadrant D | 282,162 | 218,682 |
| Mode SS | |||
|---|---|---|---|
| Quadrant | BADHDUFLAG | Total packets | Discarded packets |
| A | 0 | 130 | 0 |
| B | 0 | 130 | 0 |
| C | 0 | 130 | 0 |
| D | 0 | 130 | 0 |
| Mode M0 | |||
|---|---|---|---|
| Quadrant | BADHDUFLAG | Total packets | Discarded packets |
| A | 0 | 14422 | 0 |
| B | 0 | 14557 | 0 |
| C | 0 | 13447 | 0 |
| D | 0 | 19798 | 0 |
| Quadrant | Total seconds | Saturated seconds | Saturation percentage |
|---|---|---|---|
| A | 6535 | 82 | 1.254782% |
| B | 6535 | 176 | 2.693191% |
| C | 6535 | 20 | 0.306044% |
| D | 6535 | 670 | 10.252487% |
Noise dominated data is calculated using 1-second bins in cleaned event files. If a bin has >2000 counts, and if more than 50% of those come from <1% of pixels, then it is considered to be noise-dominated and hence unusable.
| Quadrant | # 1 sec bins | Bins with >0 counts | Bins with >2000 counts | High rate bins dominated by noise | Noise dominated (total time) | Noise dominated (detector-on time) | Marked lightcurve |
|---|---|---|---|---|---|---|---|
| A | 6580 | 6535 | 0 | 0 | 0.00% | 0.00% | 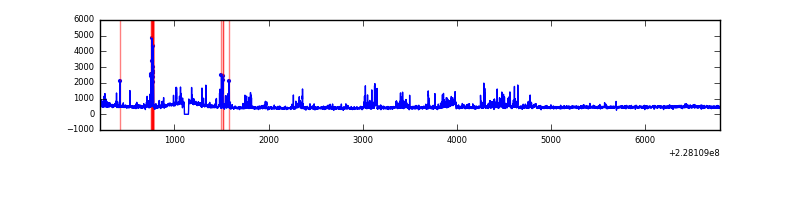 |
| B | 6580 | 6535 | 0 | 0 | 0.00% | 0.00% |  |
| C | 6580 | 6535 | 0 | 0 | 0.00% | 0.00% |  |
| D | 6580 | 6529 | 0 | 0 | 0.00% | 0.00% |  |
Top three noisy pixels from each quadrant. If the there are fewer than three noisy pixels in the level2.evt file, extra rows are filled as -1
| Pixel properties | Quadrant properties | ||||||
|---|---|---|---|---|---|---|---|
| Quadrant | DetID | PixID | Counts | Sigma | Mean | Median | Sigma |
| A | 14 | 188 | 344 | 10.44 | 89 | 83 | 25.0 |
| A | 0 | 29 | 320 | 9.48 | 89 | 83 | 25.0 |
| A | 14 | 204 | 298 | 8.6 | 89 | 83 | 25.0 |
| B | 2 | 9 | 273 | 9.2 | 88 | 84 | 20.5 |
| B | 14 | 254 | 239 | 7.55 | 88 | 84 | 20.5 |
| B | 12 | 226 | 232 | 7.2 | 88 | 84 | 20.5 |
| C | 1 | 81 | 283 | 7.61 | 91 | 85 | 26.0 |
| C | 1 | 80 | 253 | 6.46 | 91 | 85 | 26.0 |
| C | 12 | 241 | 248 | 6.27 | 91 | 85 | 26.0 |
| D | 4 | 246 | 253 | 7.79 | 80 | 73 | 23.1 |
| D | 6 | 231 | 230 | 6.8 | 80 | 73 | 23.1 |
| D | 3 | 14 | 221 | 6.41 | 80 | 73 | 23.1 |
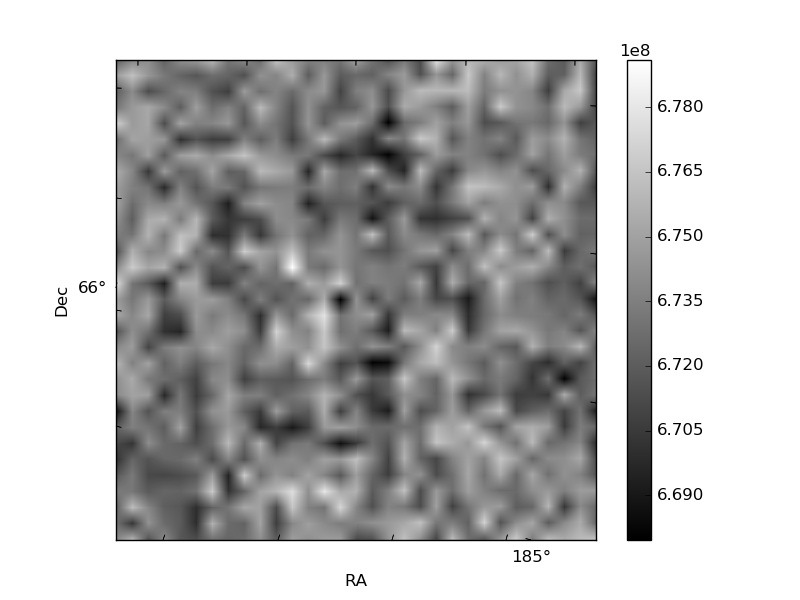
Histogram calculated using DETX and DETY for each event in the final _common_clean file
| Quadrant A |  |
 |
Quadrant B |
|---|---|---|---|
| Quadrant D | 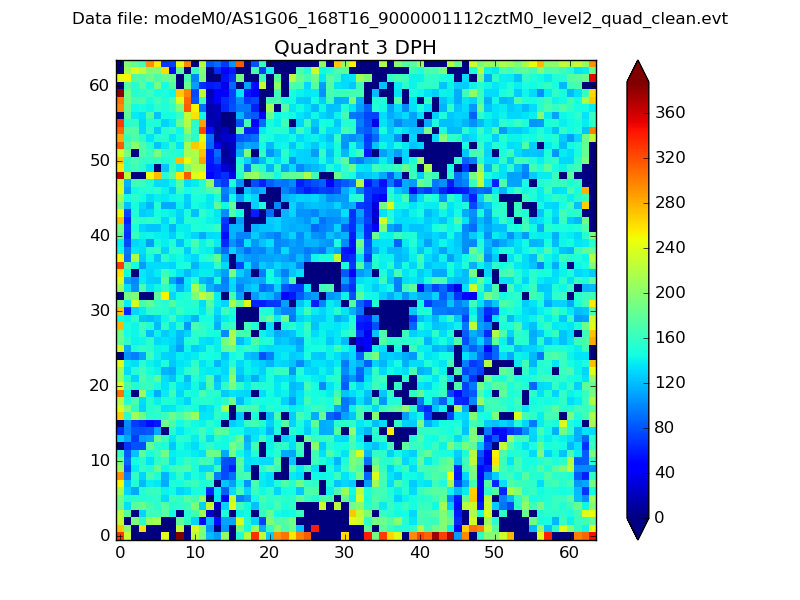 |
 |
Quadrant C |
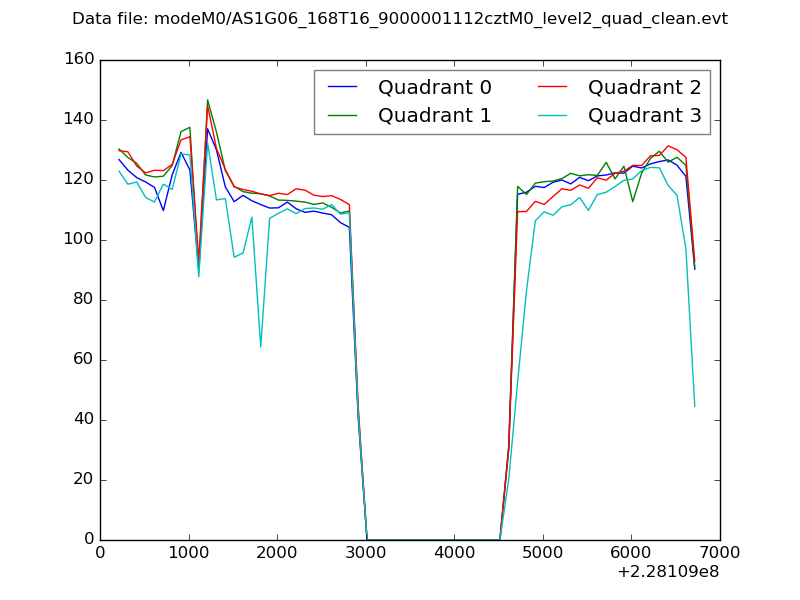
| Plot type | Count rate plots | Images |
|---|---|---|
| Comparison with Poisson distribution Blue bars denote a histogram of data divided into 1 sec bins. Red curve is a Poisson curve with rate = median count rate of data. |
 |
 |
| Quadrant-wise count rates Data is divided into 100 sec bins |
 |
|
| Module-wise count rates for Quadrant A Data is divided into 100 sec bins |
 |
 |
| Module-wise count rates for Quadrant B Data is divided into 100 sec bins |
 |
 |
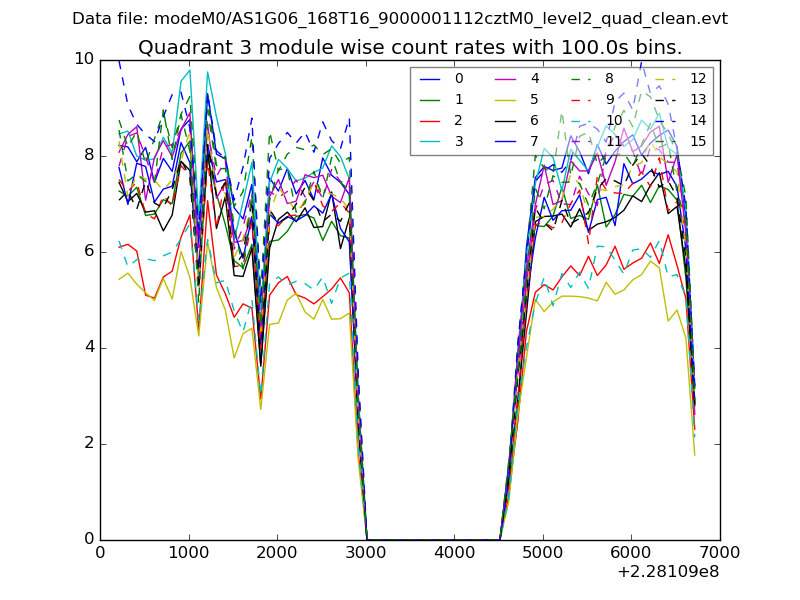
| Module-wise count rates for Quadrant C Data is divided into 100 sec bins |
 |
 |
| Module-wise count rates for Quadrant D Data is divided into 100 sec bins |
 |
 |
| Parameter | Plot |
|---|---|
| CZT HV Monitor |  |
| D_VDD | 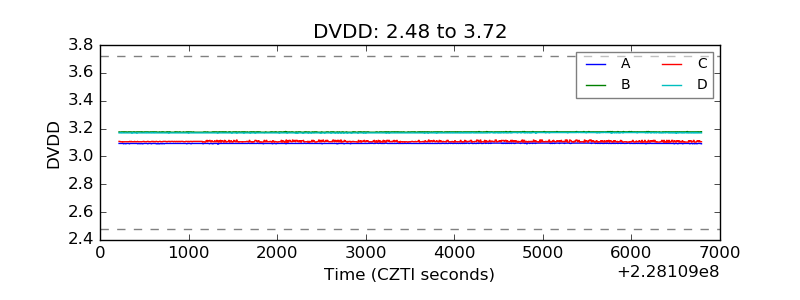 |
| Temperature 1 |  |
| Veto HV Monitor | 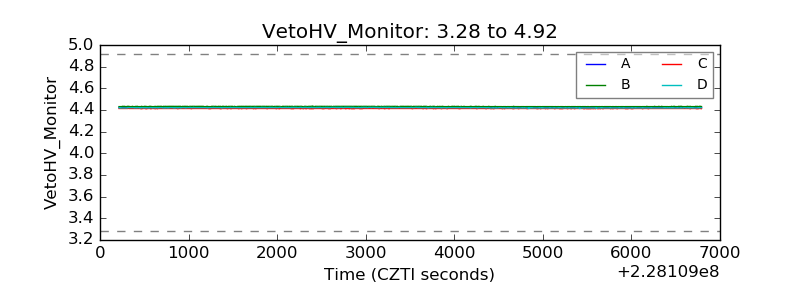 |
| Veto LLD |  |
| Alpha Counter | 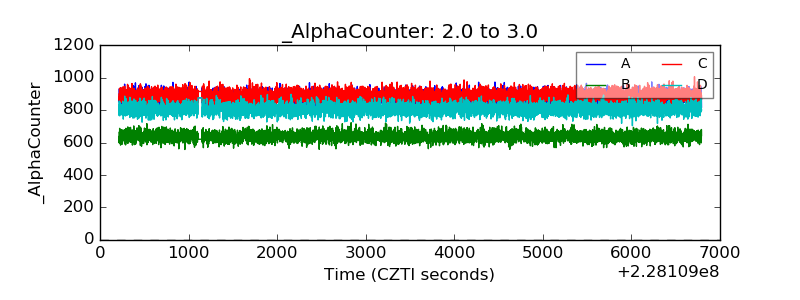 |
| _CPM_Rate | 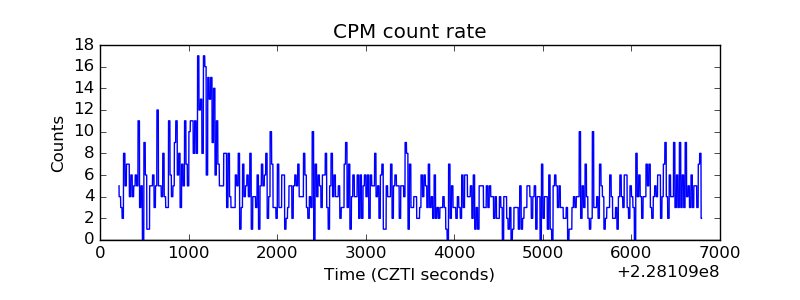 |
| CZT Counter |  |
| +2.5 Volts monitor |  |
| +5 Volts monitor |  |
| _ROLL_ROT | 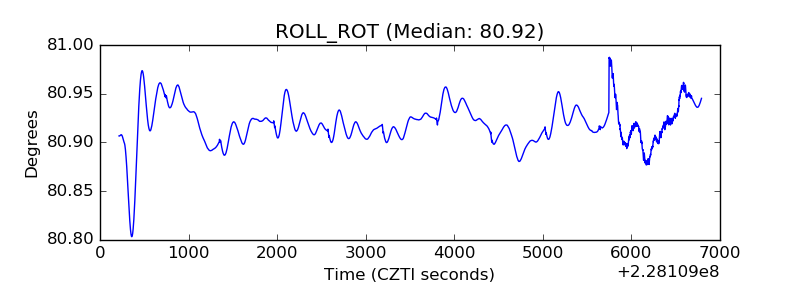 |
| _Roll_DEC |  |
| _Roll_RA |  |
| Veto Counter |  |