| Param | Original file | Final file |
|---|---|---|
| Filename | modeM0/AS1G06_168T16_9000001112_08052cztM0_level2.evt | modeM0/AS1G06_168T16_9000001112_08052cztM0_level2_quad_clean.evt |
| Size (bytes) | 194,592,960 | 46,321,920 |
| Size | 185.6 MB | 44.2 MB |
| Events in quadrant A | 1,384,017 | 300,956 |
| Events in quadrant B | 1,265,129 | 313,462 |
| Events in quadrant C | 1,221,441 | 314,956 |
| Events in quadrant D | 1,846,072 | 288,906 |
| Mode SS | |||
|---|---|---|---|
| Quadrant | BADHDUFLAG | Total packets | Discarded packets |
| A | 0 | 52 | 0 |
| B | 0 | 52 | 0 |
| C | 0 | 52 | 0 |
| D | 0 | 52 | 0 |
| Mode M0 | |||
|---|---|---|---|
| Quadrant | BADHDUFLAG | Total packets | Discarded packets |
| A | 0 | 5963 | 2 |
| B | 0 | 5530 | 1 |
| C | 0 | 5465 | 1 |
| D | 0 | 7278 | 1 |
| Quadrant | Total seconds | Saturated seconds | Saturation percentage |
|---|---|---|---|
| A | 2565 | 77 | 3.001949% |
| B | 2565 | 85 | 3.313840% |
| C | 2565 | 18 | 0.701754% |
| D | 2565 | 196 | 7.641326% |
Noise dominated data is calculated using 1-second bins in cleaned event files. If a bin has >2000 counts, and if more than 50% of those come from <1% of pixels, then it is considered to be noise-dominated and hence unusable.
| Quadrant | # 1 sec bins | Bins with >0 counts | Bins with >2000 counts | High rate bins dominated by noise | Noise dominated (total time) | Noise dominated (detector-on time) | Marked lightcurve |
|---|---|---|---|---|---|---|---|
| A | 2610 | 2566 | 17 | 17 | 0.65% | 0.66% | 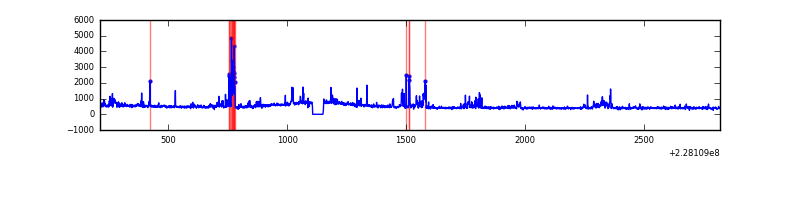 |
| B | 2610 | 2566 | 1 | 1 | 0.04% | 0.04% | 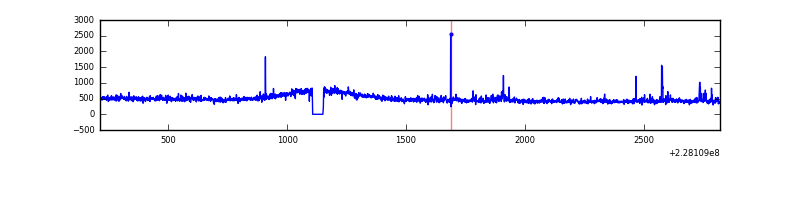 |
| C | 2610 | 2566 | 0 | 0 | 0.00% | 0.00% | 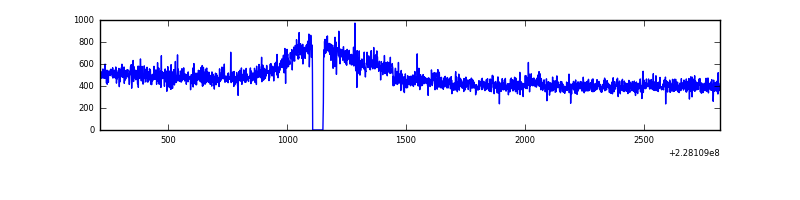 |
| D | 2610 | 2566 | 138 | 138 | 5.29% | 5.38% | 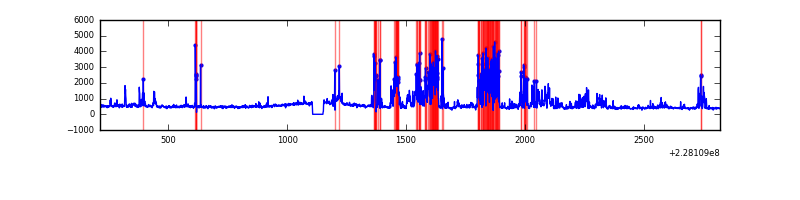 |
Top three noisy pixels from each quadrant. If the there are fewer than three noisy pixels in the level2.evt file, extra rows are filled as -1
| Pixel properties | Quadrant properties | ||||||
|---|---|---|---|---|---|---|---|
| Quadrant | DetID | PixID | Counts | Sigma | Mean | Median | Sigma |
| A | 4 | 2 | 218350 | 3447.5 | 300 | 291 | 63.3 |
| A | 13 | 251 | 7159 | 108.58 | 300 | 291 | 63.3 |
| A | 0 | 226 | 2791 | 39.52 | 300 | 291 | 63.3 |
| B | 4 | 81 | 48008 | 772.45 | 310 | 300 | 61.8 |
| B | 5 | 250 | 7970 | 124.19 | 310 | 300 | 61.8 |
| B | 12 | 111 | 7006 | 108.58 | 310 | 300 | 61.8 |
| C | 1 | 16 | 27279 | 373.06 | 303 | 303 | 72.3 |
| C | 8 | 128 | 4479 | 57.75 | 303 | 303 | 72.3 |
| C | 13 | 61 | 2451 | 29.71 | 303 | 303 | 72.3 |
| D | 1 | 52 | 480656 | 6648.53 | 284 | 274 | 72.3 |
| D | 4 | 95 | 198988 | 2750.22 | 284 | 274 | 72.3 |
| D | 2 | 14 | 81575 | 1125.21 | 284 | 274 | 72.3 |
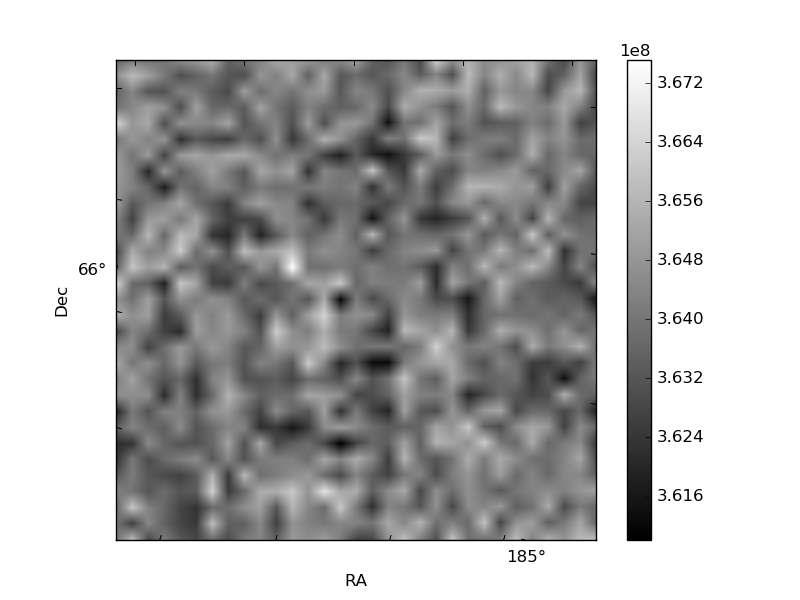
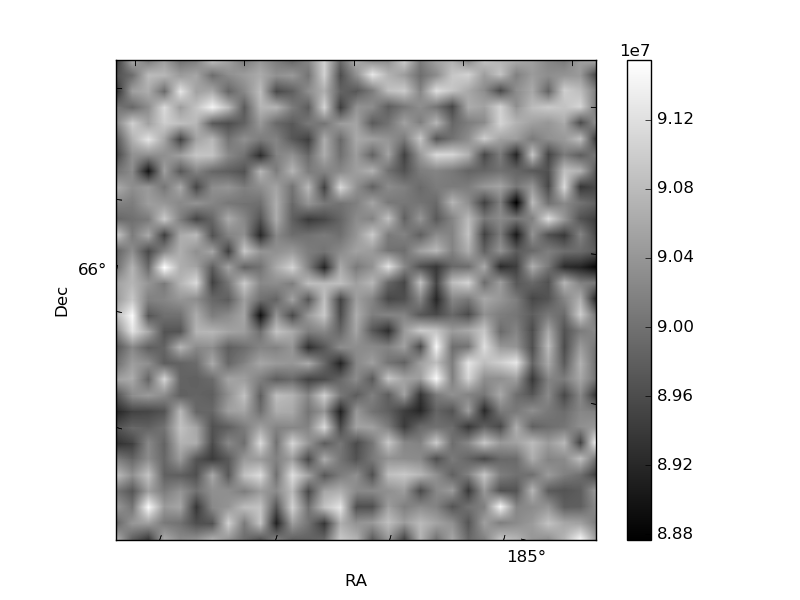
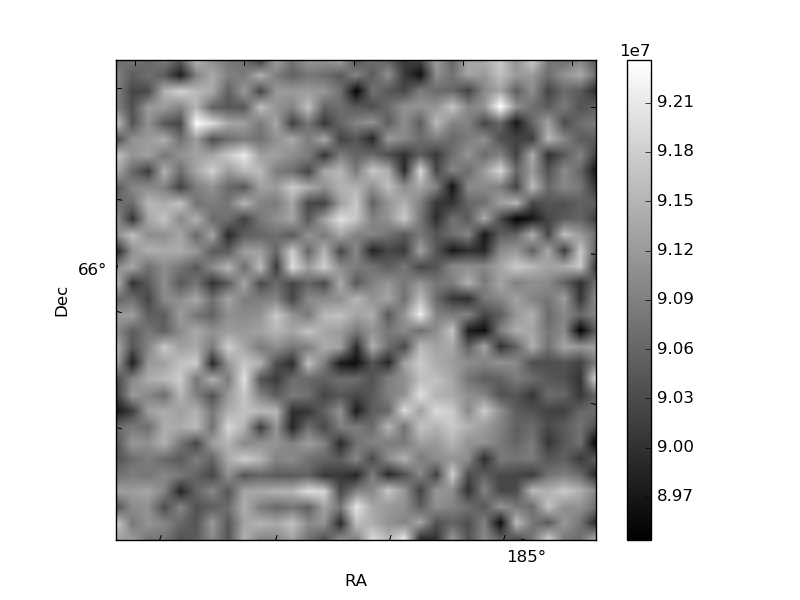
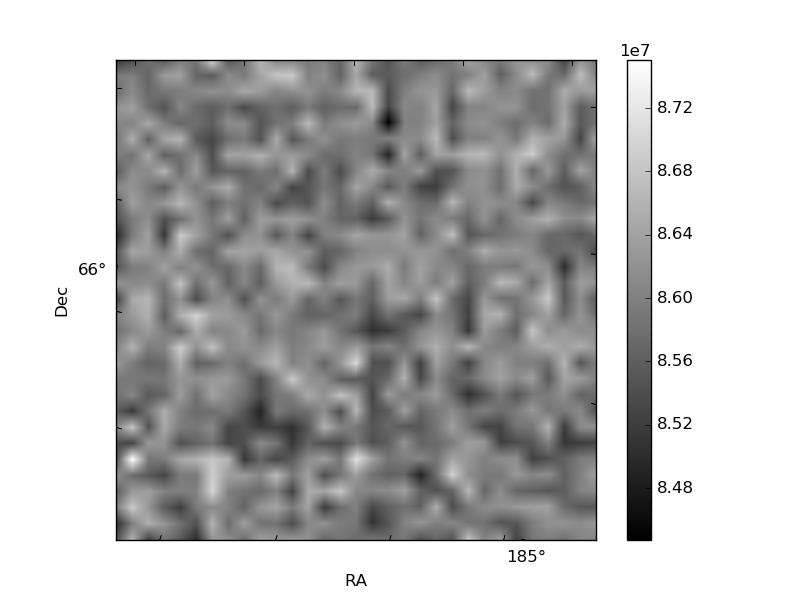
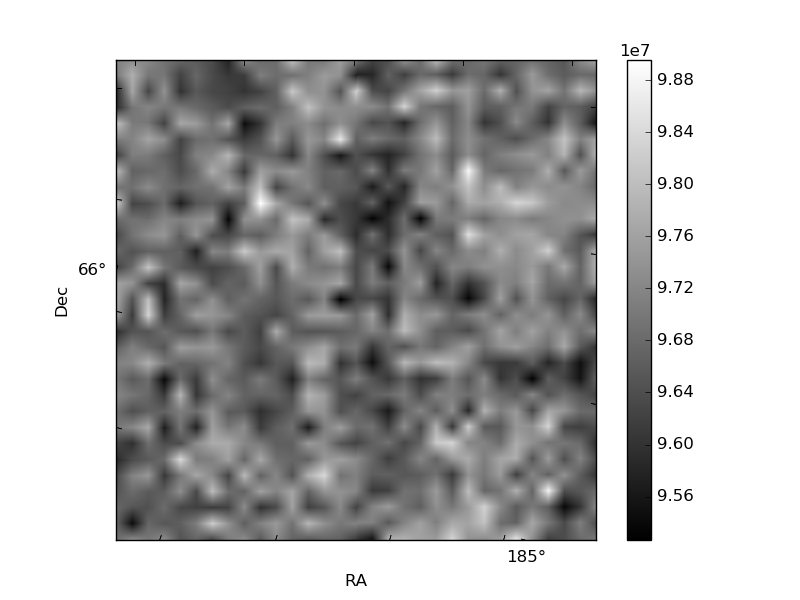
Histogram calculated using DETX and DETY for each event in the final _common_clean file
| Quadrant A | 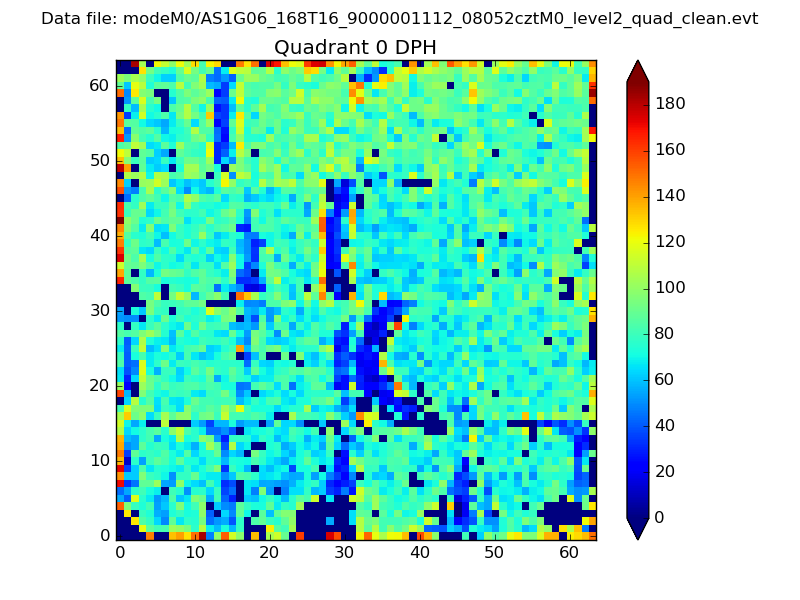 |
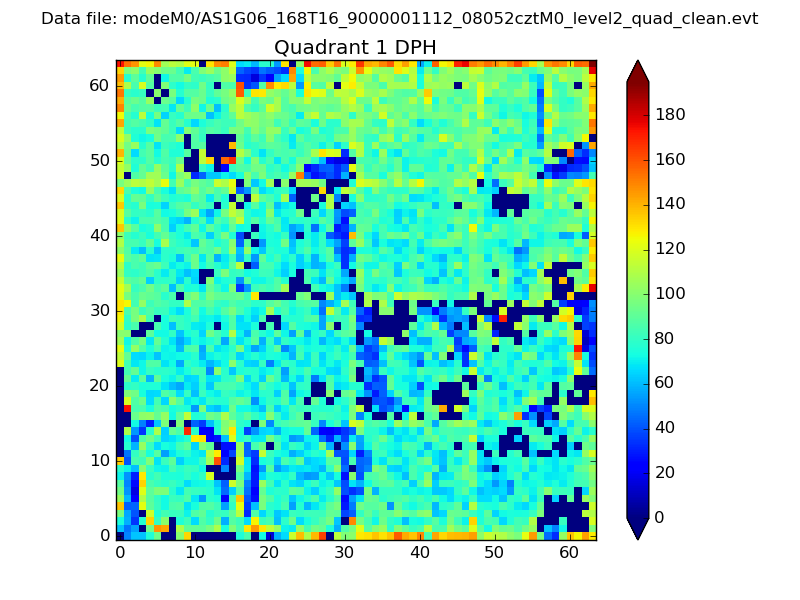 |
Quadrant B |
|---|---|---|---|
| Quadrant D | 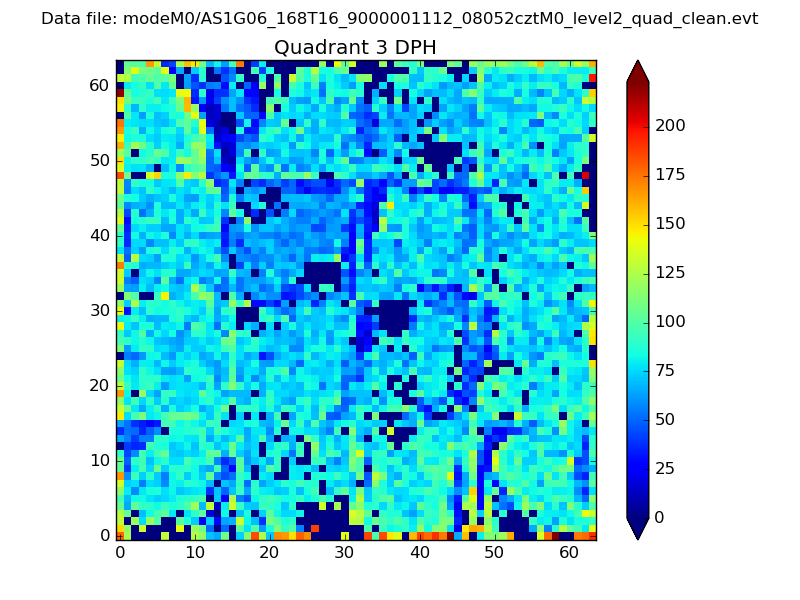 |
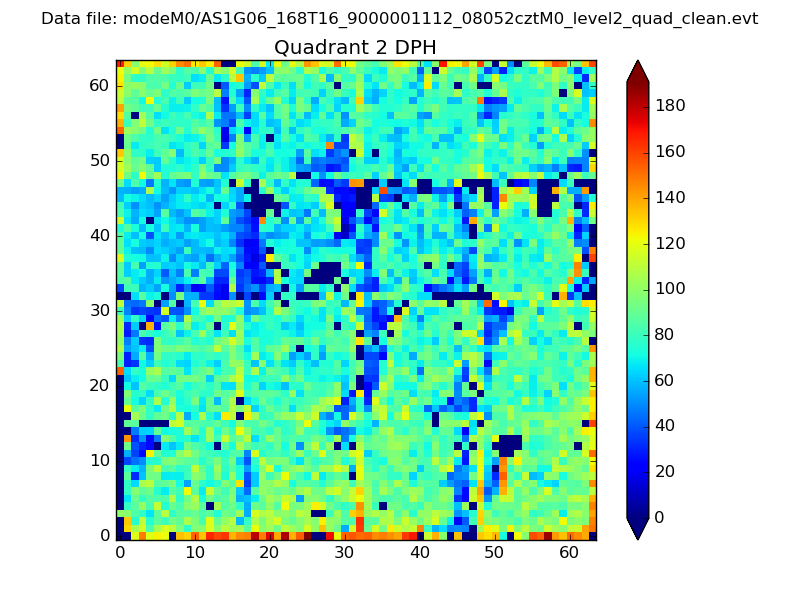 |
Quadrant C |
| Plot type | Count rate plots | Images |
|---|---|---|
| Comparison with Poisson distribution Blue bars denote a histogram of data divided into 1 sec bins. Red curve is a Poisson curve with rate = median count rate of data. |
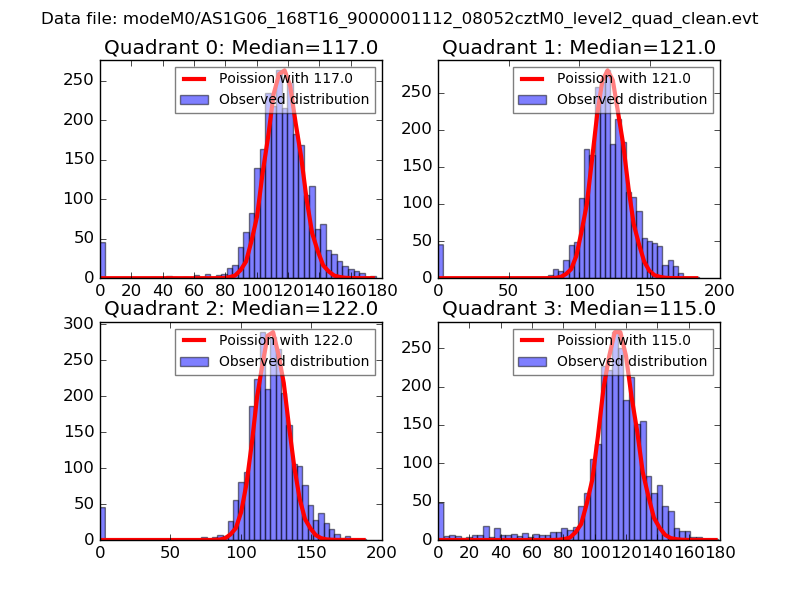 |
 |
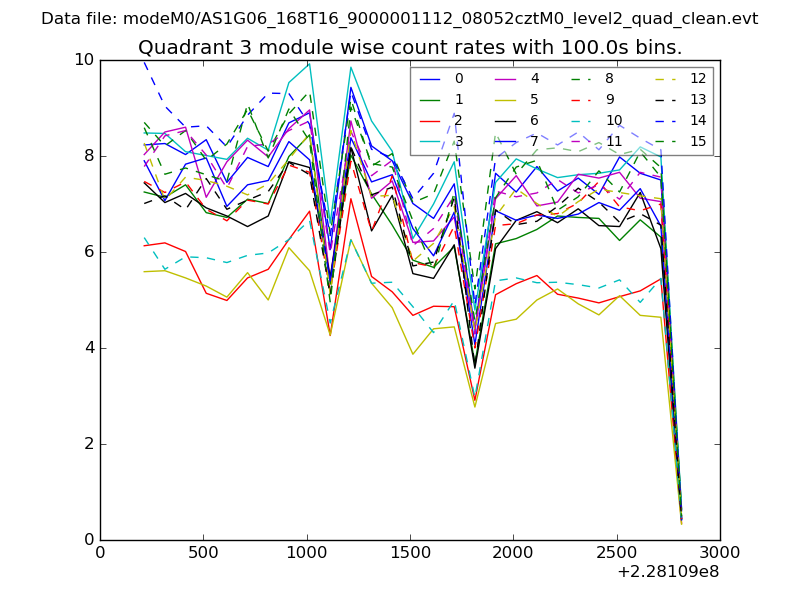
| Quadrant-wise count rates Data is divided into 100 sec bins |
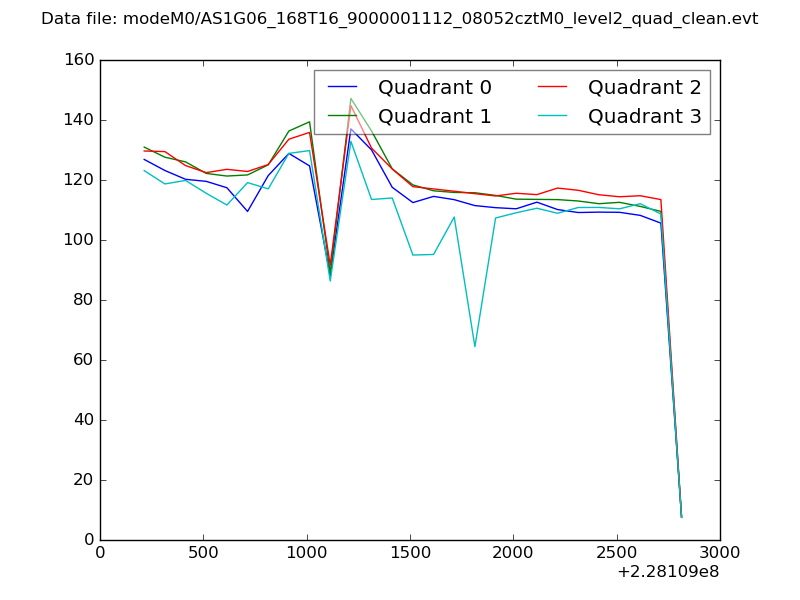 |
|
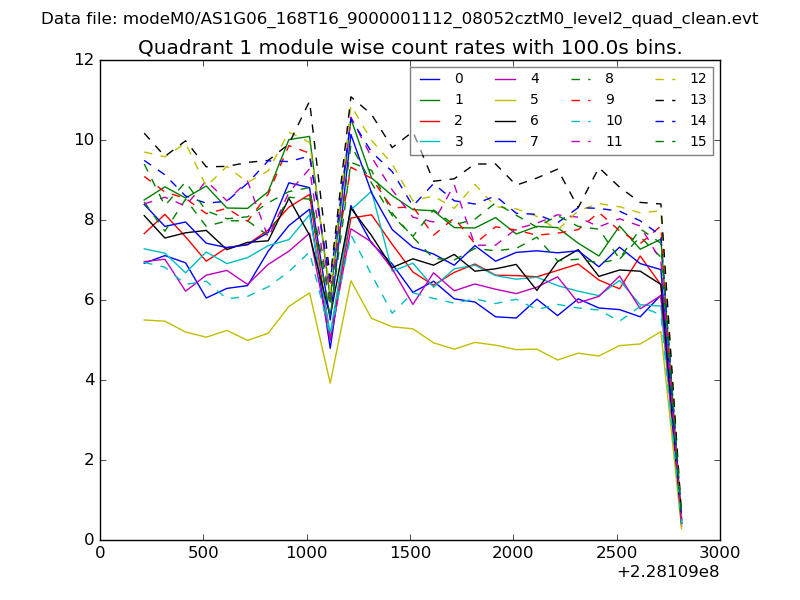
| Module-wise count rates for Quadrant A Data is divided into 100 sec bins |
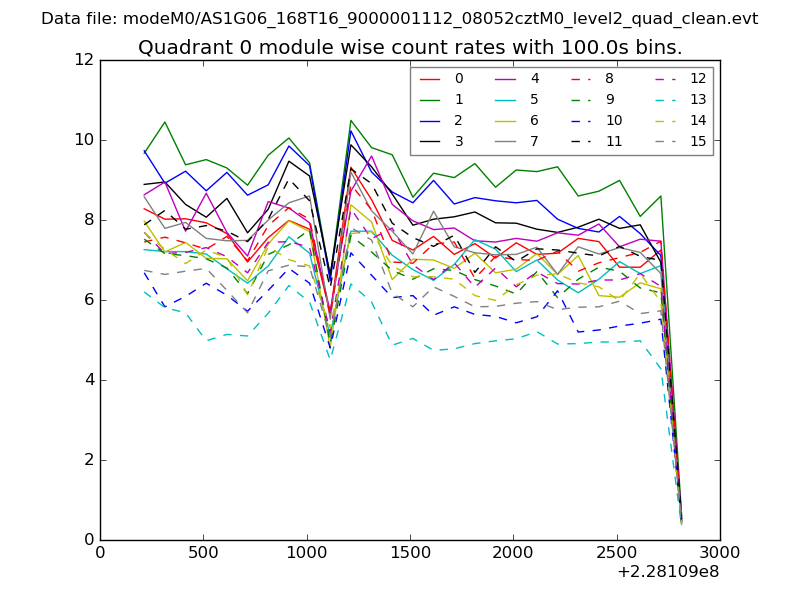 |
 |
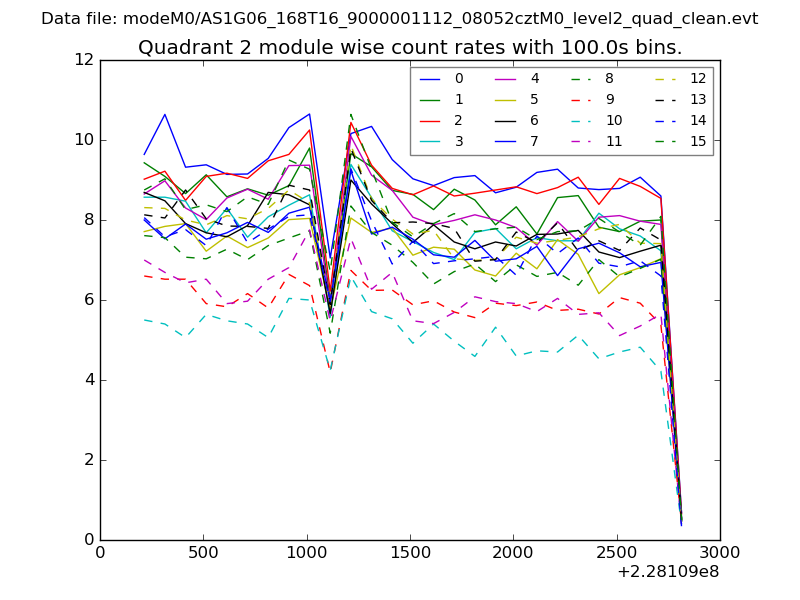
| Module-wise count rates for Quadrant B Data is divided into 100 sec bins |
 |
 |
| Module-wise count rates for Quadrant C Data is divided into 100 sec bins |
 |
 |
| Module-wise count rates for Quadrant D Data is divided into 100 sec bins |
 |
 |
| Parameter | Plot |
|---|---|
| CZT HV Monitor | 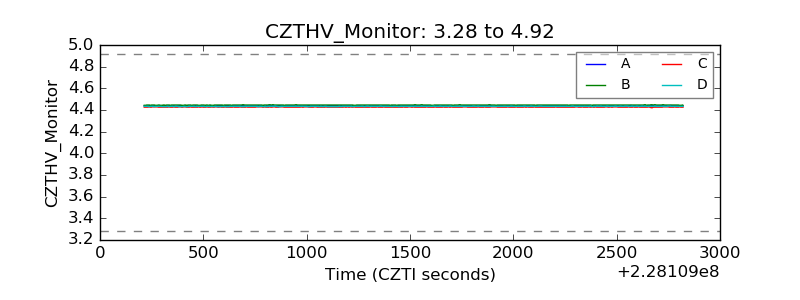 |
| D_VDD | 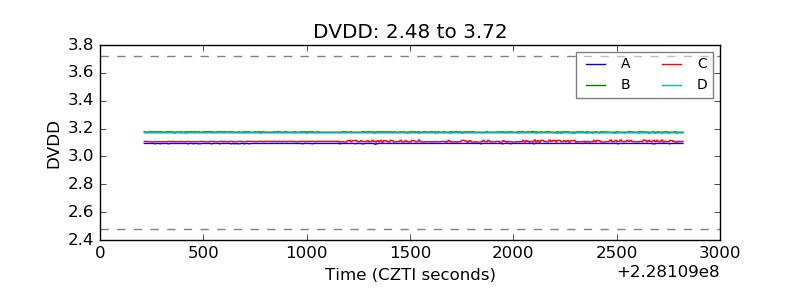 |
| Temperature 1 | 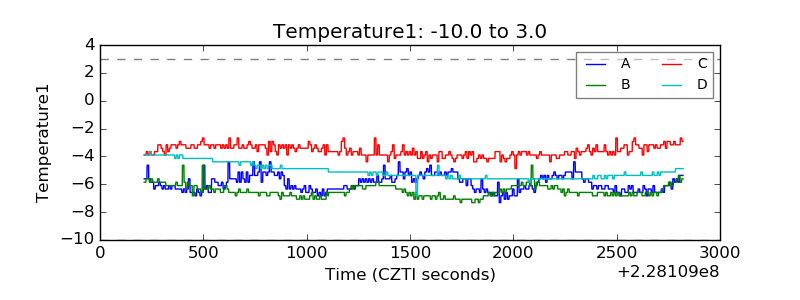 |
| Veto HV Monitor | 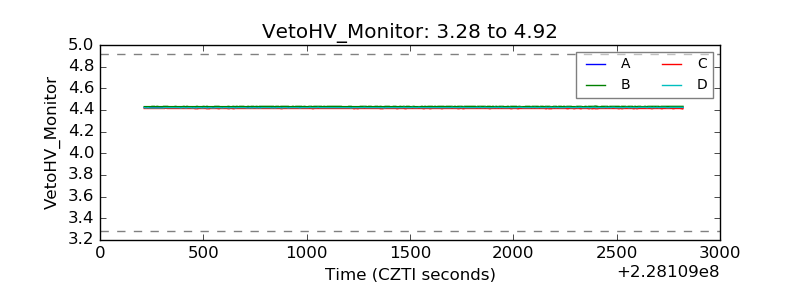 |
| Veto LLD | 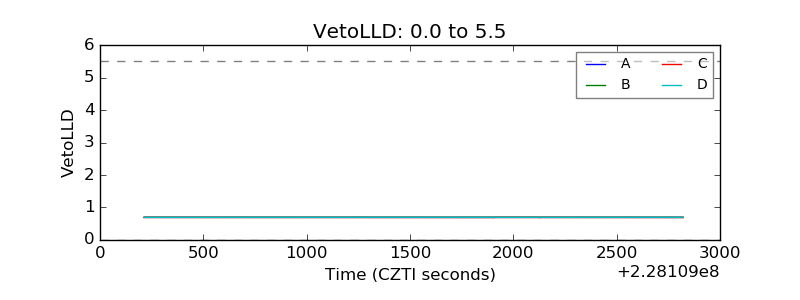 |
| Alpha Counter | 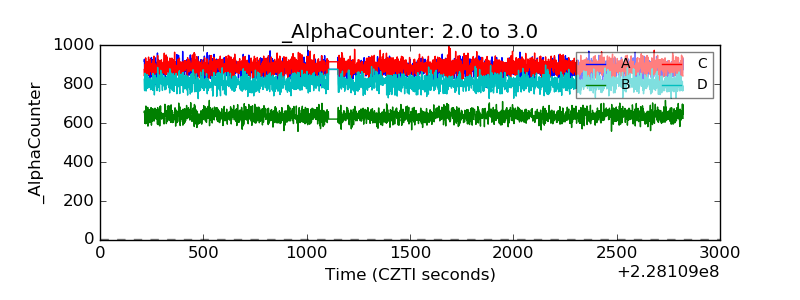 |
| _CPM_Rate | 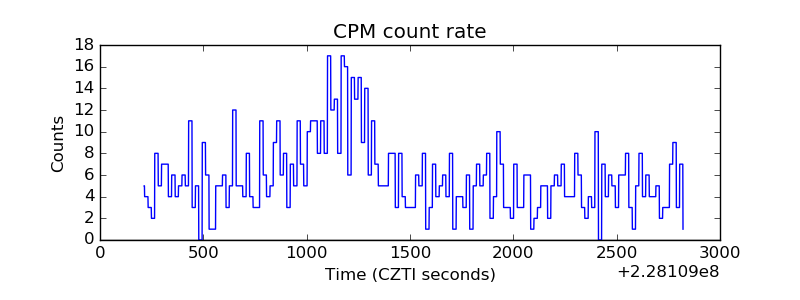 |
| CZT Counter | 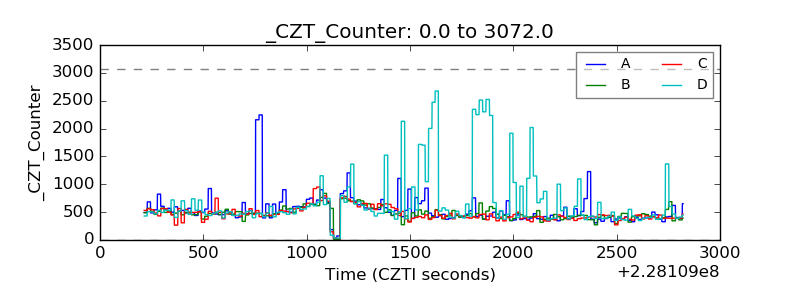 |
| +2.5 Volts monitor |  |
| +5 Volts monitor |  |
| _ROLL_ROT | 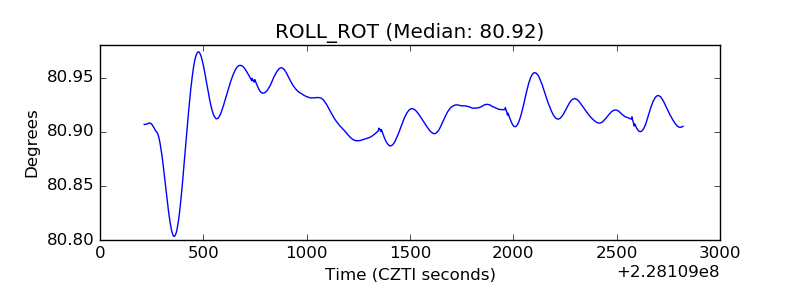 |
| _Roll_DEC |  |
| _Roll_RA | 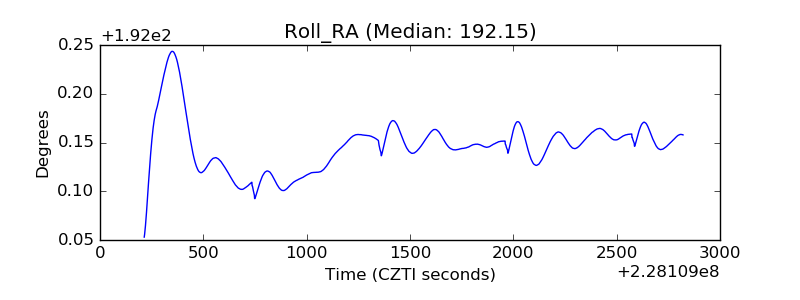 |
| Veto Counter | 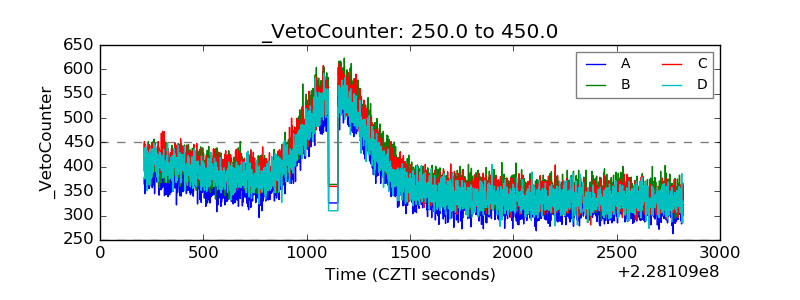 |