| Param | Original file | Final file |
|---|---|---|
| Filename | modeM0/AS1G06_168T16_9000001112_08053cztM0_level2.evt | modeM0/AS1G06_168T16_9000001112_08053cztM0_level2_quad_clean.evt |
| Size (bytes) | 426,329,280 | 70,799,040 |
| Size | 406.6 MB | 67.5 MB |
| Events in quadrant A | 2,692,548 | 445,920 |
| Events in quadrant B | 2,855,164 | 452,399 |
| Events in quadrant C | 2,462,371 | 452,288 |
| Events in quadrant D | 4,524,987 | 405,826 |
| Mode SS | |||
|---|---|---|---|
| Quadrant | BADHDUFLAG | Total packets | Discarded packets |
| A | 0 | 110 | 0 |
| B | 0 | 110 | 0 |
| C | 0 | 110 | 0 |
| D | 0 | 110 | 0 |
| Mode M0 | |||
|---|---|---|---|
| Quadrant | BADHDUFLAG | Total packets | Discarded packets |
| A | 0 | 11870 | 0 |
| B | 0 | 12289 | 0 |
| C | 0 | 11213 | 6 |
| D | 0 | 17375 | 0 |
| Quadrant | Total seconds | Saturated seconds | Saturation percentage |
|---|---|---|---|
| A | 5536 | 11 | 0.198699% |
| B | 5536 | 96 | 1.734104% |
| C | 5533 | 5 | 0.090367% |
| D | 5536 | 643 | 11.614884% |
Noise dominated data is calculated using 1-second bins in cleaned event files. If a bin has >2000 counts, and if more than 50% of those come from <1% of pixels, then it is considered to be noise-dominated and hence unusable.
| Quadrant | # 1 sec bins | Bins with >0 counts | Bins with >2000 counts | High rate bins dominated by noise | Noise dominated (total time) | Noise dominated (detector-on time) | Marked lightcurve |
|---|---|---|---|---|---|---|---|
| A | 5536 | 5536 | 4 | 4 | 0.07% | 0.07% | 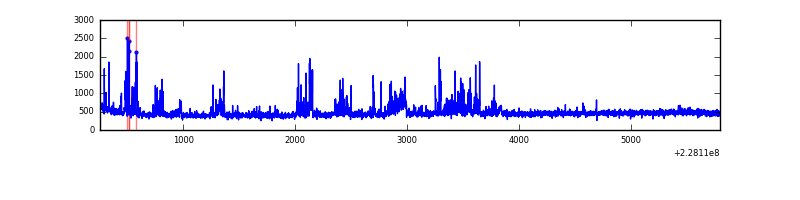 |
| B | 5536 | 5536 | 61 | 61 | 1.10% | 1.10% | 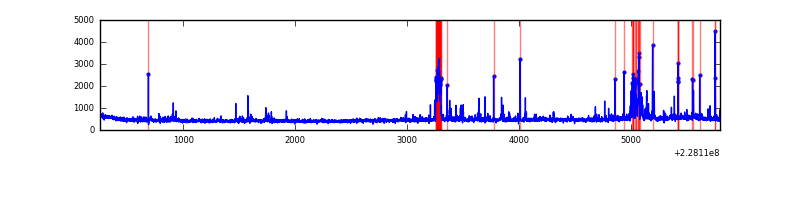 |
| C | 5536 | 5536 | 0 | 0 | 0.00% | 0.00% | 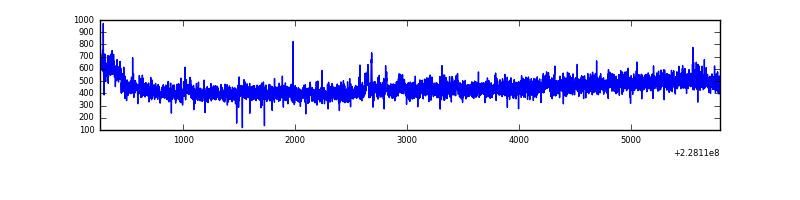 |
| D | 5536 | 5536 | 513 | 513 | 9.27% | 9.27% | 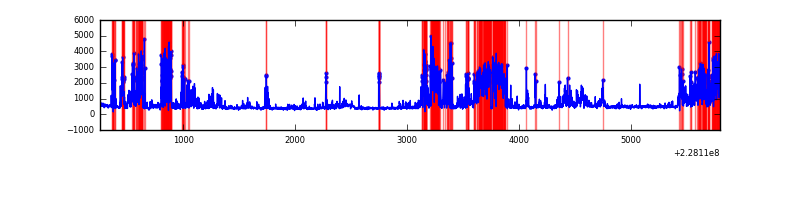 |
Top three noisy pixels from each quadrant. If the there are fewer than three noisy pixels in the level2.evt file, extra rows are filled as -1
| Pixel properties | Quadrant properties | ||||||
|---|---|---|---|---|---|---|---|
| Quadrant | DetID | PixID | Counts | Sigma | Mean | Median | Sigma |
| A | 4 | 2 | 307445 | 2452.5 | 616 | 602 | 125.1 |
| A | 15 | 234 | 6562 | 47.64 | 616 | 602 | 125.1 |
| A | 0 | 226 | 5703 | 40.77 | 616 | 602 | 125.1 |
| B | 4 | 239 | 219303 | 1840.96 | 619 | 602 | 118.8 |
| B | 11 | 51 | 79507 | 664.2 | 619 | 602 | 118.8 |
| B | 10 | 16 | 49107 | 408.3 | 619 | 602 | 118.8 |
| C | 1 | 16 | 70929 | 501.37 | 606 | 609 | 140.3 |
| C | 8 | 128 | 12278 | 83.2 | 606 | 609 | 140.3 |
| C | 8 | 112 | 6354 | 40.96 | 606 | 609 | 140.3 |
| D | 1 | 52 | 1464340 | 10334.51 | 569 | 553 | 141.6 |
| D | 4 | 95 | 622669 | 4392.21 | 569 | 553 | 141.6 |
| D | 1 | 83 | 176658 | 1243.32 | 569 | 553 | 141.6 |
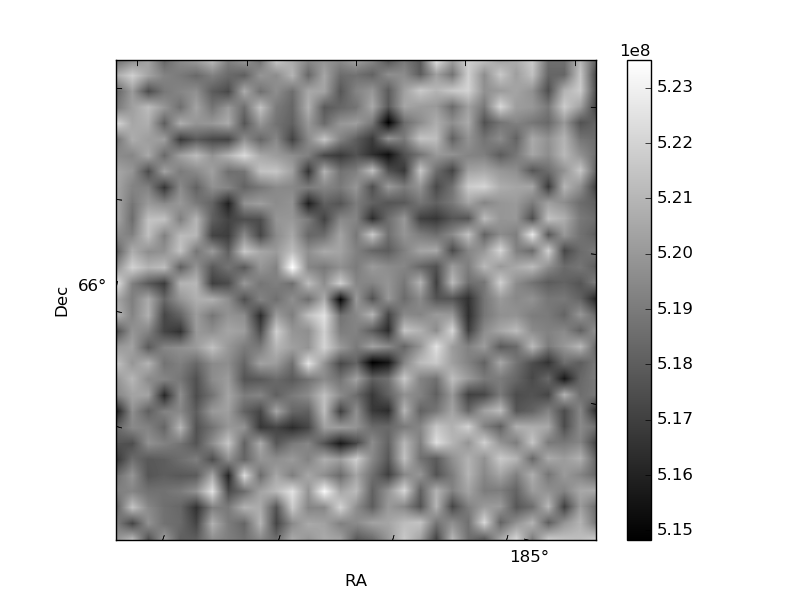
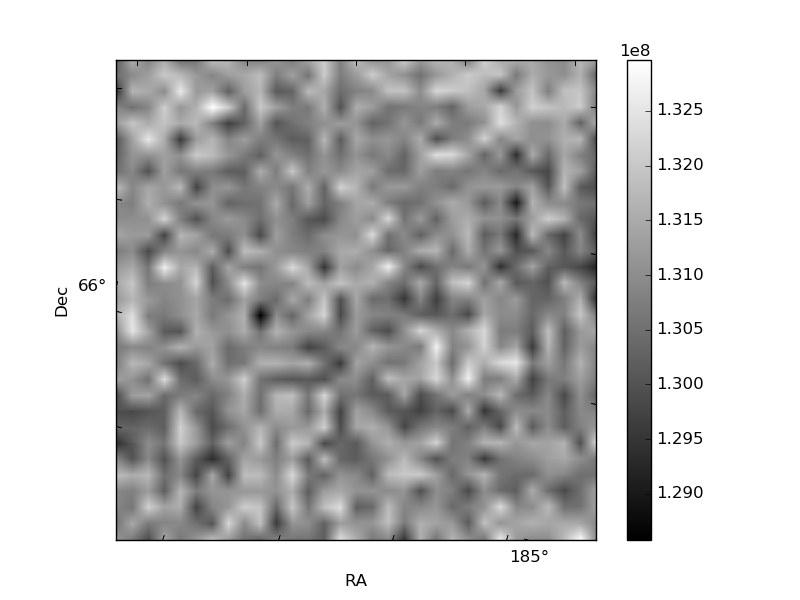
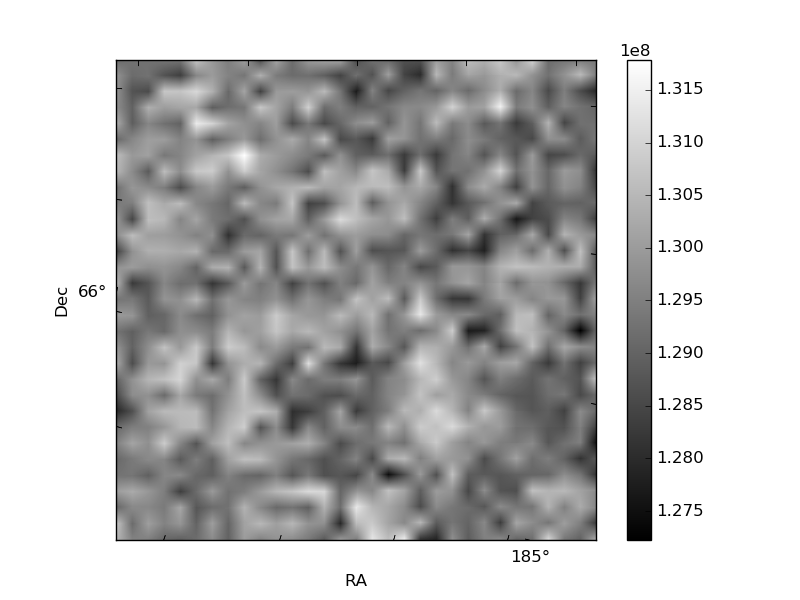
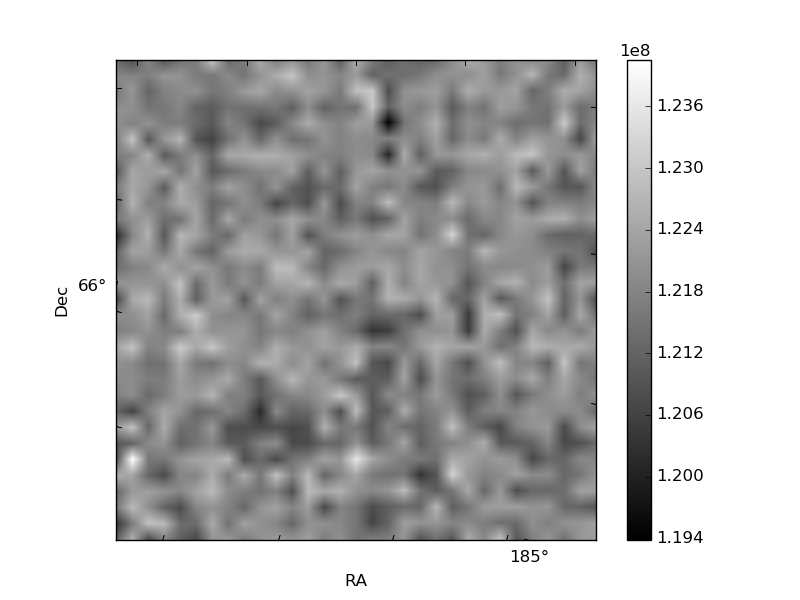
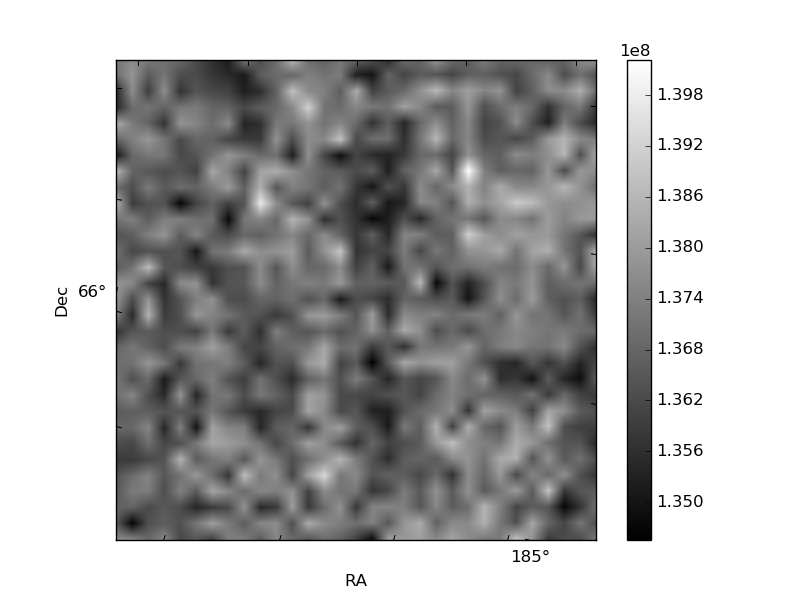
Histogram calculated using DETX and DETY for each event in the final _common_clean file
| Quadrant A | 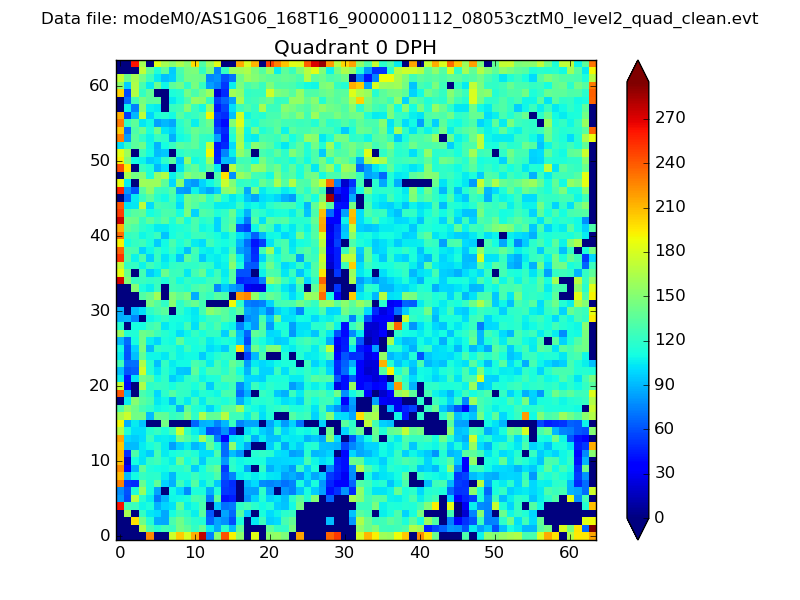 |
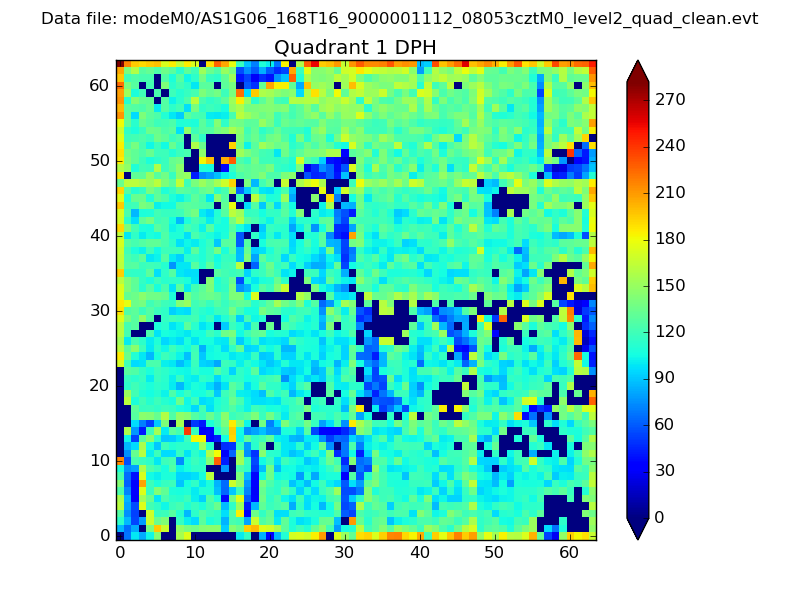 |
Quadrant B |
|---|---|---|---|
| Quadrant D |  |
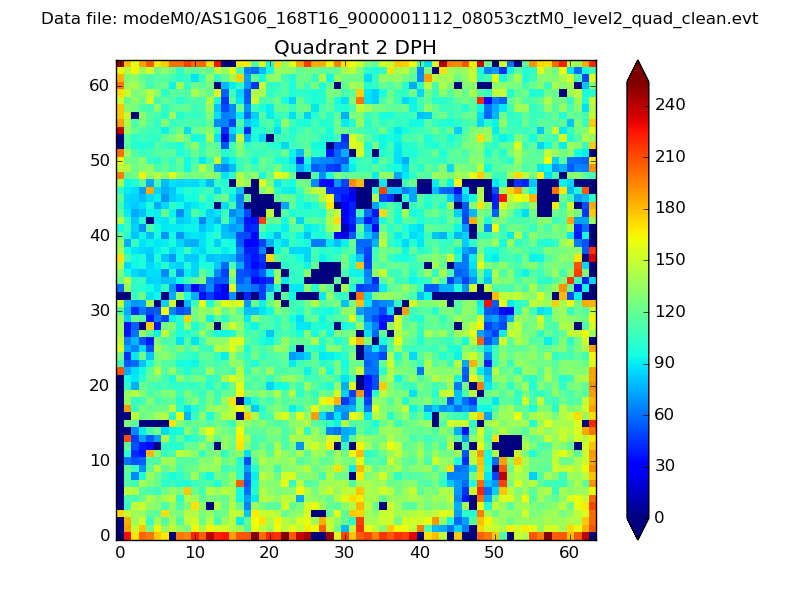 |
Quadrant C |
| Plot type | Count rate plots | Images |
|---|---|---|
| Comparison with Poisson distribution Blue bars denote a histogram of data divided into 1 sec bins. Red curve is a Poisson curve with rate = median count rate of data. |
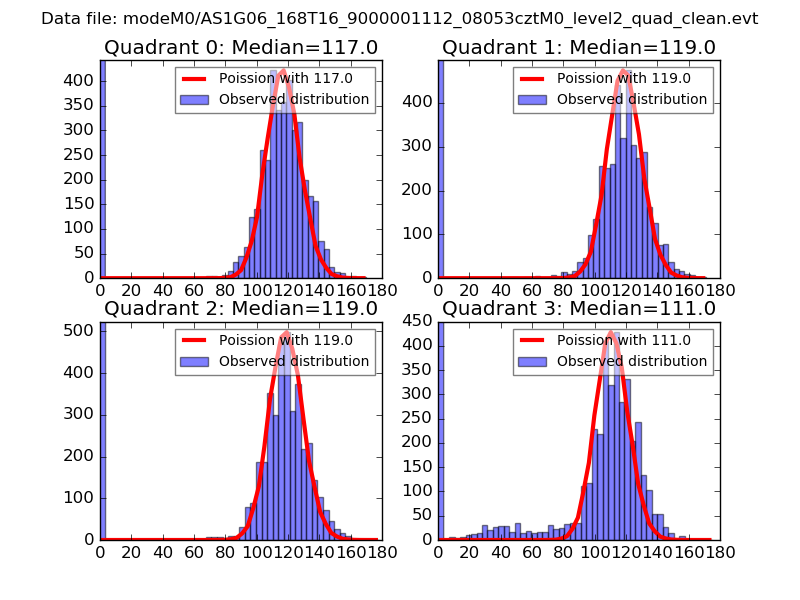 |
 |
| Quadrant-wise count rates Data is divided into 100 sec bins |
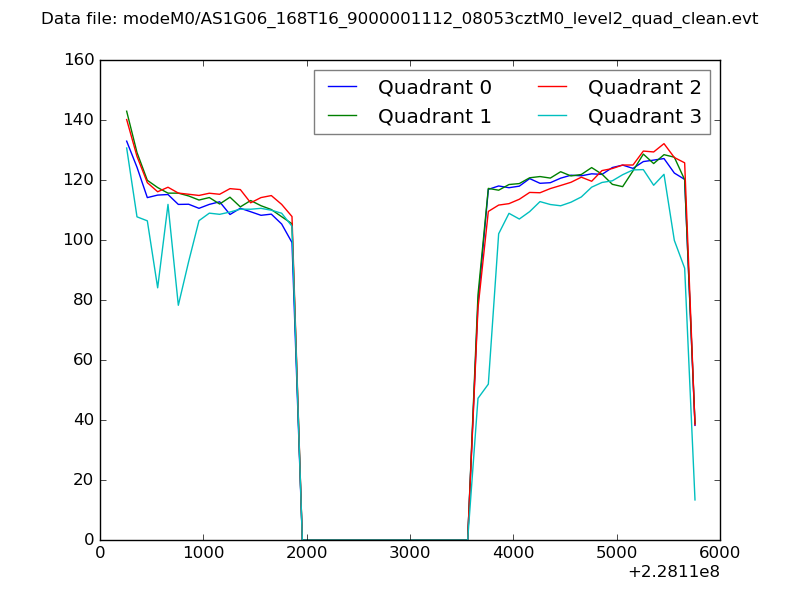 |
|
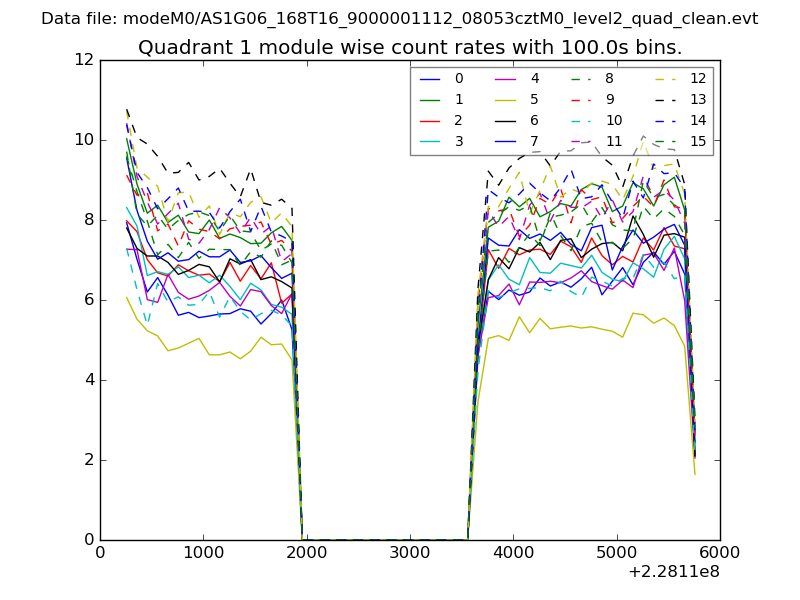
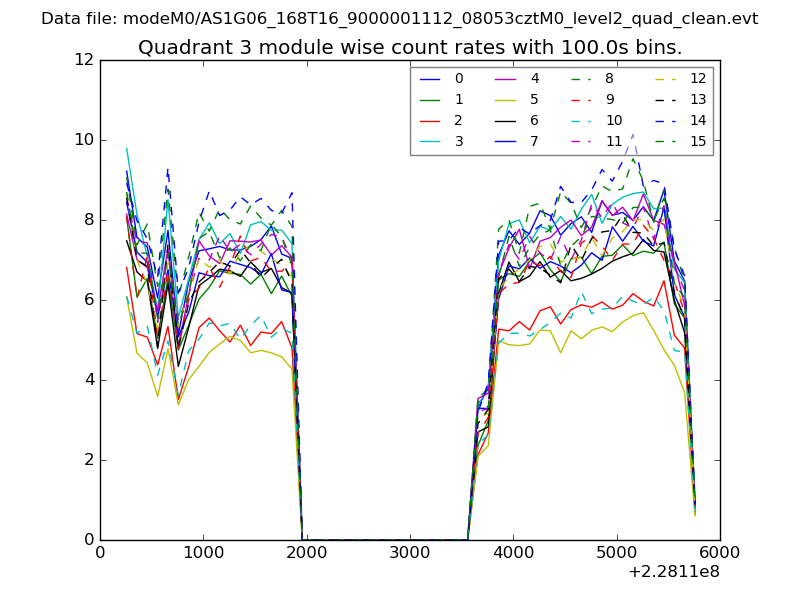
| Module-wise count rates for Quadrant A Data is divided into 100 sec bins |
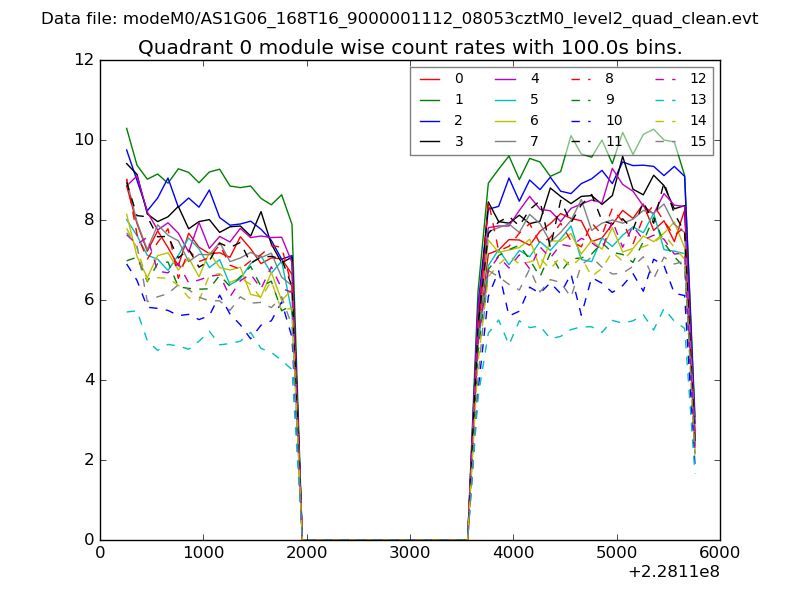 |
 |
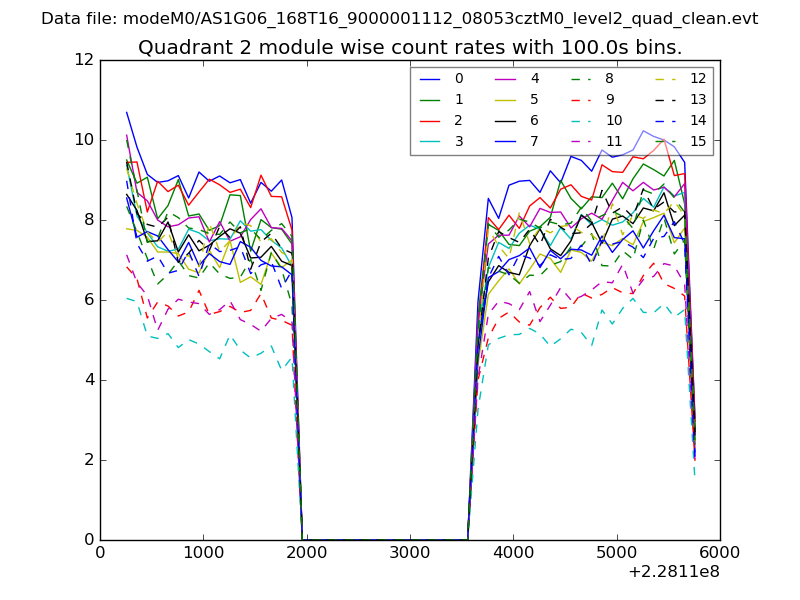
| Module-wise count rates for Quadrant B Data is divided into 100 sec bins |
 |
 |
| Module-wise count rates for Quadrant C Data is divided into 100 sec bins |
 |
 |
| Module-wise count rates for Quadrant D Data is divided into 100 sec bins |
 |
 |
| Parameter | Plot |
|---|---|
| CZT HV Monitor | 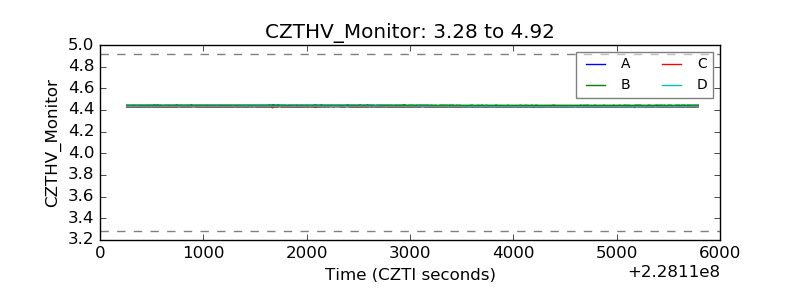 |
| D_VDD |  |
| Temperature 1 | 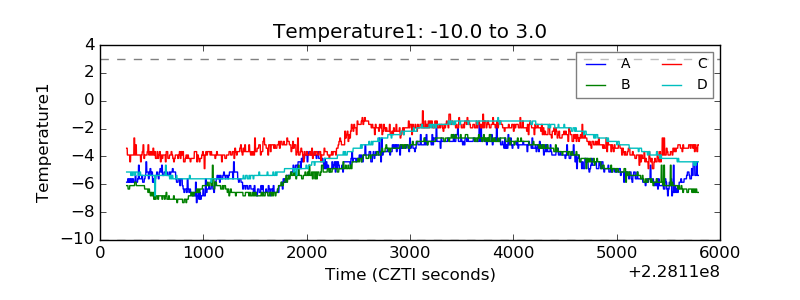 |
| Veto HV Monitor | 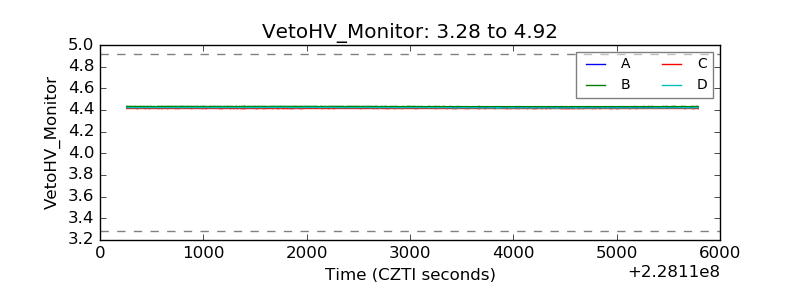 |
| Veto LLD | 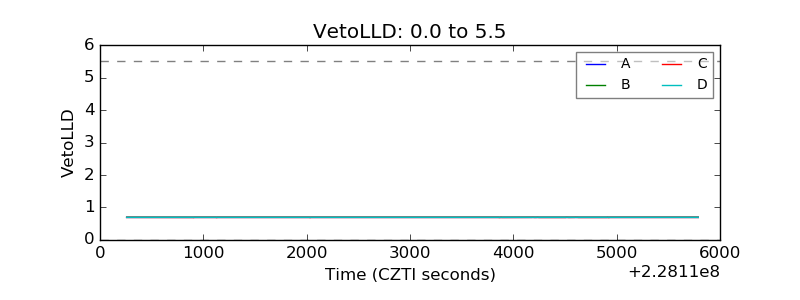 |
| Alpha Counter | 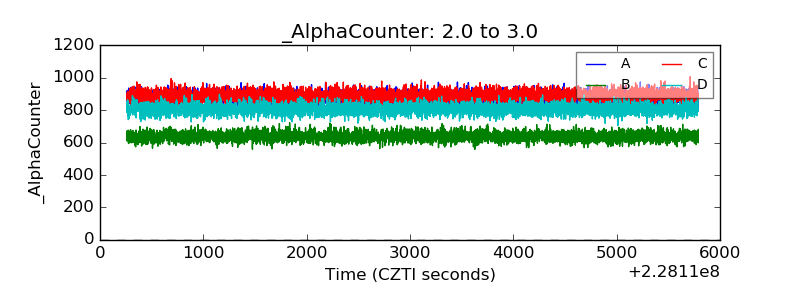 |
| _CPM_Rate | 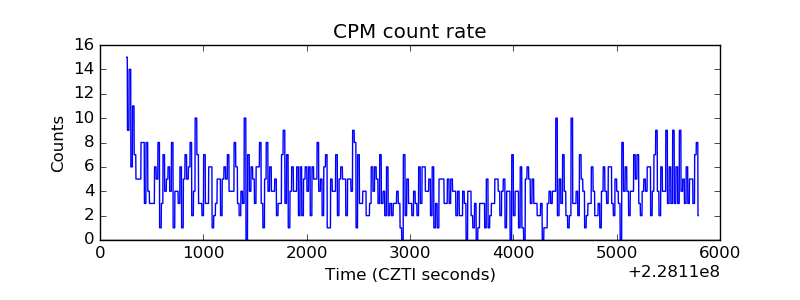 |
| CZT Counter | 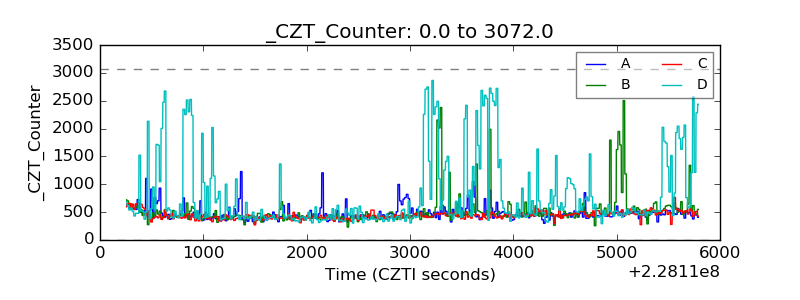 |
| +2.5 Volts monitor |  |
| +5 Volts monitor |  |
| _ROLL_ROT | 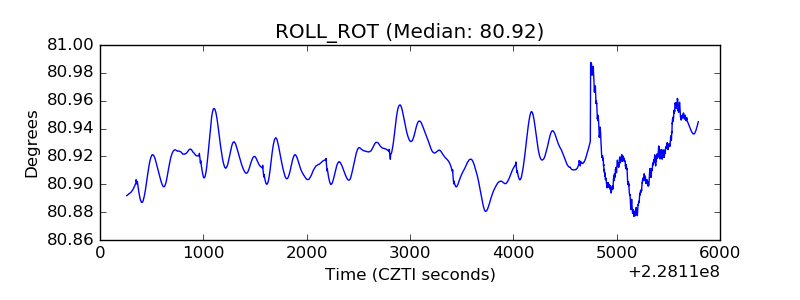 |
| _Roll_DEC | 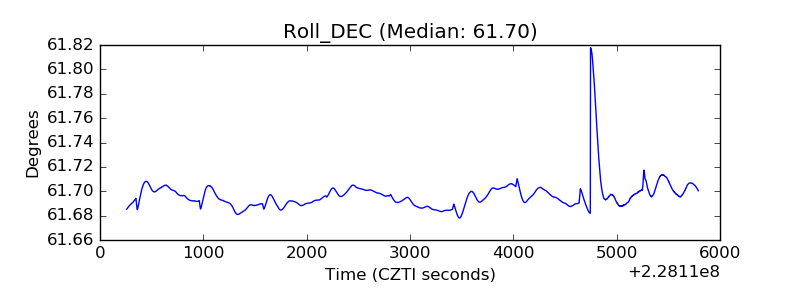 |
| _Roll_RA | 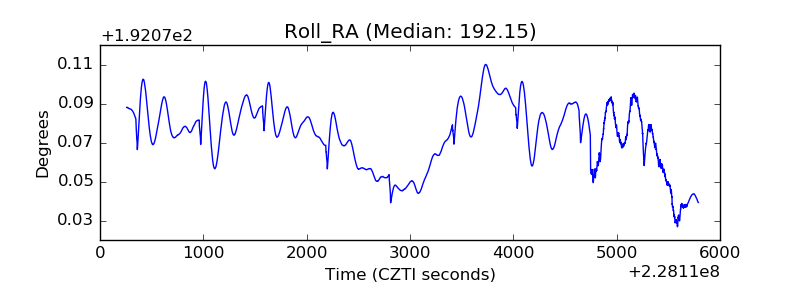 |
| Veto Counter | 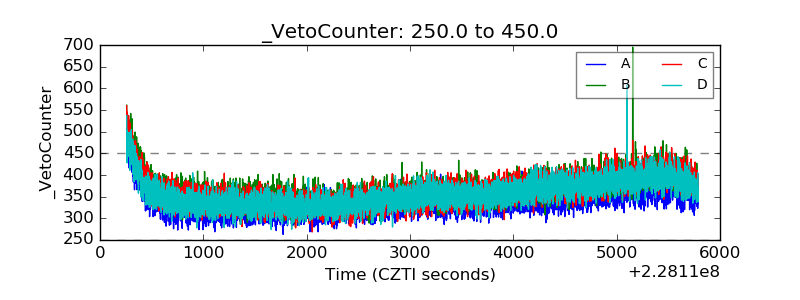 |