| Param | Original file | Final file |
|---|---|---|
| Filename | modeM0/AS1G06_033T01_9000001116cztM0_level2.fits | modeM0/AS1G06_033T01_9000001116cztM0_level2_quad_clean.evt |
| Size (bytes) | 614,877,120 | 594,518,400 |
| Size | 586.4 MB | 567.0 MB |
| Events in quadrant A | 3,733,258 | 3,538,242 |
| Events in quadrant B | 3,598,942 | 3,532,827 |
| Events in quadrant C | 3,741,627 | 3,460,002 |
| Events in quadrant D | 3,225,332 | 3,152,008 |
| Mode M9 | |||
|---|---|---|---|
| Quadrant | BADHDUFLAG | Total packets | Discarded packets |
| A | 0 | 130 | 0 |
| B | 0 | 120 | 0 |
| C | 0 | 120 | 0 |
| D | 0 | 130 | 0 |
| Mode SS | |||
|---|---|---|---|
| Quadrant | BADHDUFLAG | Total packets | Discarded packets |
| A | 0 | 1282 | 0 |
| B | 0 | 1276 | 0 |
| C | 0 | 1286 | 0 |
| D | 0 | 1282 | 0 |
| Mode M0 | |||
|---|---|---|---|
| Quadrant | BADHDUFLAG | Total packets | Discarded packets |
| A | 0 | 137668 | 0 |
| B | 0 | 135037 | 0 |
| C | 0 | 130851 | 0 |
| D | 0 | 145783 | 0 |
| Quadrant | Total seconds | Saturated seconds | Saturation percentage |
|---|---|---|---|
| A | 63021 | 914 | 1.450310% |
| B | 63017 | 1010 | 1.602742% |
| C | 63010 | 539 | 0.855420% |
| D | 63046 | 1145 | 1.816134% |
Noise dominated data is calculated using 1-second bins in cleaned event files. If a bin has >2000 counts, and if more than 50% of those come from <1% of pixels, then it is considered to be noise-dominated and hence unusable.
| Quadrant | # 1 sec bins | Bins with >0 counts | Bins with >2000 counts | High rate bins dominated by noise | Noise dominated (total time) | Noise dominated (detector-on time) | Marked lightcurve |
|---|---|---|---|---|---|---|---|
| A | 93049 | 63186 | 0 | 0 | 0.00% | 0.00% |  |
| B | 93049 | 63183 | 0 | 0 | 0.00% | 0.00% | 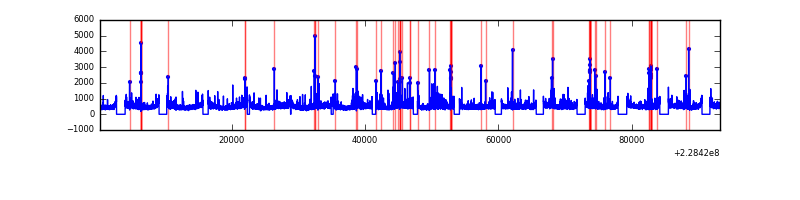 |
| C | 93049 | 63178 | 0 | 0 | 0.00% | 0.00% |  |
| D | 93049 | 63211 | 0 | 0 | 0.00% | 0.00% |  |
Top three noisy pixels from each quadrant. If the there are fewer than three noisy pixels in the level2.evt file, extra rows are filled as -1
| Pixel properties | Quadrant properties | ||||||
|---|---|---|---|---|---|---|---|
| Quadrant | DetID | PixID | Counts | Sigma | Mean | Median | Sigma |
| A | 0 | 29 | 3552 | 10.92 | 968 | 904 | 242.5 |
| A | 7 | 110 | 3018 | 8.72 | 968 | 904 | 242.5 |
| A | 9 | 19 | 2804 | 7.84 | 968 | 904 | 242.5 |
| B | 2 | 9 | 3157 | 11.81 | 949 | 903 | 190.9 |
| B | 2 | 8 | 2416 | 7.93 | 949 | 903 | 190.9 |
| B | 5 | 128 | 2405 | 7.87 | 949 | 903 | 190.9 |
| C | 1 | 80 | 2699 | 6.85 | 987 | 916 | 260.1 |
| C | 1 | 81 | 2660 | 6.7 | 987 | 916 | 260.1 |
| C | 12 | 241 | 2496 | 6.07 | 987 | 916 | 260.1 |
| D | 6 | 231 | 2357 | 6.19 | 920 | 837 | 245.7 |
| D | 11 | 82 | 2305 | 5.98 | 920 | 837 | 245.7 |
| D | 7 | 5 | 2285 | 5.89 | 920 | 837 | 245.7 |
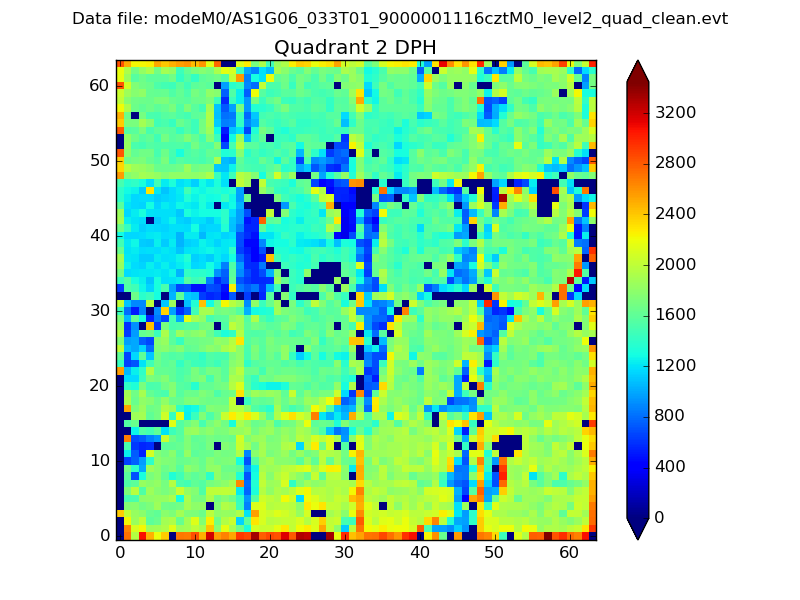
Histogram calculated using DETX and DETY for each event in the final _common_clean file
| Quadrant A | 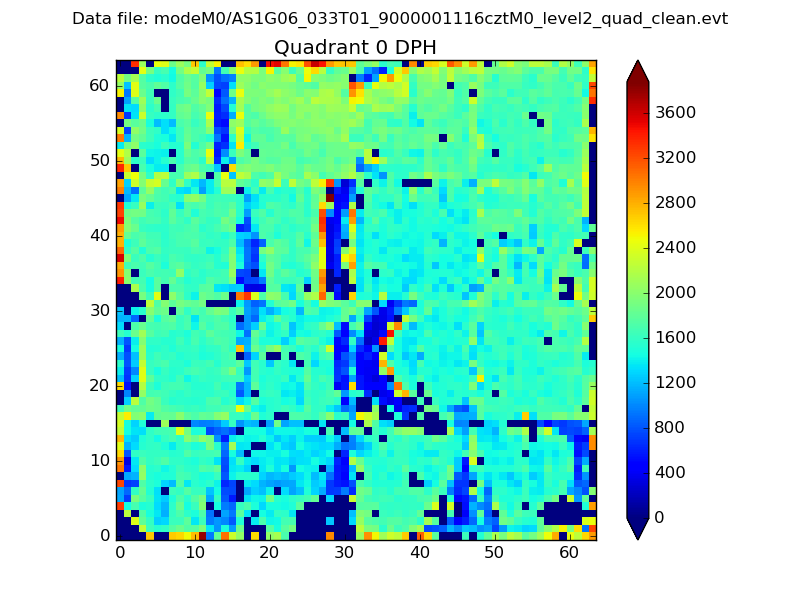 |
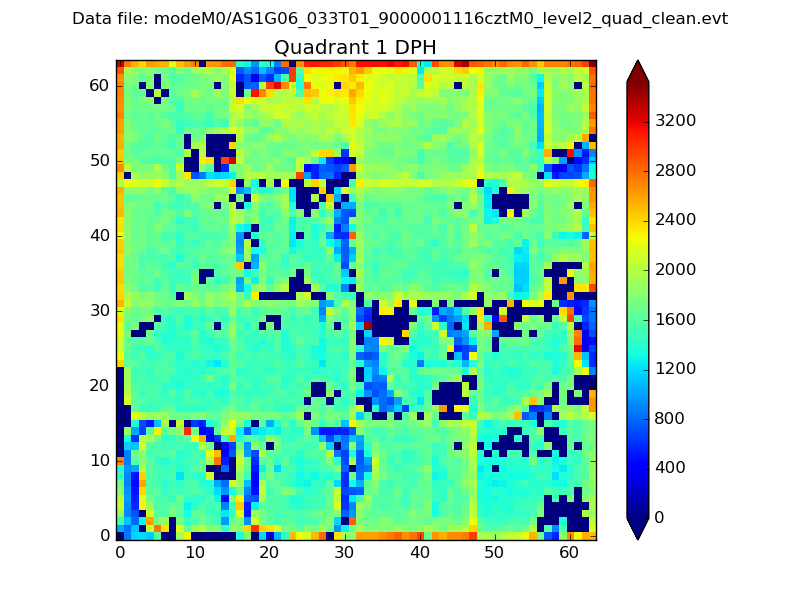 |
Quadrant B |
|---|---|---|---|
| Quadrant D | 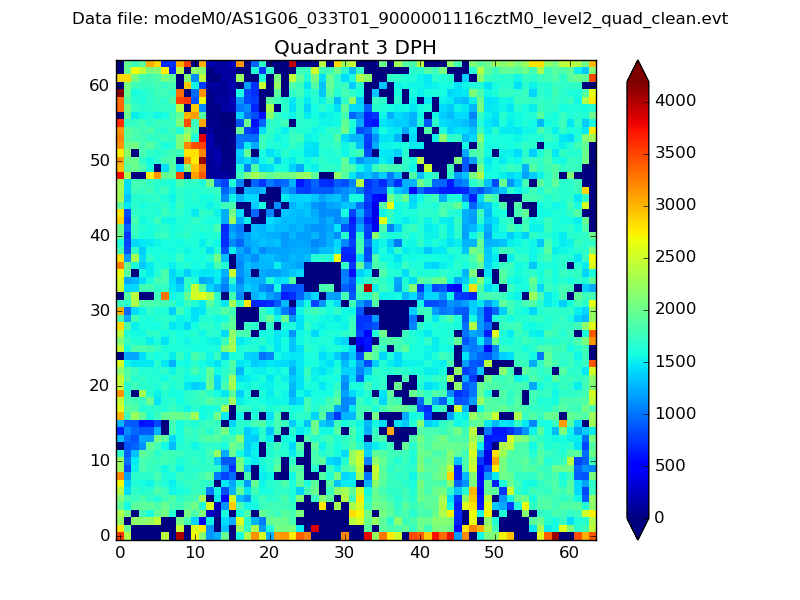 |
 |
Quadrant C |
| Plot type | Count rate plots | Images |
|---|---|---|
| Comparison with Poisson distribution Blue bars denote a histogram of data divided into 1 sec bins. Red curve is a Poisson curve with rate = median count rate of data. |
 |
 |
| Quadrant-wise count rates Data is divided into 100 sec bins |
 |
|
| Module-wise count rates for Quadrant A Data is divided into 100 sec bins |
 |
 |
| Module-wise count rates for Quadrant B Data is divided into 100 sec bins |
 |
 |
| Module-wise count rates for Quadrant C Data is divided into 100 sec bins |
 |
 |
| Module-wise count rates for Quadrant D Data is divided into 100 sec bins |
 |
 |
| Parameter | Plot |
|---|---|
| CZT HV Monitor |  |
| D_VDD | 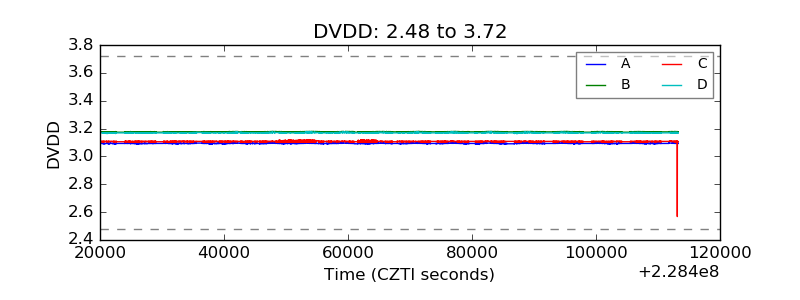 |
| Temperature 1 |  |
| Veto HV Monitor |  |
| Veto LLD |  |
| Alpha Counter |  |
| _CPM_Rate |  |
| CZT Counter |  |
| +2.5 Volts monitor | 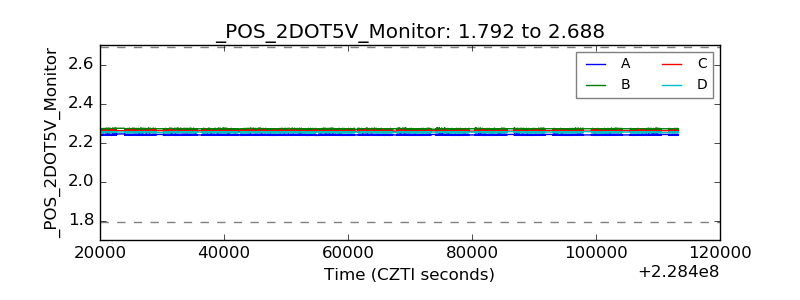 |
| +5 Volts monitor |  |
| _ROLL_ROT |  |
| _Roll_DEC | 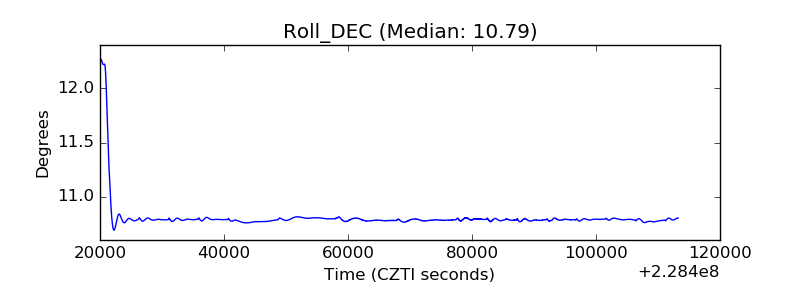 |
| _Roll_RA |  |
| Veto Counter |  |