| Param | Original file | Final file |
|---|---|---|
| Filename | modeM0/AS1G06_033T01_9000001116_08106cztM0_level2.evt | modeM0/AS1G06_033T01_9000001116_08106cztM0_level2_quad_clean.evt |
| Size (bytes) | 279,812,160 | 51,163,200 |
| Size | 266.8 MB | 48.8 MB |
| Events in quadrant A | 2,278,856 | 317,673 |
| Events in quadrant B | 1,947,851 | 323,283 |
| Events in quadrant C | 1,924,943 | 327,262 |
| Events in quadrant D | 2,064,344 | 313,687 |
| Mode M9 | |||
|---|---|---|---|
| Quadrant | BADHDUFLAG | Total packets | Discarded packets |
| A | 0 | 13 | 0 |
| B | 0 | 13 | 0 |
| C | 0 | 13 | 0 |
| D | 0 | 13 | 0 |
| Mode SS | |||
|---|---|---|---|
| Quadrant | BADHDUFLAG | Total packets | Discarded packets |
| A | 0 | 76 | 0 |
| B | 0 | 76 | 0 |
| C | 0 | 76 | 0 |
| D | 0 | 76 | 0 |
| Mode M0 | |||
|---|---|---|---|
| Quadrant | BADHDUFLAG | Total packets | Discarded packets |
| A | 0 | 9319 | 2 |
| B | 0 | 8166 | 1 |
| C | 0 | 8082 | 1 |
| D | 0 | 8599 | 1 |
| Quadrant | Total seconds | Saturated seconds | Saturation percentage |
|---|---|---|---|
| A | 3783 | 87 | 2.299762% |
| B | 3783 | 84 | 2.220460% |
| C | 3783 | 48 | 1.268834% |
| D | 3783 | 146 | 3.859371% |
Noise dominated data is calculated using 1-second bins in cleaned event files. If a bin has >2000 counts, and if more than 50% of those come from <1% of pixels, then it is considered to be noise-dominated and hence unusable.
| Quadrant | # 1 sec bins | Bins with >0 counts | Bins with >2000 counts | High rate bins dominated by noise | Noise dominated (total time) | Noise dominated (detector-on time) | Marked lightcurve |
|---|---|---|---|---|---|---|---|
| A | 5083 | 3784 | 0 | 0 | 0.00% | 0.00% | 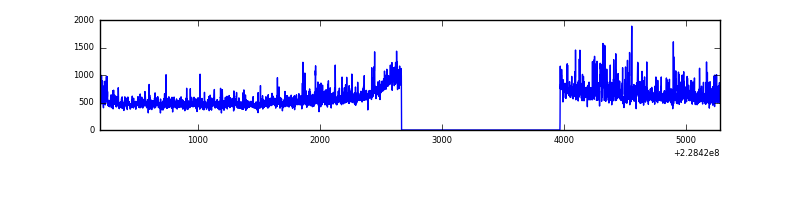 |
| B | 5083 | 3784 | 1 | 1 | 0.02% | 0.03% |  |
| C | 5083 | 3784 | 0 | 0 | 0.00% | 0.00% | 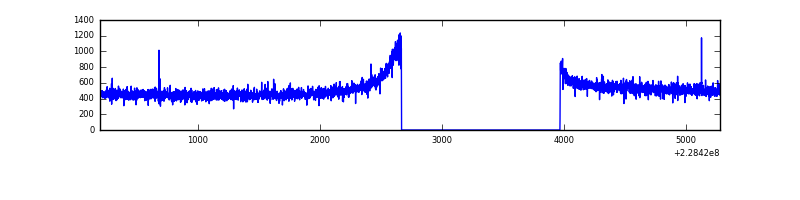 |
| D | 5083 | 3784 | 89 | 89 | 1.75% | 2.35% | 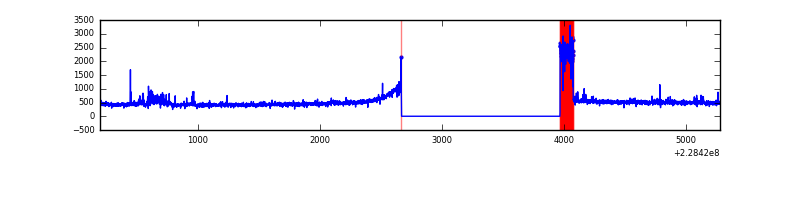 |
Top three noisy pixels from each quadrant. If the there are fewer than three noisy pixels in the level2.evt file, extra rows are filled as -1
| Pixel properties | Quadrant properties | ||||||
|---|---|---|---|---|---|---|---|
| Quadrant | DetID | PixID | Counts | Sigma | Mean | Median | Sigma |
| A | 8 | 15 | 382997 | 3762.5 | 491 | 481 | 101.7 |
| A | 0 | 226 | 4522 | 39.75 | 491 | 481 | 101.7 |
| A | 12 | 194 | 4288 | 37.45 | 491 | 481 | 101.7 |
| B | 11 | 51 | 23233 | 238.53 | 495 | 484 | 95.4 |
| B | 12 | 111 | 9821 | 97.9 | 495 | 484 | 95.4 |
| B | 11 | 111 | 8149 | 80.37 | 495 | 484 | 95.4 |
| C | 1 | 16 | 15815 | 133.96 | 489 | 493 | 114.4 |
| C | 13 | 61 | 3646 | 27.57 | 489 | 493 | 114.4 |
| C | 14 | 67 | 2804 | 20.2 | 489 | 493 | 114.4 |
| D | 1 | 52 | 262524 | 2142.33 | 472 | 460 | 122.3 |
| D | 2 | 234 | 11605 | 91.11 | 472 | 460 | 122.3 |
| D | 5 | 233 | 5548 | 41.59 | 472 | 460 | 122.3 |
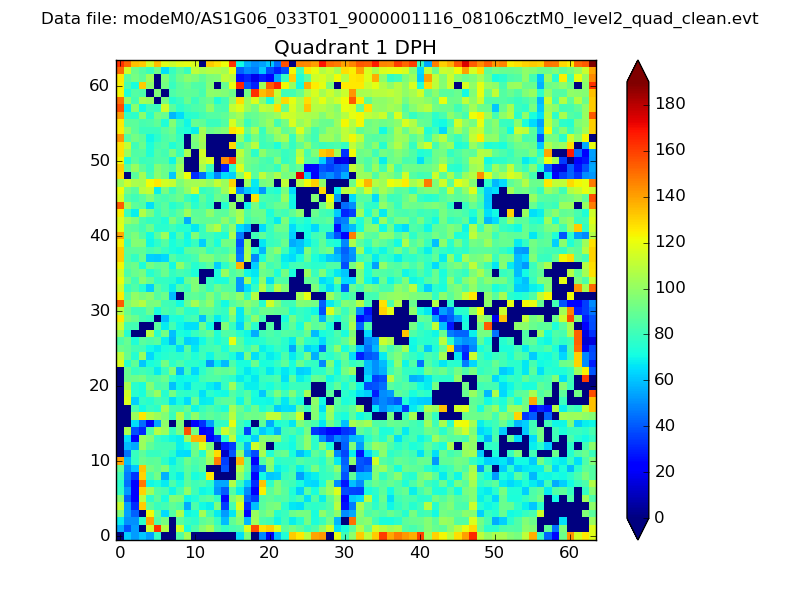
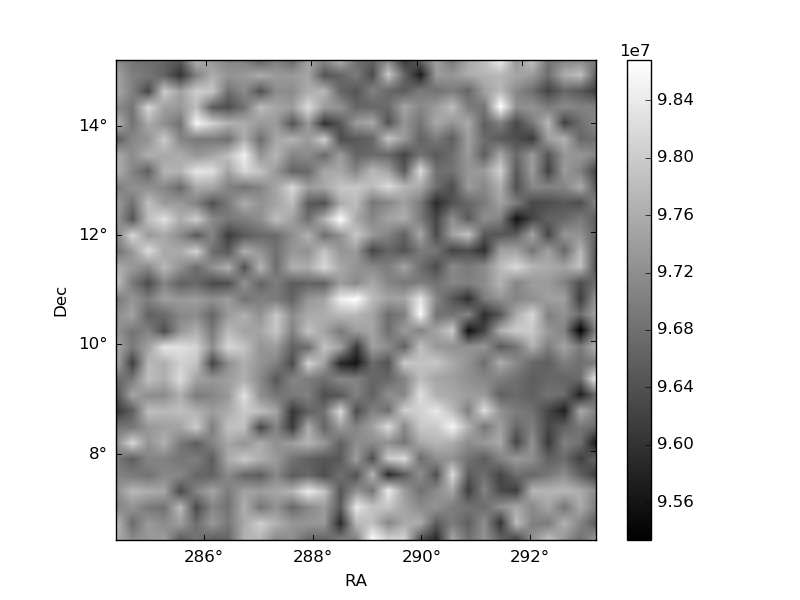
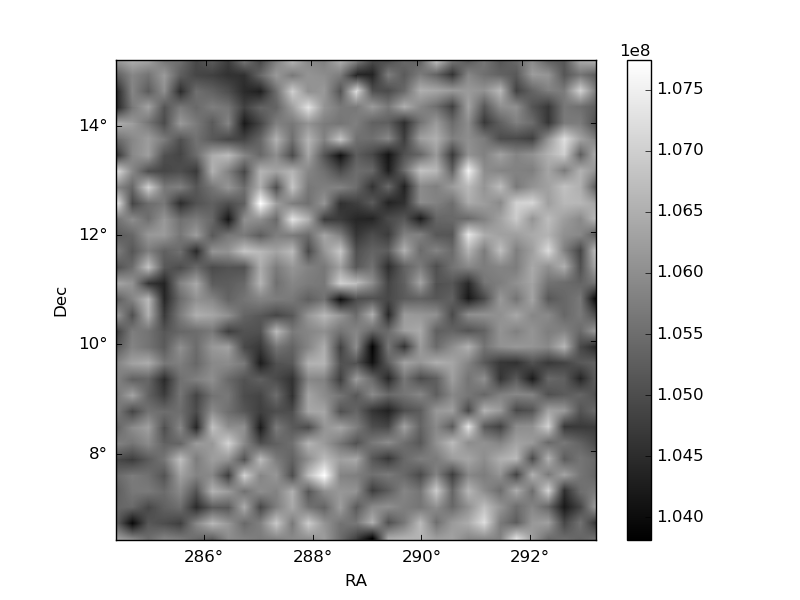
Histogram calculated using DETX and DETY for each event in the final _common_clean file
| Quadrant A | 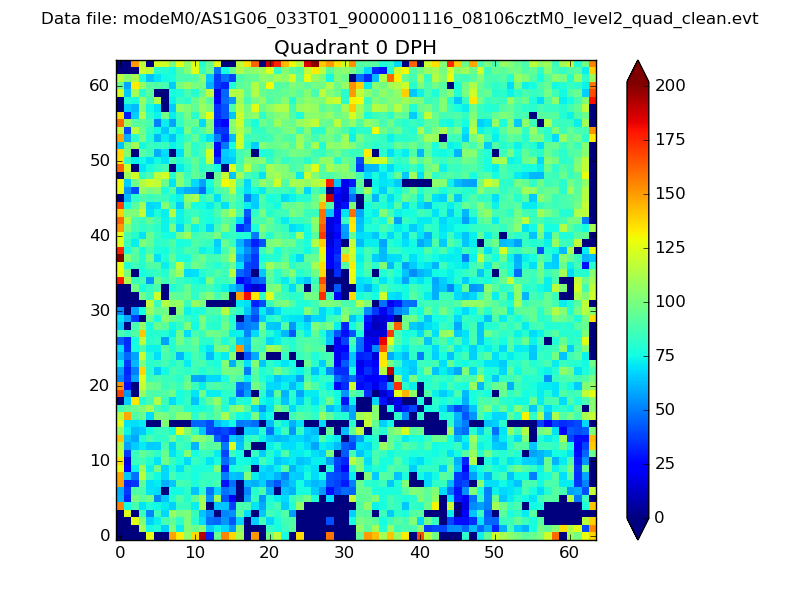 |
 |
Quadrant B |
|---|---|---|---|
| Quadrant D | 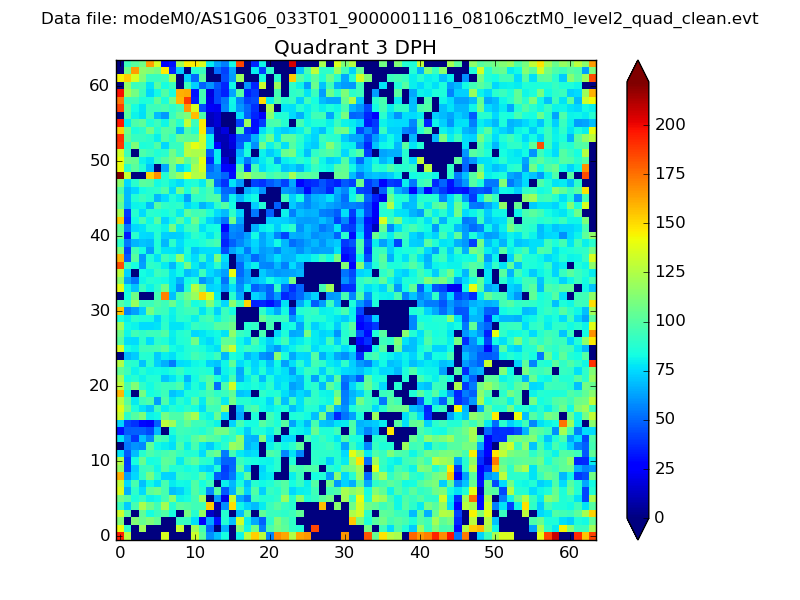 |
 |
Quadrant C |
| Plot type | Count rate plots | Images |
|---|---|---|
| Comparison with Poisson distribution Blue bars denote a histogram of data divided into 1 sec bins. Red curve is a Poisson curve with rate = median count rate of data. |
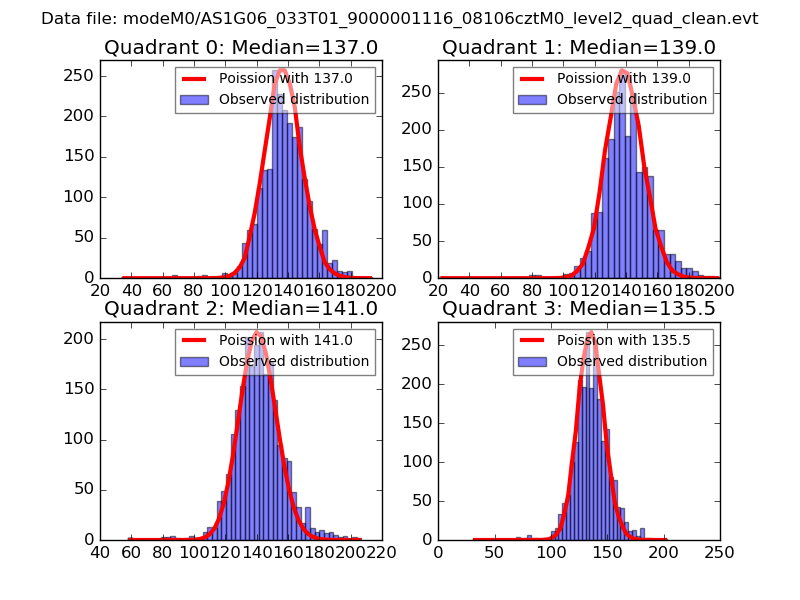 |
 |
| Quadrant-wise count rates Data is divided into 100 sec bins |
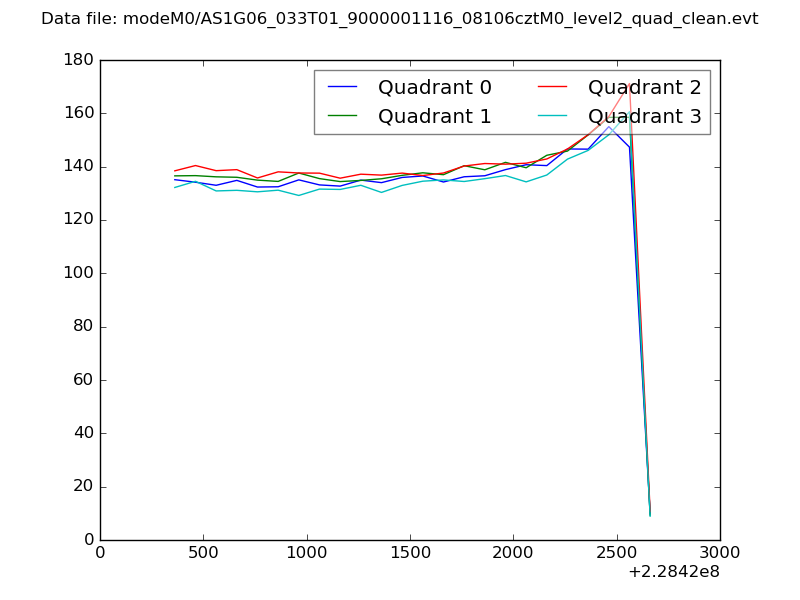 |
|
| Module-wise count rates for Quadrant A Data is divided into 100 sec bins |
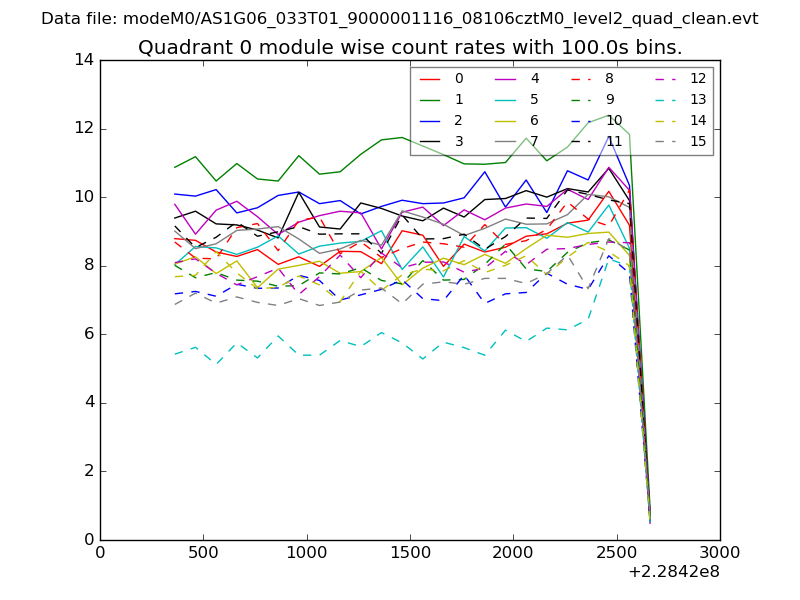 |
 |
| Module-wise count rates for Quadrant B Data is divided into 100 sec bins |
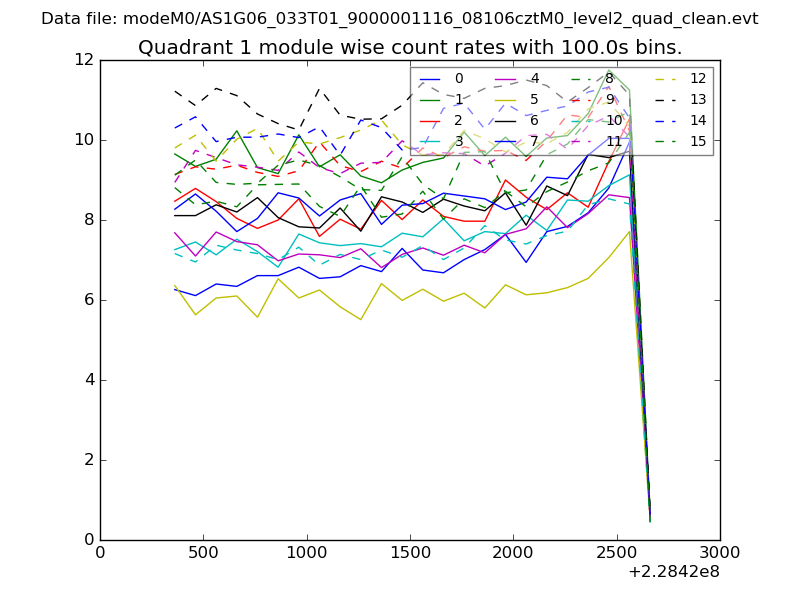 |
 |
| Module-wise count rates for Quadrant C Data is divided into 100 sec bins |
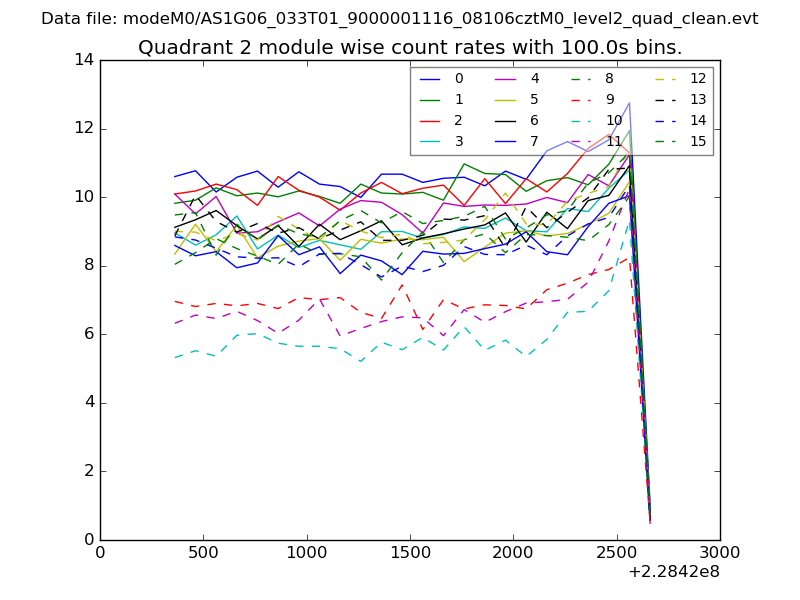 |
 |
| Module-wise count rates for Quadrant D Data is divided into 100 sec bins |
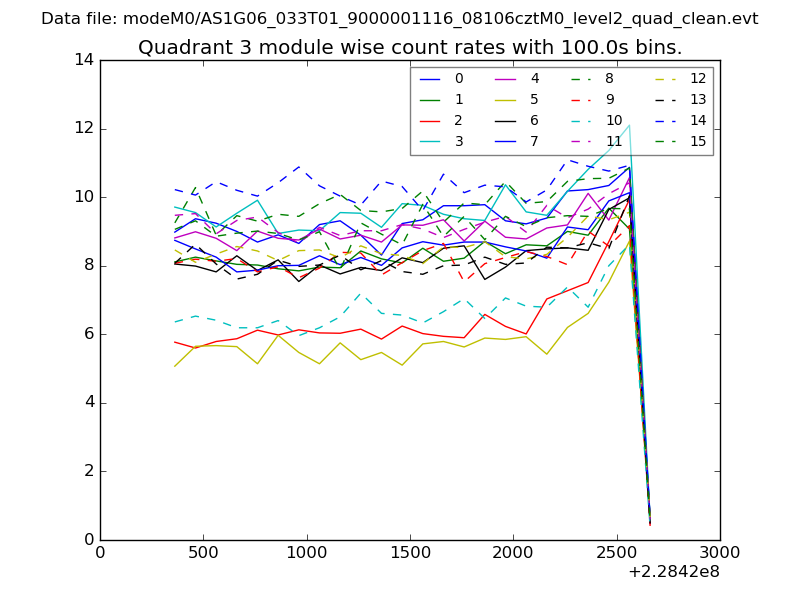 |
 |
| Parameter | Plot |
|---|---|
| CZT HV Monitor | 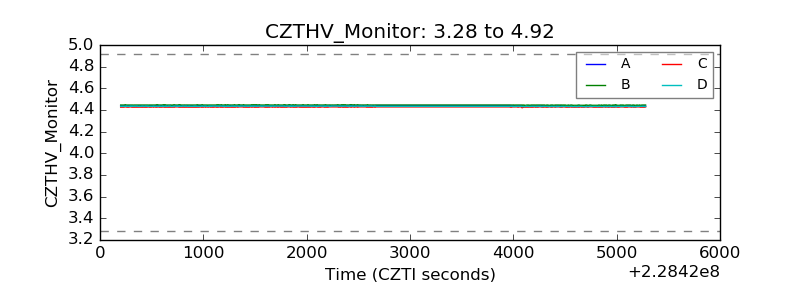 |
| D_VDD | 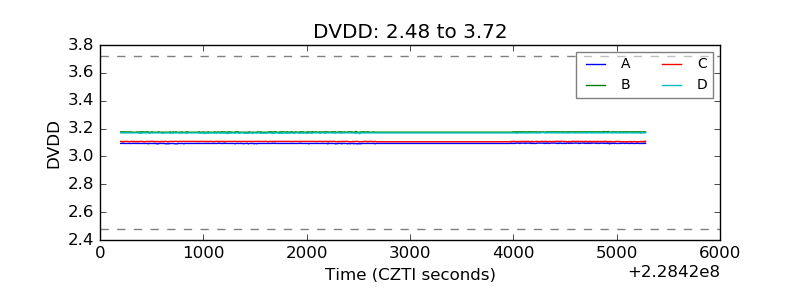 |
| Temperature 1 | 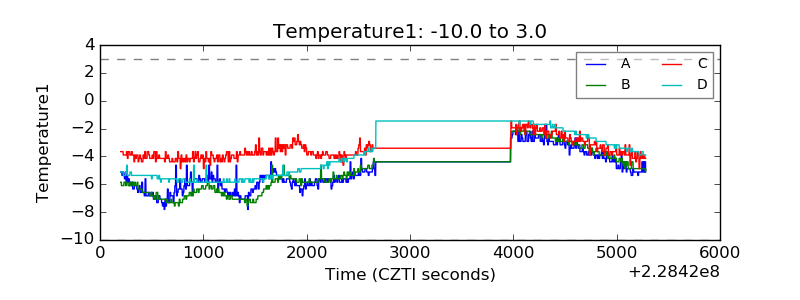 |
| Veto HV Monitor | 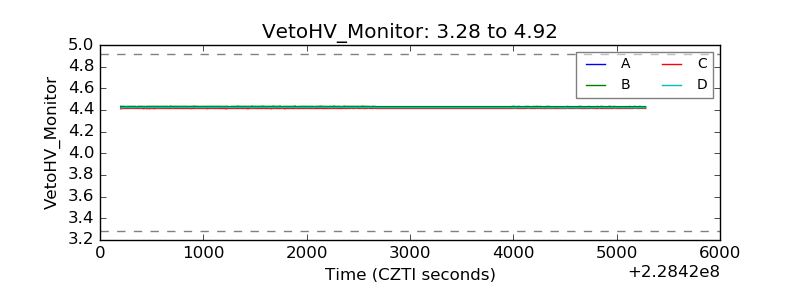 |
| Veto LLD | 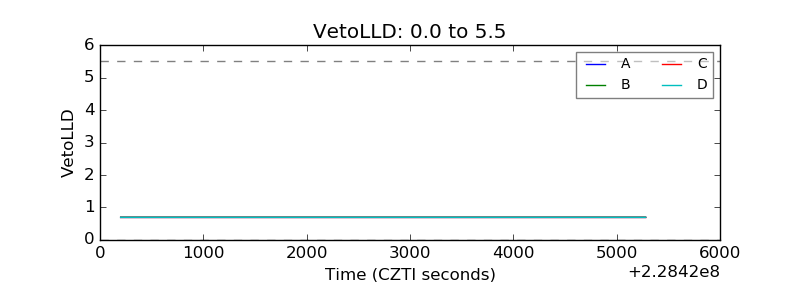 |
| Alpha Counter | 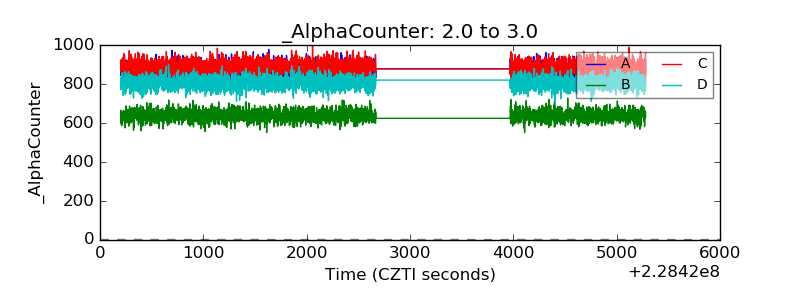 |
| _CPM_Rate | 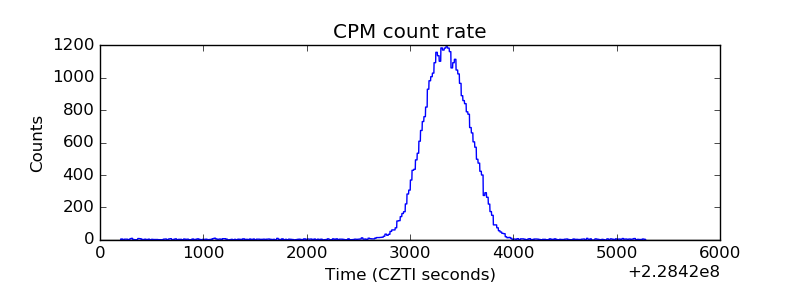 |
| CZT Counter | 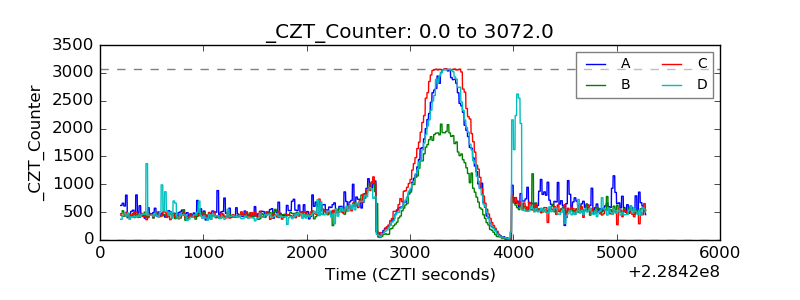 |
| +2.5 Volts monitor |  |
| +5 Volts monitor |  |
| _ROLL_ROT | 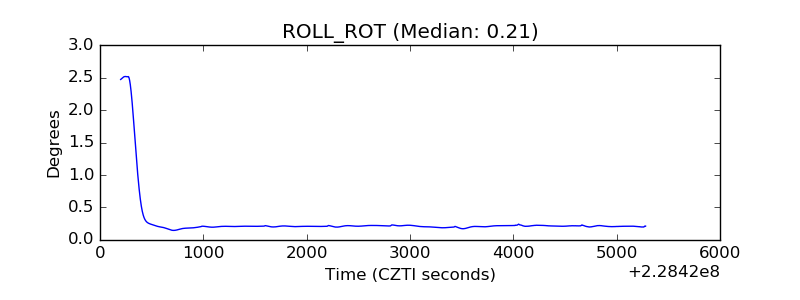 |
| _Roll_DEC | 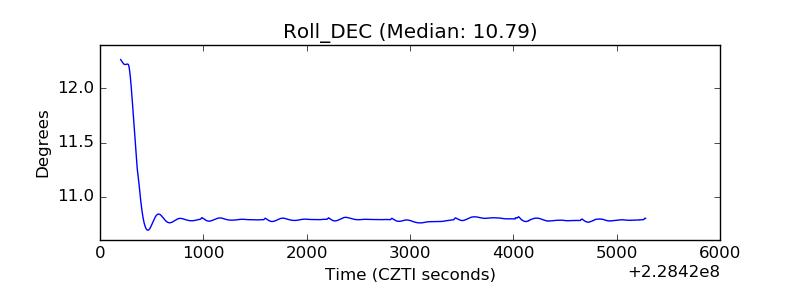 |
| _Roll_RA | 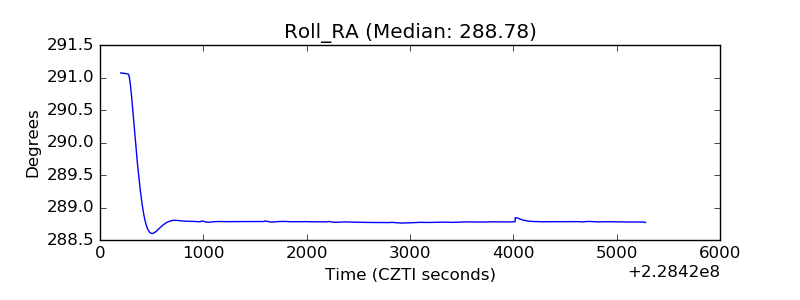 |
| Veto Counter | 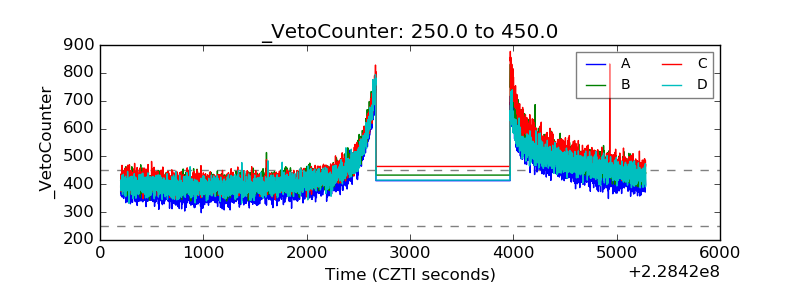 |