| Param | Original file | Final file |
|---|---|---|
| Filename | modeM0/AS1G06_033T01_9000001116_08114cztM0_level2.evt | modeM0/AS1G06_033T01_9000001116_08114cztM0_level2_quad_clean.evt |
| Size (bytes) | 312,765,120 | 67,435,200 |
| Size | 298.3 MB | 64.3 MB |
| Events in quadrant A | 2,214,719 | 429,948 |
| Events in quadrant B | 2,342,917 | 432,932 |
| Events in quadrant C | 2,148,489 | 433,007 |
| Events in quadrant D | 2,440,689 | 412,333 |
| Mode M9 | |||
|---|---|---|---|
| Quadrant | BADHDUFLAG | Total packets | Discarded packets |
| A | 0 | 8 | 0 |
| B | 0 | 8 | 2 |
| C | 0 | 8 | 3 |
| D | 0 | 8 | 1 |
| Mode SS | |||
|---|---|---|---|
| Quadrant | BADHDUFLAG | Total packets | Discarded packets |
| A | 0 | 138 | 50 |
| B | 0 | 138 | 42 |
| C | 0 | 137 | 41 |
| D | 0 | 136 | 36 |
| Mode M0 | |||
|---|---|---|---|
| Quadrant | BADHDUFLAG | Total packets | Discarded packets |
| A | 0 | 13639 | 3964 |
| B | 0 | 14131 | 4200 |
| C | 0 | 13596 | 3972 |
| D | 0 | 15382 | 4865 |
| Quadrant | Total seconds | Saturated seconds | Saturation percentage |
|---|---|---|---|
| A | 4772 | 51 | 1.068734% |
| B | 4758 | 62 | 1.303069% |
| C | 4758 | 30 | 0.630517% |
| D | 4700 | 62 | 1.319149% |
Noise dominated data is calculated using 1-second bins in cleaned event files. If a bin has >2000 counts, and if more than 50% of those come from <1% of pixels, then it is considered to be noise-dominated and hence unusable.
| Quadrant | # 1 sec bins | Bins with >0 counts | Bins with >2000 counts | High rate bins dominated by noise | Noise dominated (total time) | Noise dominated (detector-on time) | Marked lightcurve |
|---|---|---|---|---|---|---|---|
| A | 7523 | 5596 | 0 | 0 | 0.00% | 0.00% | 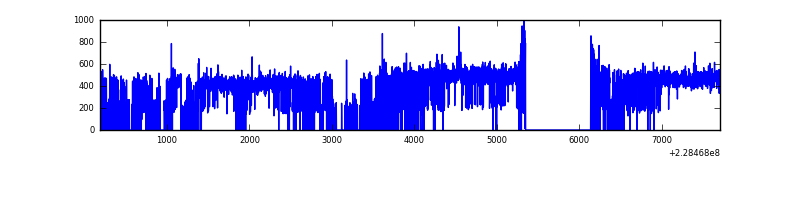 |
| B | 7523 | 5572 | 4 | 4 | 0.05% | 0.07% | 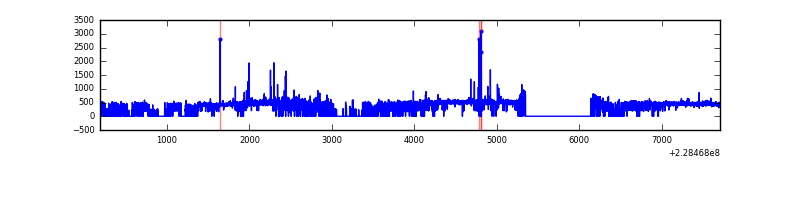 |
| C | 7523 | 5575 | 0 | 0 | 0.00% | 0.00% | 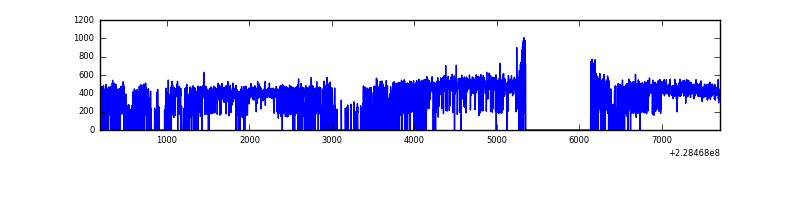 |
| D | 7523 | 5504 | 14 | 14 | 0.19% | 0.25% | 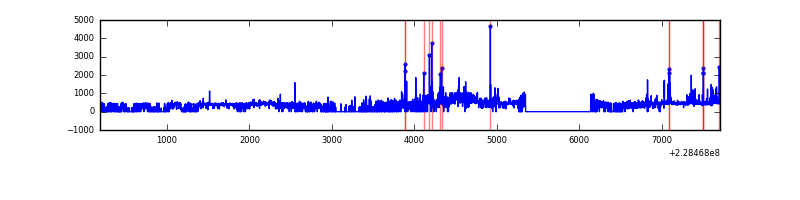 |
Top three noisy pixels from each quadrant. If the there are fewer than three noisy pixels in the level2.evt file, extra rows are filled as -1
| Pixel properties | Quadrant properties | ||||||
|---|---|---|---|---|---|---|---|
| Quadrant | DetID | PixID | Counts | Sigma | Mean | Median | Sigma |
| A | 8 | 15 | 26915 | 225.19 | 566 | 555 | 117.1 |
| A | 2 | 79 | 8178 | 65.12 | 566 | 555 | 117.1 |
| A | 0 | 226 | 5274 | 40.31 | 566 | 555 | 117.1 |
| B | 0 | 214 | 60322 | 543.05 | 566 | 554 | 110.1 |
| B | 10 | 16 | 41670 | 373.58 | 566 | 554 | 110.1 |
| B | 11 | 51 | 20523 | 181.44 | 566 | 554 | 110.1 |
| C | 13 | 61 | 4315 | 29.02 | 550 | 553 | 129.6 |
| C | 1 | 16 | 2949 | 18.48 | 550 | 553 | 129.6 |
| C | 8 | 222 | 1378 | 6.36 | 550 | 553 | 129.6 |
| D | 2 | 152 | 168606 | 1253.98 | 542 | 526 | 134.0 |
| D | 1 | 52 | 123648 | 918.56 | 542 | 526 | 134.0 |
| D | 5 | 233 | 51274 | 378.61 | 542 | 526 | 134.0 |
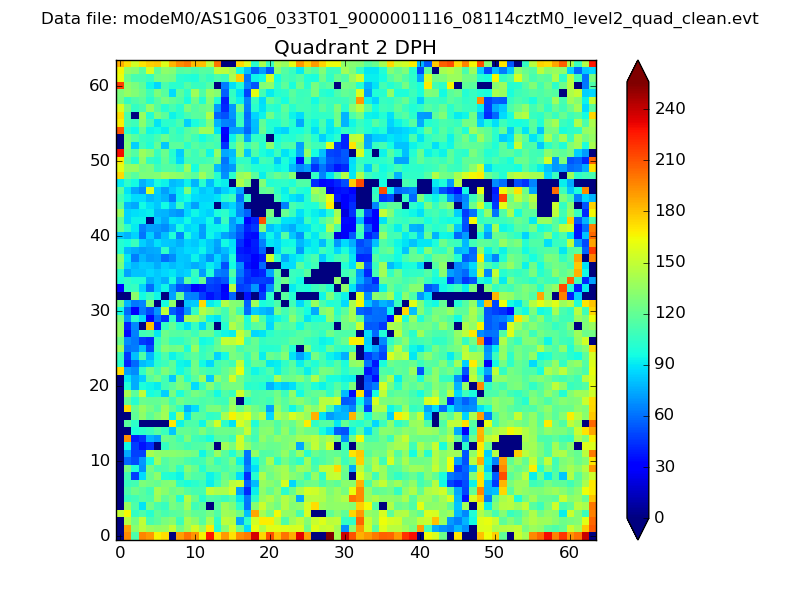
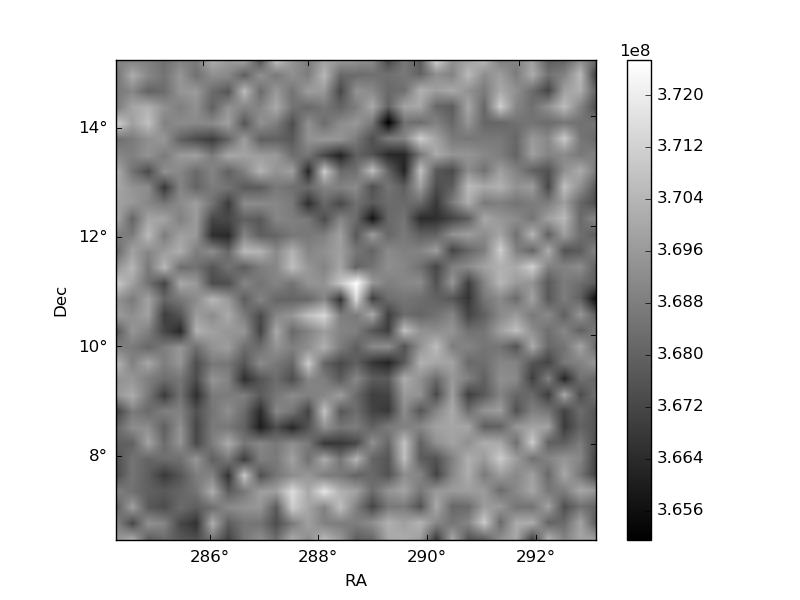
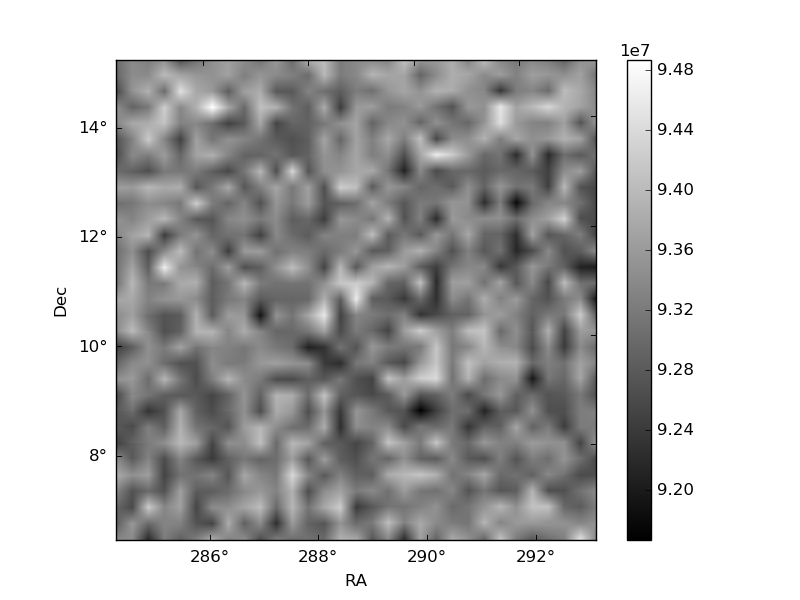
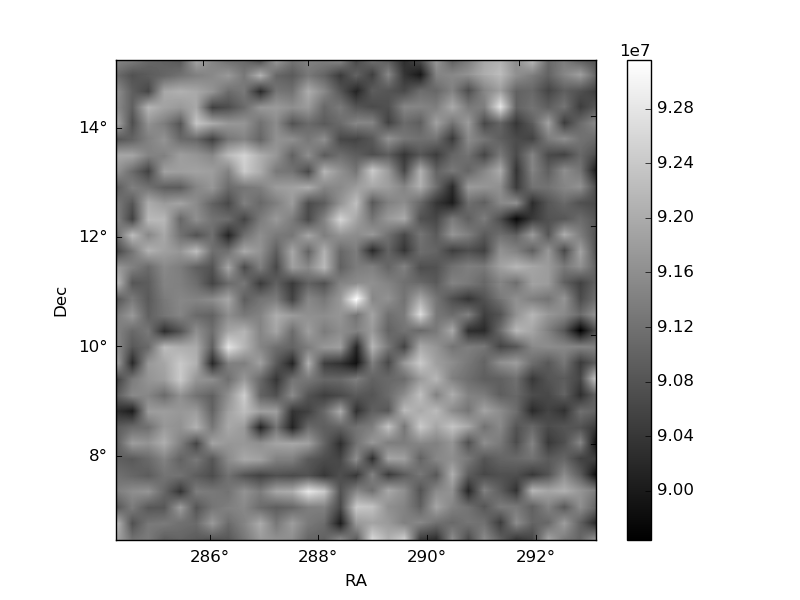
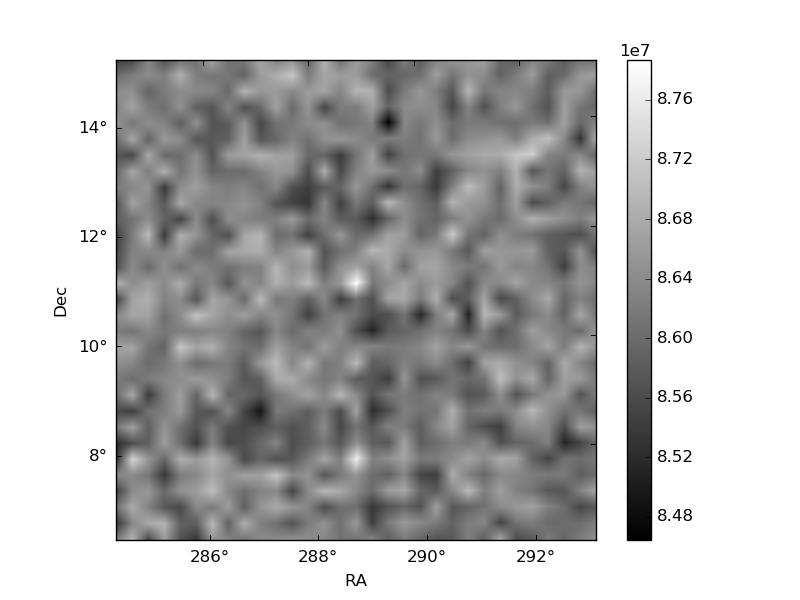
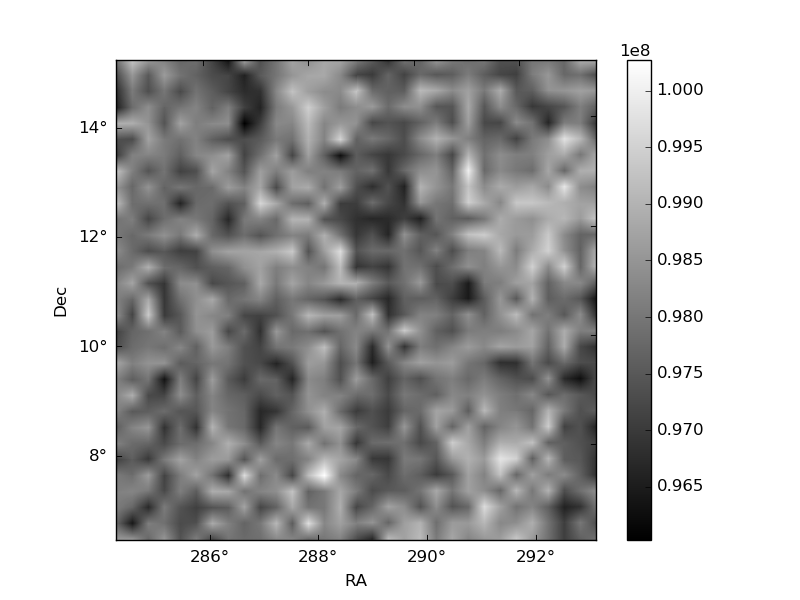
Histogram calculated using DETX and DETY for each event in the final _common_clean file
| Quadrant A | 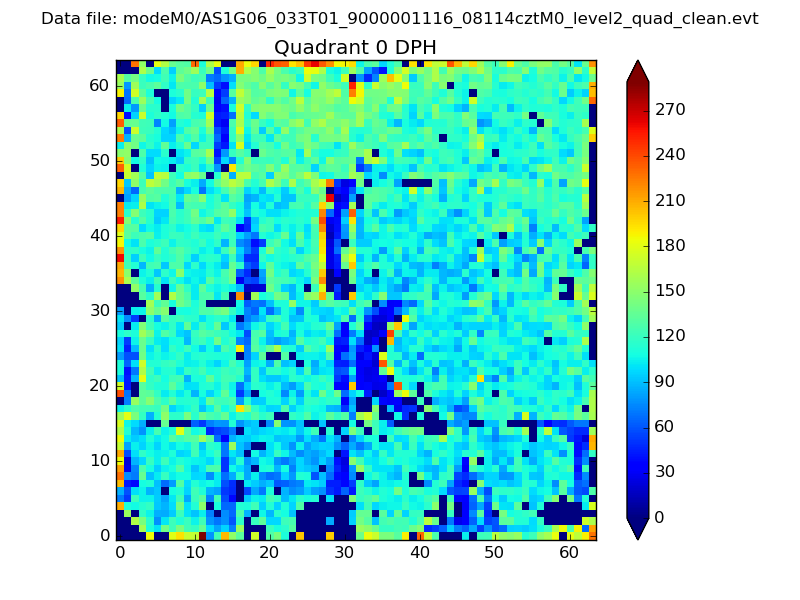 |
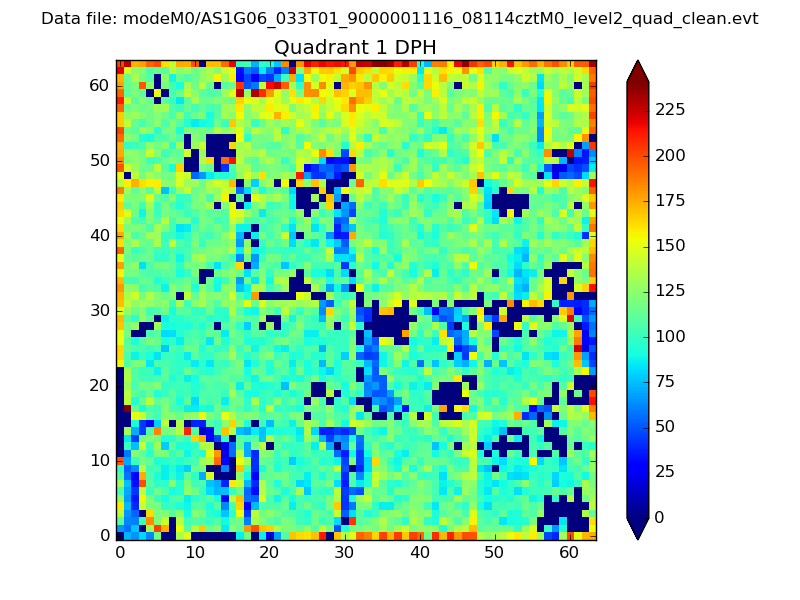 |
Quadrant B |
|---|---|---|---|
| Quadrant D | 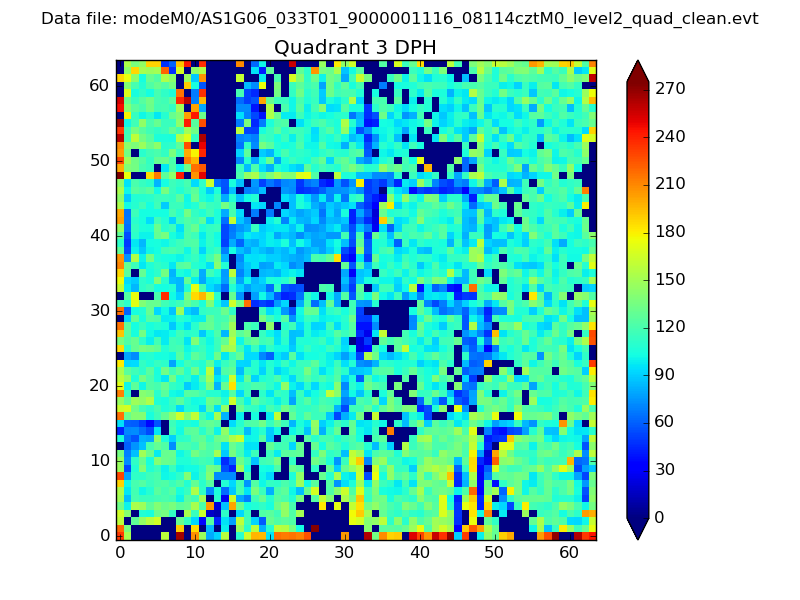 |
 |
Quadrant C |
| Plot type | Count rate plots | Images |
|---|---|---|
| Comparison with Poisson distribution Blue bars denote a histogram of data divided into 1 sec bins. Red curve is a Poisson curve with rate = median count rate of data. |
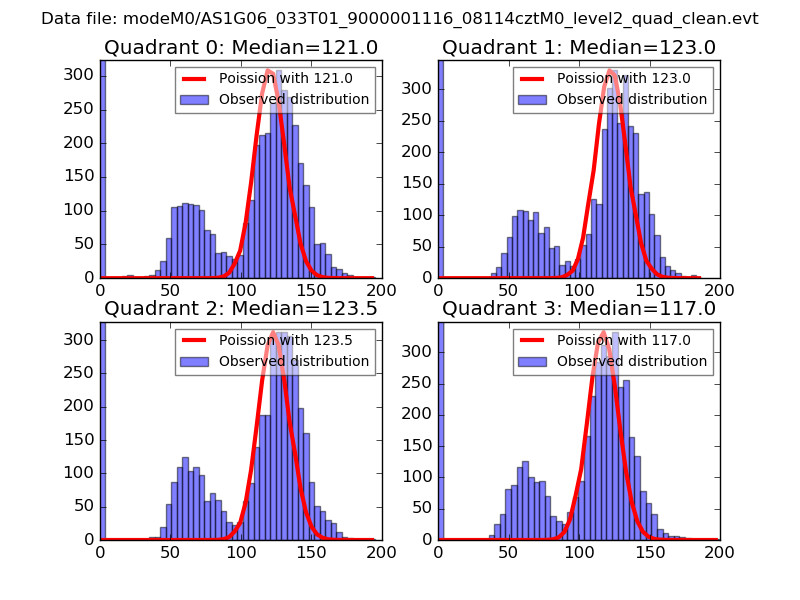 |
 |
| Quadrant-wise count rates Data is divided into 100 sec bins |
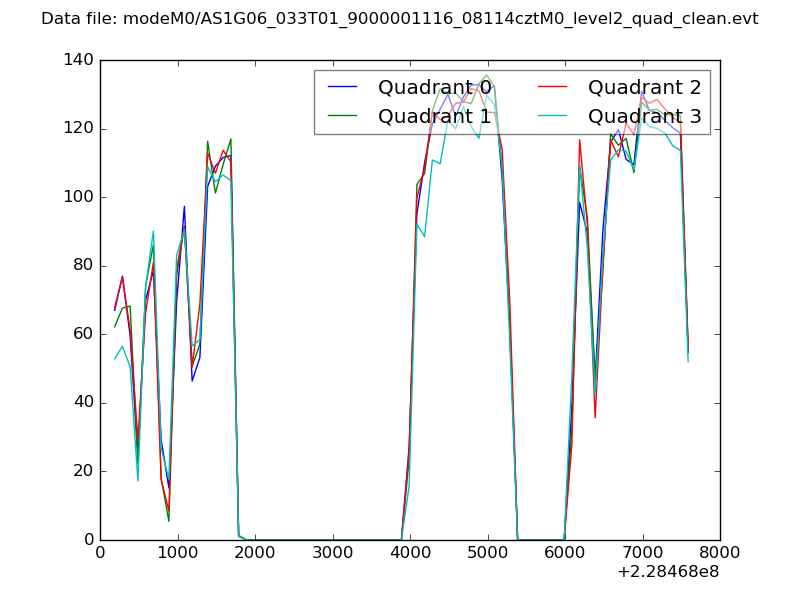 |
|
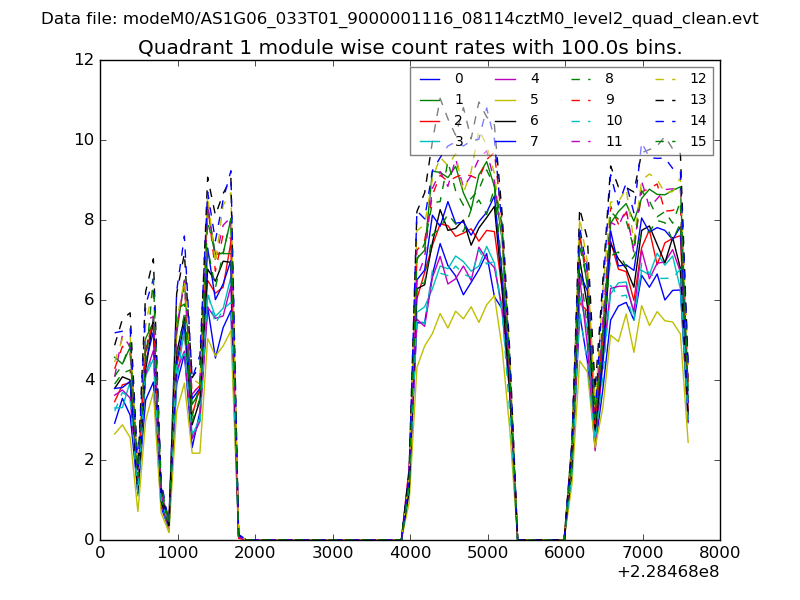
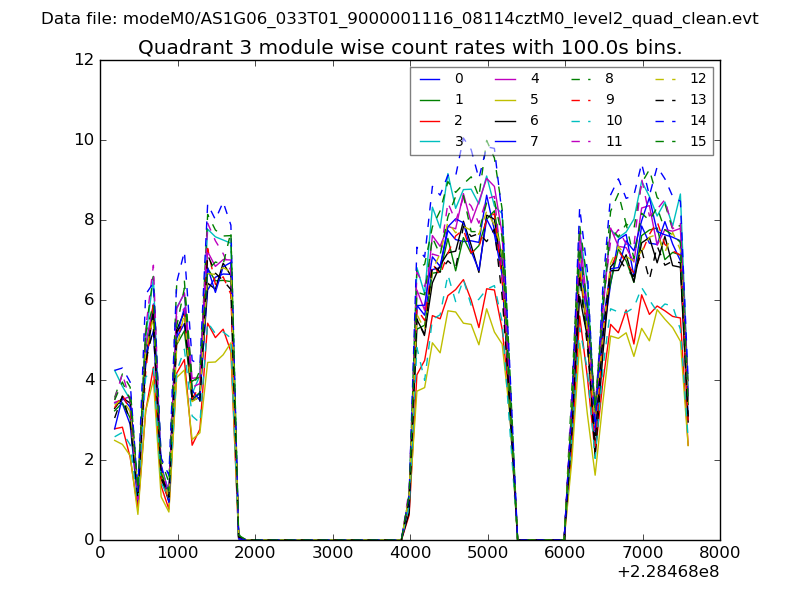
| Module-wise count rates for Quadrant A Data is divided into 100 sec bins |
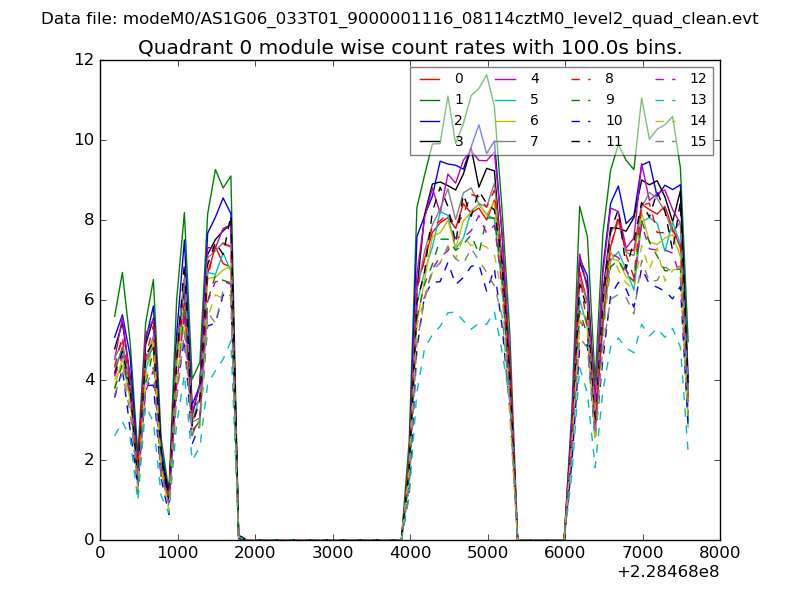 |
 |
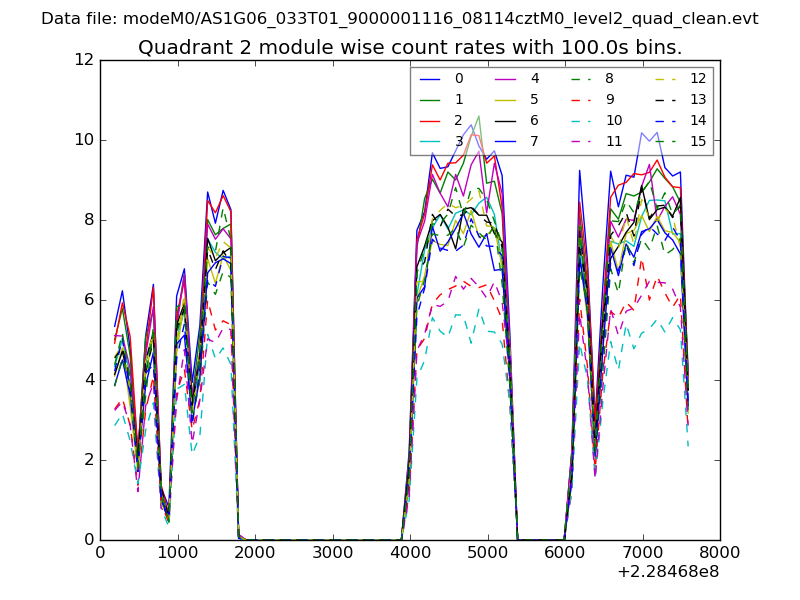
| Module-wise count rates for Quadrant B Data is divided into 100 sec bins |
 |
 |
| Module-wise count rates for Quadrant C Data is divided into 100 sec bins |
 |
 |
| Module-wise count rates for Quadrant D Data is divided into 100 sec bins |
 |
 |
| Parameter | Plot |
|---|---|
| CZT HV Monitor | 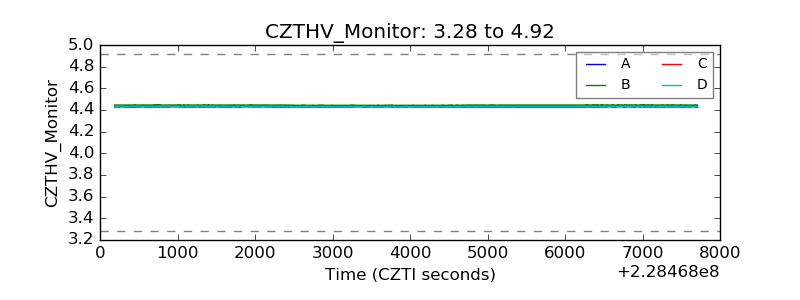 |
| D_VDD | 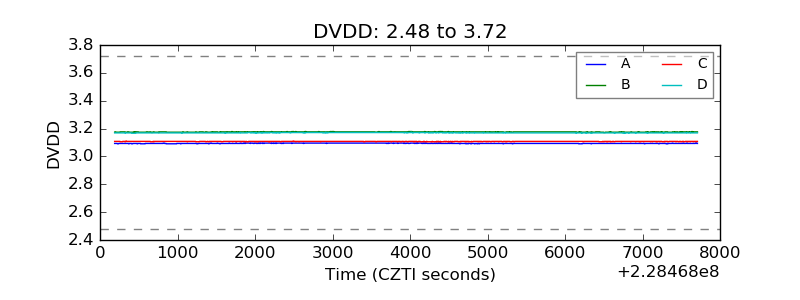 |
| Temperature 1 | 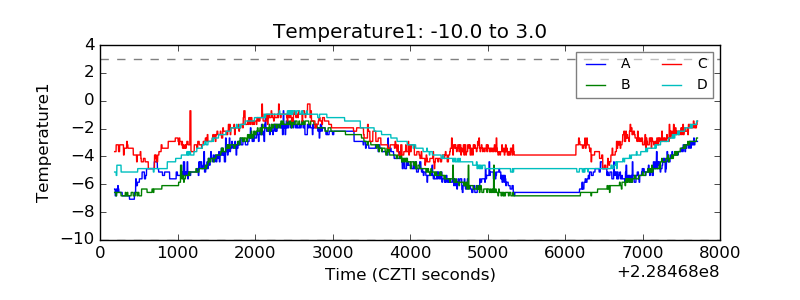 |
| Veto HV Monitor | 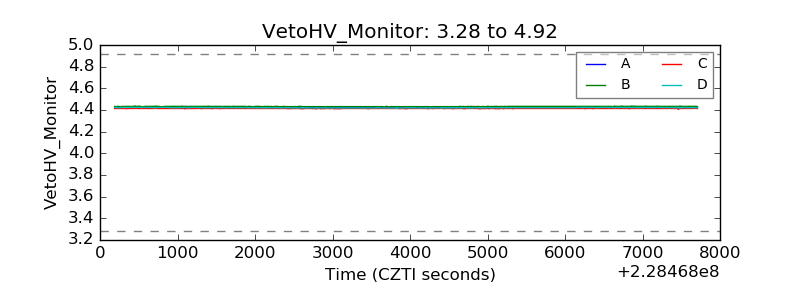 |
| Veto LLD | 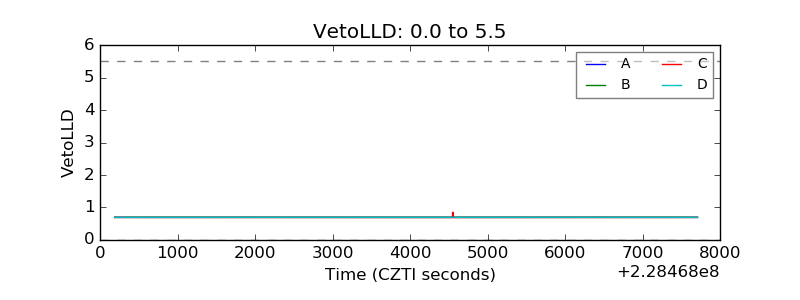 |
| Alpha Counter | 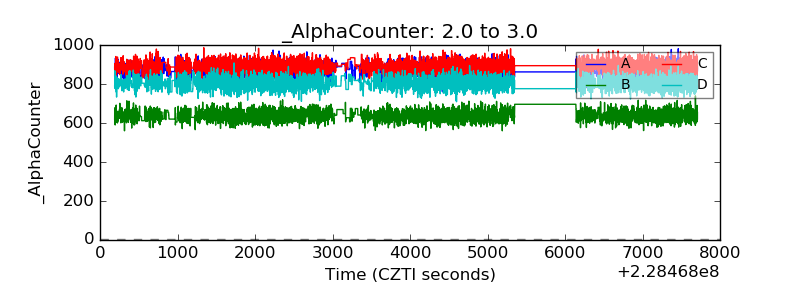 |
| _CPM_Rate | 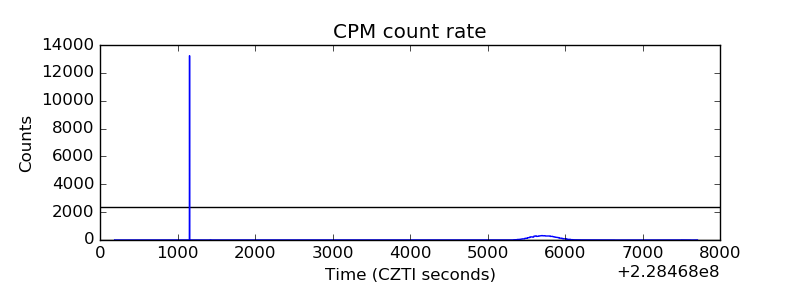 |
| CZT Counter | 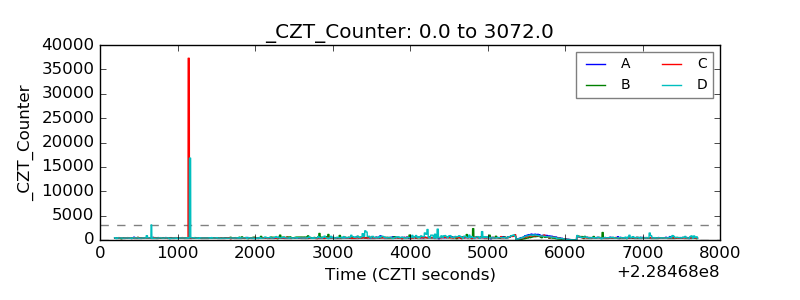 |
| +2.5 Volts monitor |  |
| +5 Volts monitor |  |
| _ROLL_ROT | 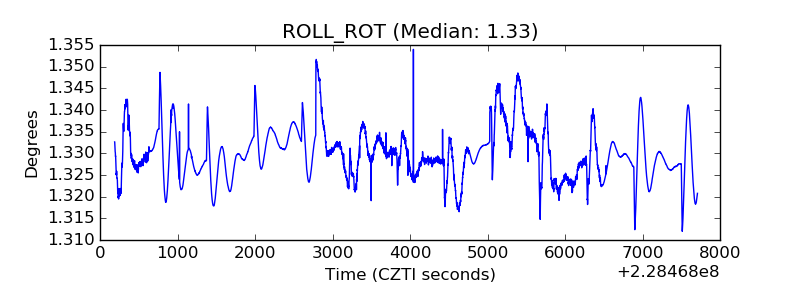 |
| _Roll_DEC | 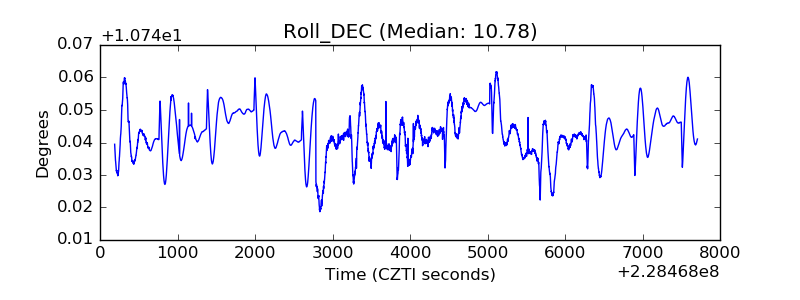 |
| _Roll_RA | 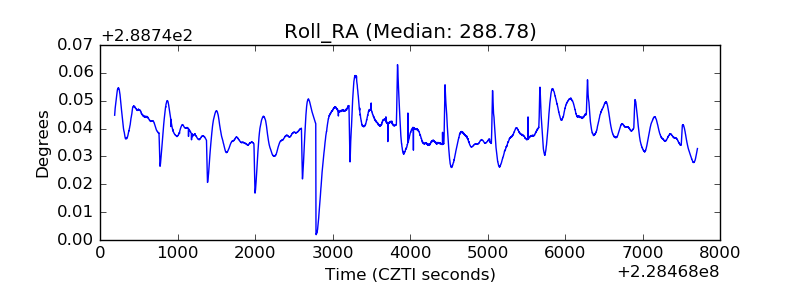 |
| Veto Counter | 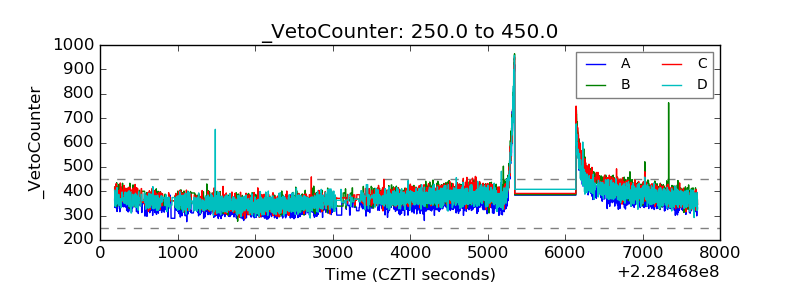 |