| Param | Original file | Final file |
|---|---|---|
| Filename | modeM0/AS1G06_033T01_9000001116_08115cztM0_level2.evt | modeM0/AS1G06_033T01_9000001116_08115cztM0_level2_quad_clean.evt |
| Size (bytes) | 432,011,520 | 76,826,880 |
| Size | 412.0 MB | 73.3 MB |
| Events in quadrant A | 3,118,617 | 471,306 |
| Events in quadrant B | 3,101,801 | 476,882 |
| Events in quadrant C | 2,949,851 | 477,250 |
| Events in quadrant D | 3,476,242 | 452,584 |
| Mode M9 | |||
|---|---|---|---|
| Quadrant | BADHDUFLAG | Total packets | Discarded packets |
| A | 0 | 9 | 0 |
| B | 0 | 9 | 0 |
| C | 0 | 9 | 0 |
| D | 0 | 9 | 0 |
| Mode SS | |||
|---|---|---|---|
| Quadrant | BADHDUFLAG | Total packets | Discarded packets |
| A | 0 | 130 | 0 |
| B | 0 | 130 | 0 |
| C | 0 | 130 | 0 |
| D | 0 | 130 | 0 |
| Mode M0 | |||
|---|---|---|---|
| Quadrant | BADHDUFLAG | Total packets | Discarded packets |
| A | 0 | 13230 | 2 |
| B | 0 | 13248 | 1 |
| C | 0 | 13051 | 1 |
| D | 0 | 14481 | 1 |
| Quadrant | Total seconds | Saturated seconds | Saturation percentage |
|---|---|---|---|
| A | 6428 | 92 | 1.431238% |
| B | 6428 | 77 | 1.197884% |
| C | 6428 | 63 | 0.980087% |
| D | 6428 | 99 | 1.540137% |
Noise dominated data is calculated using 1-second bins in cleaned event files. If a bin has >2000 counts, and if more than 50% of those come from <1% of pixels, then it is considered to be noise-dominated and hence unusable.
| Quadrant | # 1 sec bins | Bins with >0 counts | Bins with >2000 counts | High rate bins dominated by noise | Noise dominated (total time) | Noise dominated (detector-on time) | Marked lightcurve |
|---|---|---|---|---|---|---|---|
| A | 7368 | 6428 | 0 | 0 | 0.00% | 0.00% | 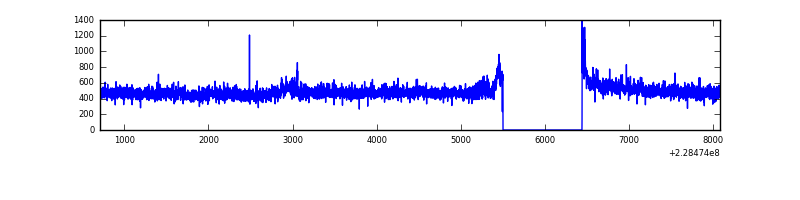 |
| B | 7368 | 6428 | 2 | 2 | 0.03% | 0.03% |  |
| C | 7368 | 6428 | 0 | 0 | 0.00% | 0.00% |  |
| D | 7368 | 6428 | 31 | 31 | 0.42% | 0.48% | 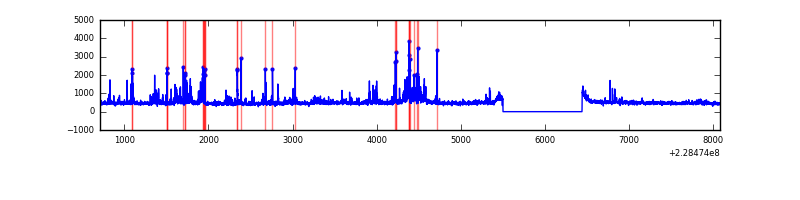 |
Top three noisy pixels from each quadrant. If the there are fewer than three noisy pixels in the level2.evt file, extra rows are filled as -1
| Pixel properties | Quadrant properties | ||||||
|---|---|---|---|---|---|---|---|
| Quadrant | DetID | PixID | Counts | Sigma | Mean | Median | Sigma |
| A | 8 | 15 | 122535 | 761.2 | 778 | 763 | 160.0 |
| A | 0 | 226 | 7404 | 41.51 | 778 | 763 | 160.0 |
| A | 12 | 194 | 7068 | 39.41 | 778 | 763 | 160.0 |
| B | 0 | 214 | 45125 | 296.23 | 777 | 758 | 149.8 |
| B | 10 | 16 | 20191 | 129.75 | 777 | 758 | 149.8 |
| B | 12 | 111 | 15310 | 97.16 | 777 | 758 | 149.8 |
| C | 13 | 61 | 5787 | 28.63 | 755 | 760 | 175.6 |
| C | 1 | 16 | 3535 | 15.8 | 755 | 760 | 175.6 |
| C | 8 | 222 | 2368 | 9.16 | 755 | 760 | 175.6 |
| D | 1 | 52 | 311843 | 1662.01 | 757 | 735 | 187.2 |
| D | 2 | 152 | 77131 | 408.12 | 757 | 735 | 187.2 |
| D | 7 | 71 | 76798 | 406.35 | 757 | 735 | 187.2 |
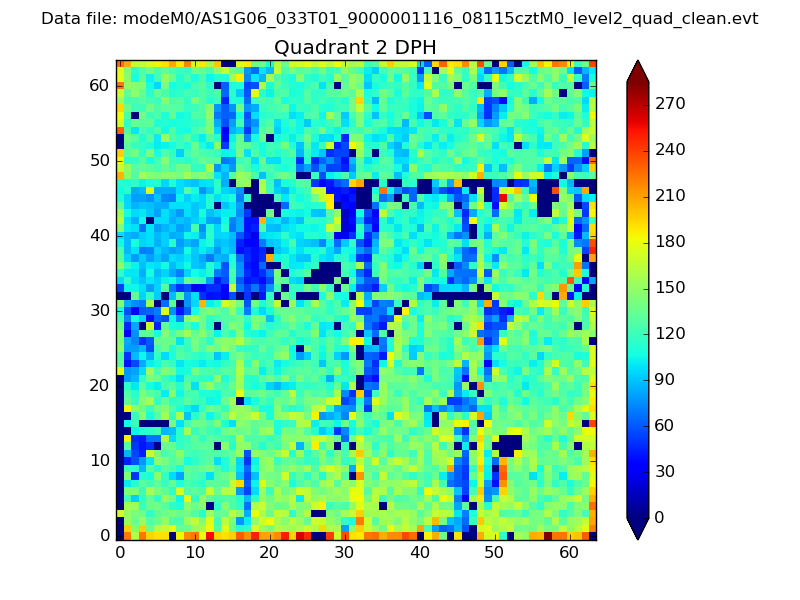
Histogram calculated using DETX and DETY for each event in the final _common_clean file
| Quadrant A | 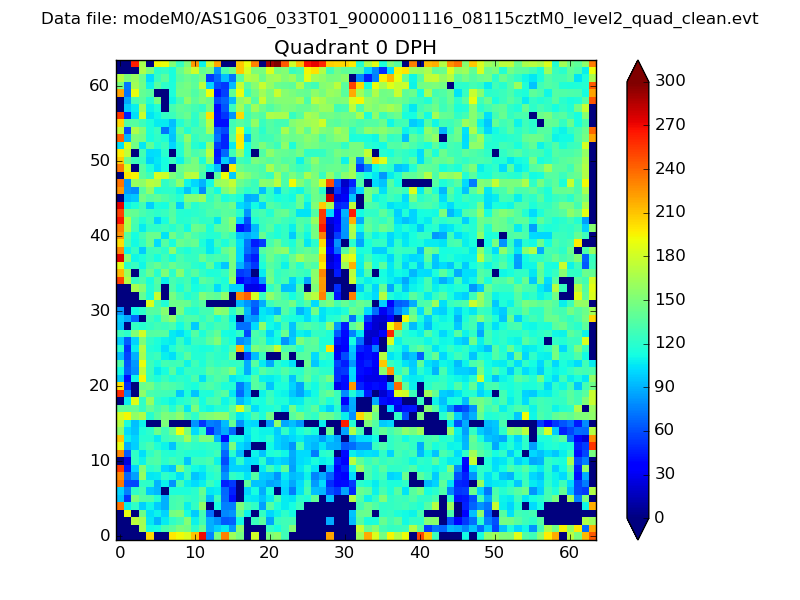 |
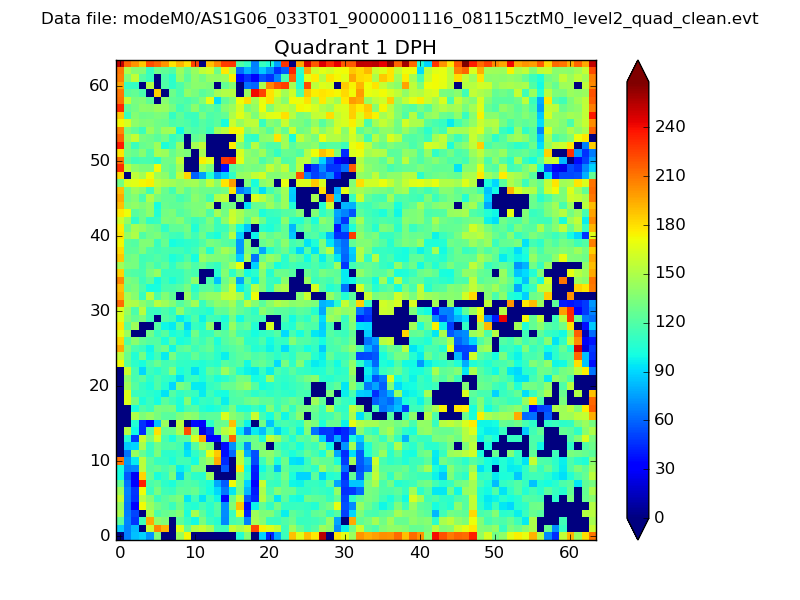 |
Quadrant B |
|---|---|---|---|
| Quadrant D | 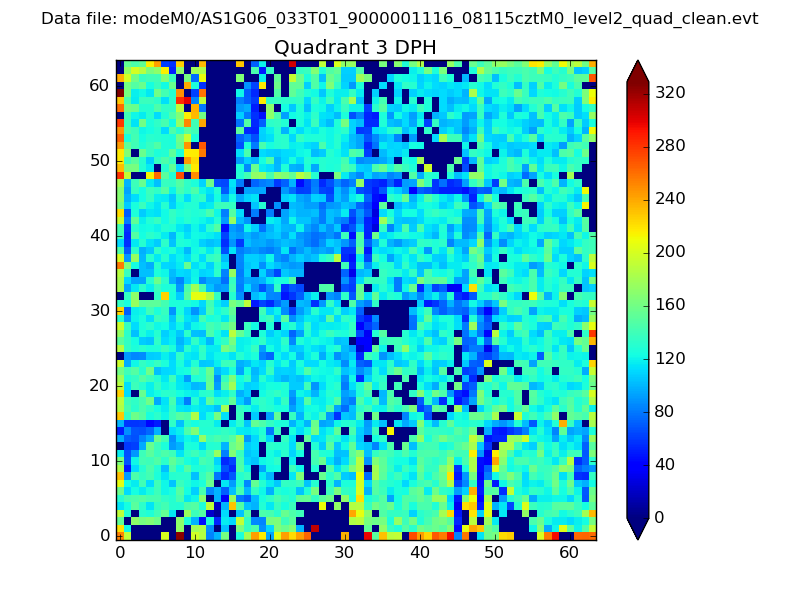 |
 |
Quadrant C |
| Plot type | Count rate plots | Images |
|---|---|---|
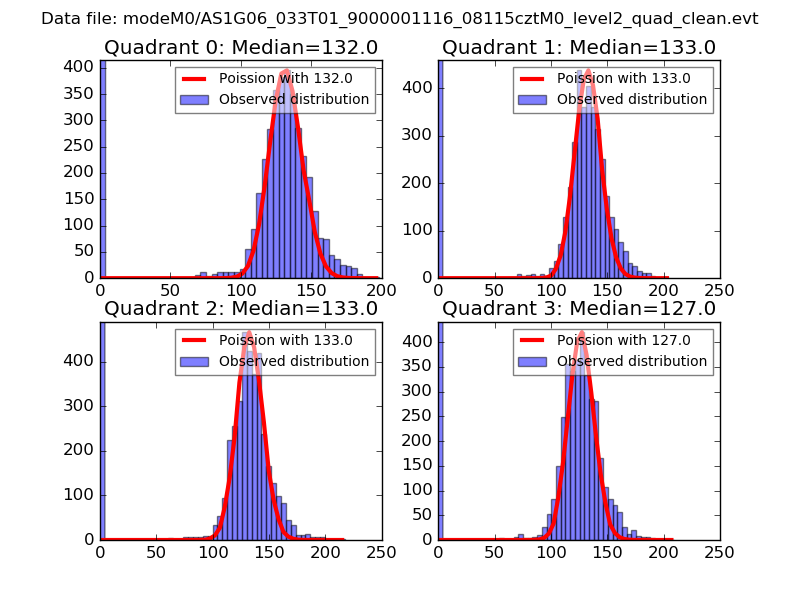
| Comparison with Poisson distribution Blue bars denote a histogram of data divided into 1 sec bins. Red curve is a Poisson curve with rate = median count rate of data. |
 |
 |
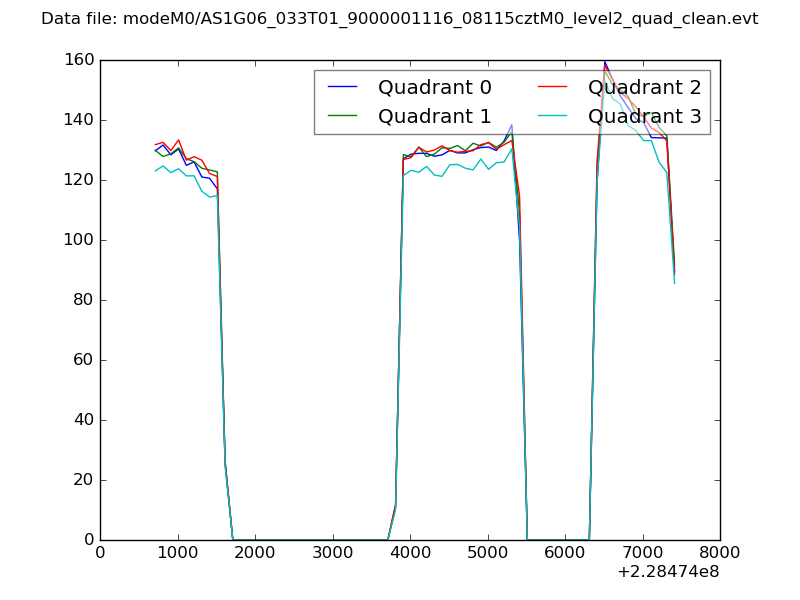
| Quadrant-wise count rates Data is divided into 100 sec bins |
 |
|
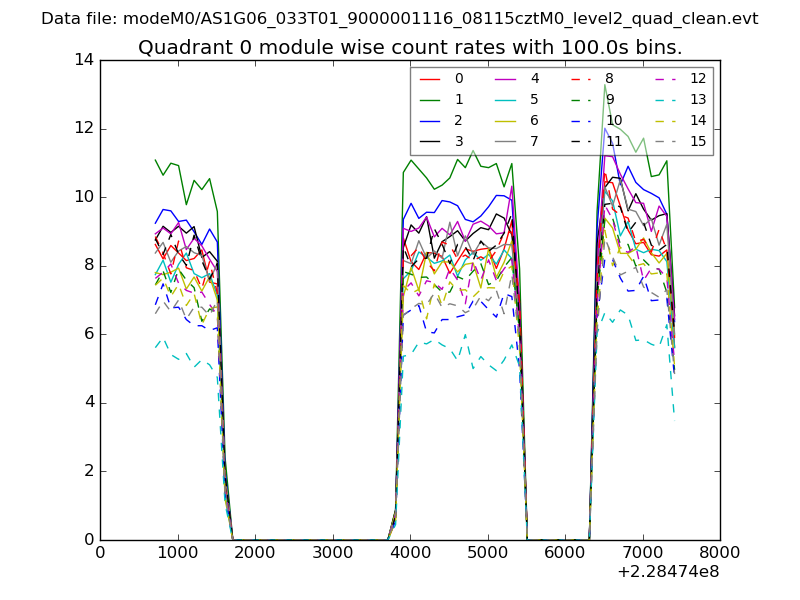
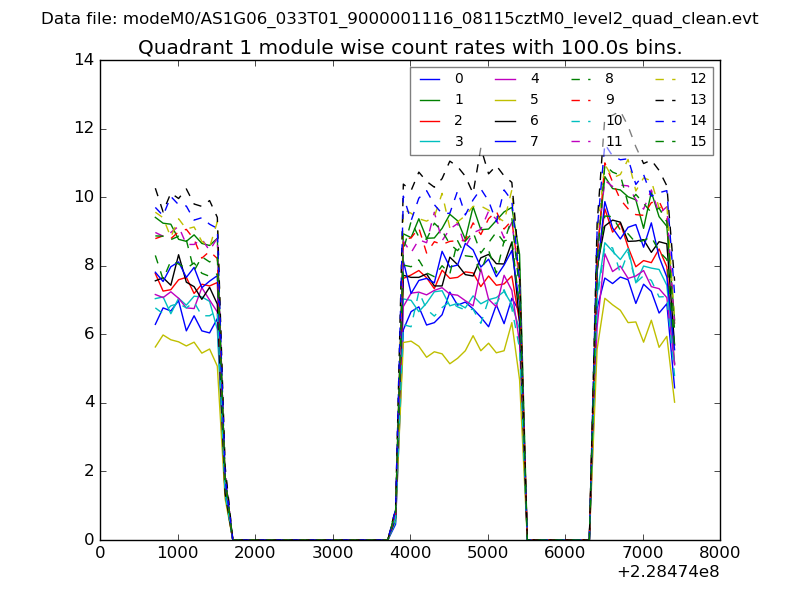
| Module-wise count rates for Quadrant A Data is divided into 100 sec bins |
 |
 |
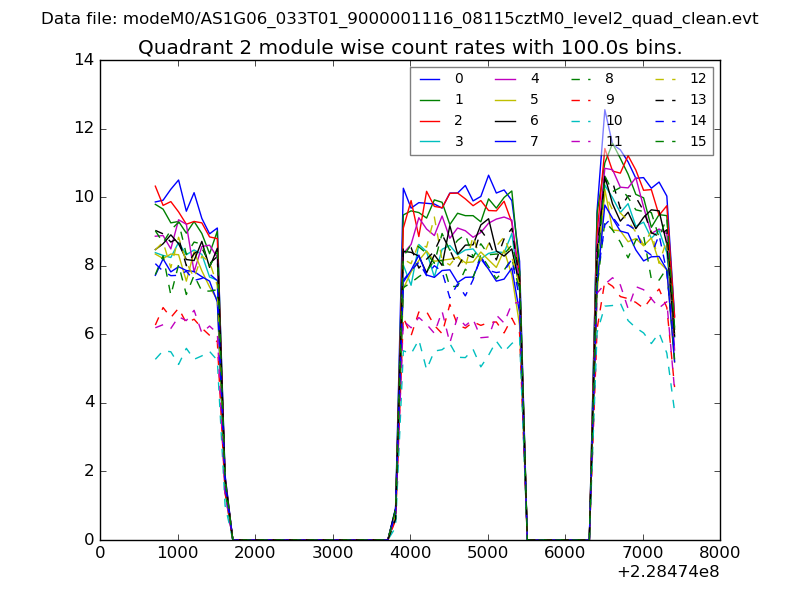
| Module-wise count rates for Quadrant B Data is divided into 100 sec bins |
 |
 |
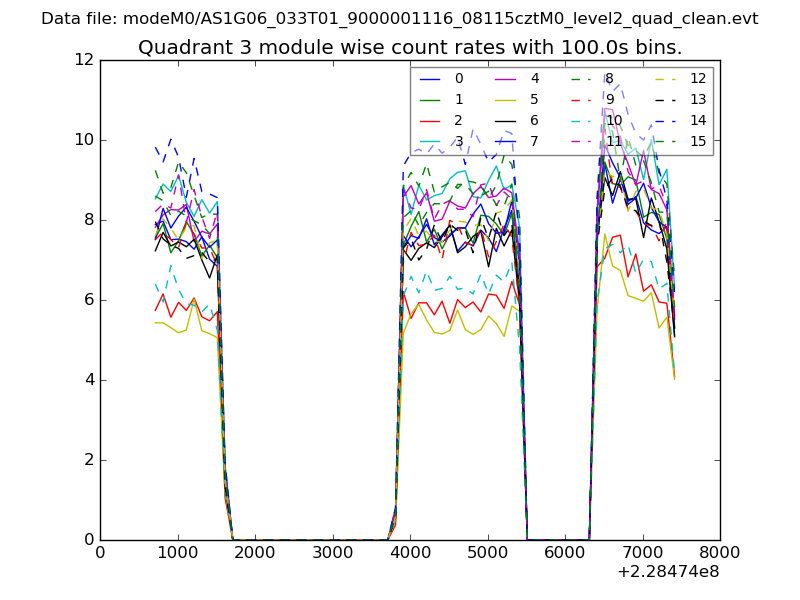
| Module-wise count rates for Quadrant C Data is divided into 100 sec bins |
 |
 |
| Module-wise count rates for Quadrant D Data is divided into 100 sec bins |
 |
 |
| Parameter | Plot |
|---|---|
| CZT HV Monitor | 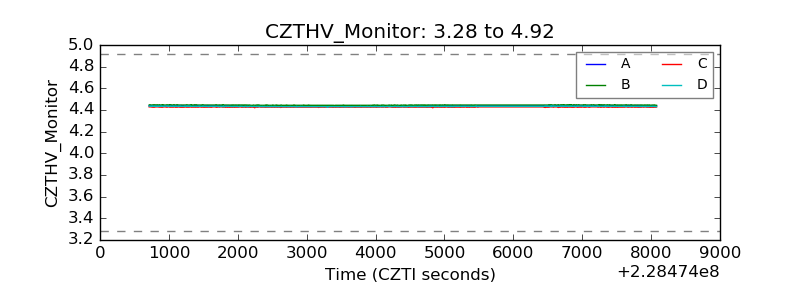 |
| D_VDD | 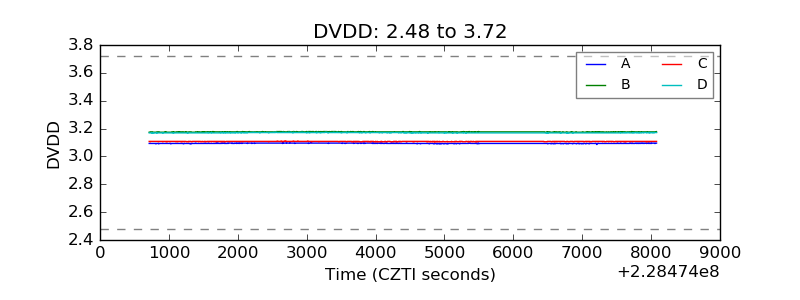 |
| Temperature 1 | 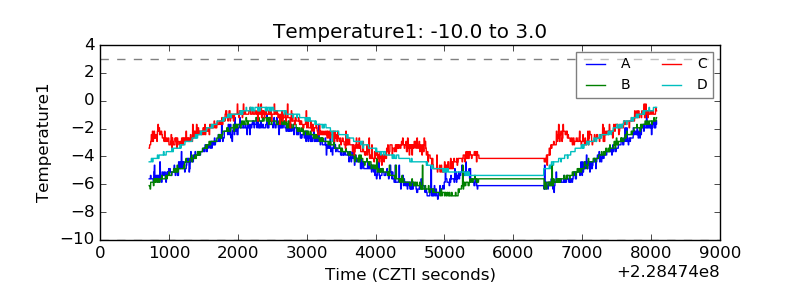 |
| Veto HV Monitor | 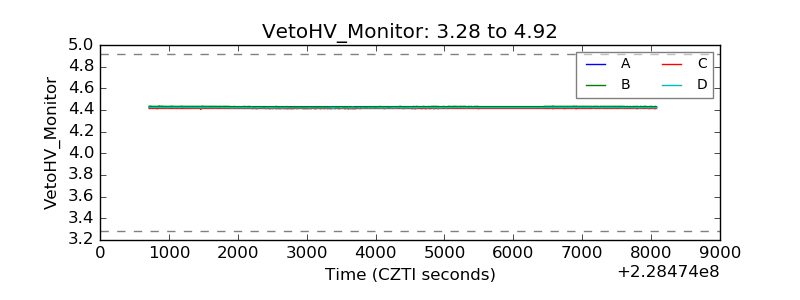 |
| Veto LLD | 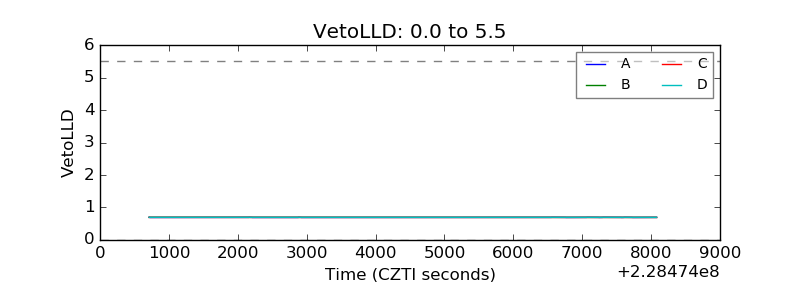 |
| Alpha Counter | 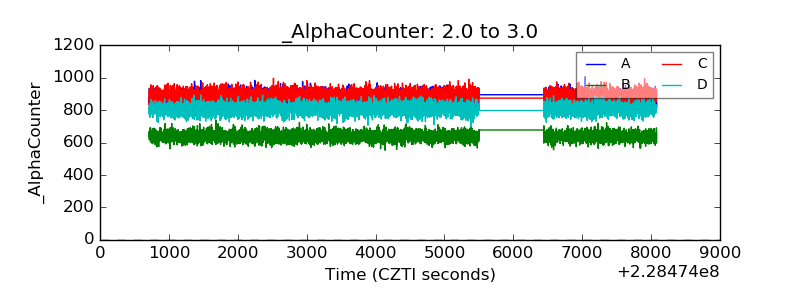 |
| _CPM_Rate | 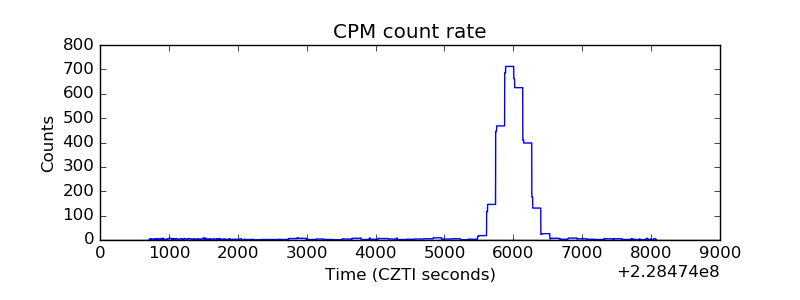 |
| CZT Counter | 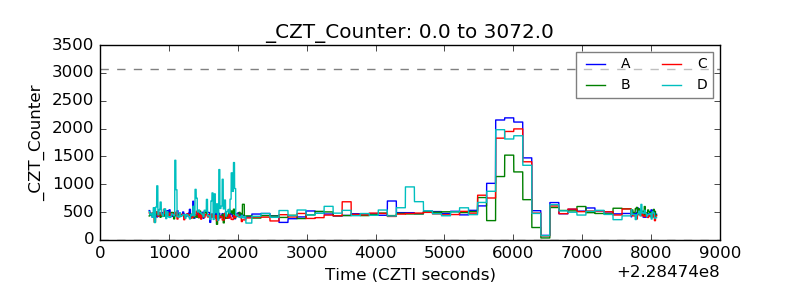 |
| +2.5 Volts monitor |  |
| +5 Volts monitor |  |
| _ROLL_ROT | 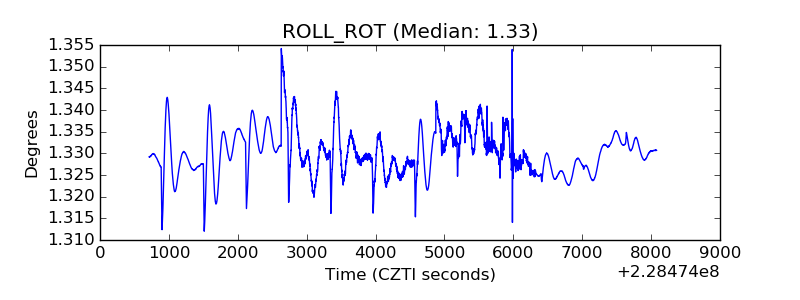 |
| _Roll_DEC | 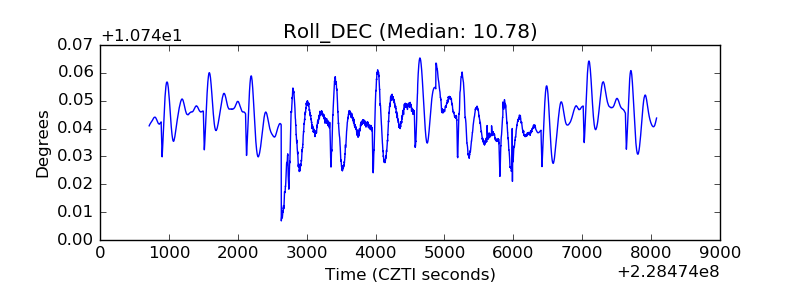 |
| _Roll_RA | 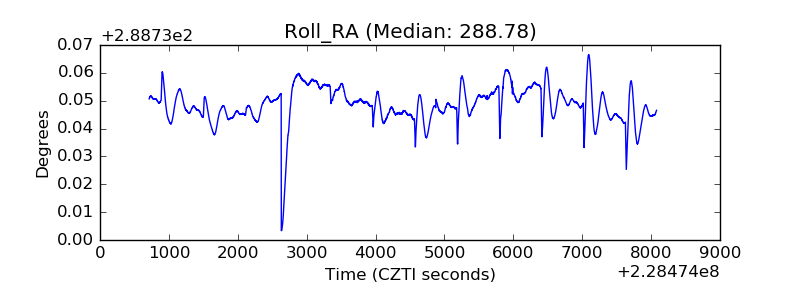 |
| Veto Counter | 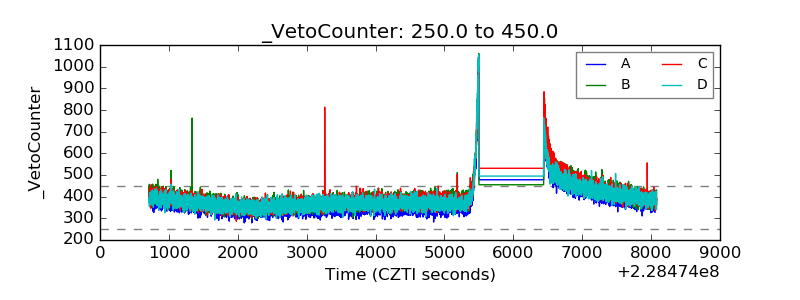 |