| Param | Original file | Final file |
|---|---|---|
| Filename | modeM0/AS1G06_033T01_9000001116_08119cztM0_level2.evt | modeM0/AS1G06_033T01_9000001116_08119cztM0_level2_quad_clean.evt |
| Size (bytes) | 467,605,440 | 64,200,960 |
| Size | 445.9 MB | 61.2 MB |
| Events in quadrant A | 3,346,857 | 374,729 |
| Events in quadrant B | 3,566,932 | 378,795 |
| Events in quadrant C | 3,355,034 | 379,627 |
| Events in quadrant D | 3,457,173 | 363,271 |
| Mode M9 | |||
|---|---|---|---|
| Quadrant | BADHDUFLAG | Total packets | Discarded packets |
| A | 0 | 13 | 0 |
| B | 0 | 13 | 0 |
| C | 0 | 13 | 0 |
| D | 0 | 13 | 0 |
| Mode SS | |||
|---|---|---|---|
| Quadrant | BADHDUFLAG | Total packets | Discarded packets |
| A | 0 | 130 | 0 |
| B | 0 | 130 | 0 |
| C | 0 | 130 | 0 |
| D | 0 | 130 | 0 |
| Mode M0 | |||
|---|---|---|---|
| Quadrant | BADHDUFLAG | Total packets | Discarded packets |
| A | 0 | 13893 | 3 |
| B | 0 | 14705 | 2 |
| C | 0 | 13787 | 2 |
| D | 0 | 14250 | 2 |
| Quadrant | Total seconds | Saturated seconds | Saturation percentage |
|---|---|---|---|
| A | 6412 | 63 | 0.982533% |
| B | 6412 | 73 | 1.138490% |
| C | 6412 | 54 | 0.842171% |
| D | 6413 | 57 | 0.888820% |
Noise dominated data is calculated using 1-second bins in cleaned event files. If a bin has >2000 counts, and if more than 50% of those come from <1% of pixels, then it is considered to be noise-dominated and hence unusable.
| Quadrant | # 1 sec bins | Bins with >0 counts | Bins with >2000 counts | High rate bins dominated by noise | Noise dominated (total time) | Noise dominated (detector-on time) | Marked lightcurve |
|---|---|---|---|---|---|---|---|
| A | 7707 | 6413 | 0 | 0 | 0.00% | 0.00% | 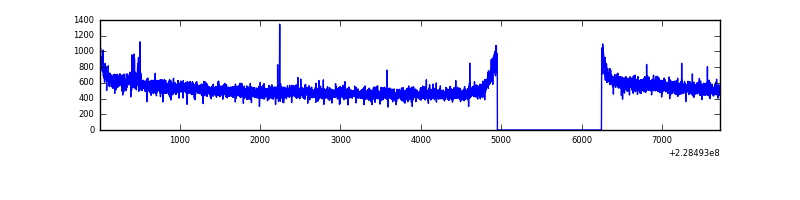 |
| B | 7707 | 6413 | 12 | 12 | 0.16% | 0.19% |  |
| C | 7707 | 6413 | 13 | 13 | 0.17% | 0.20% | 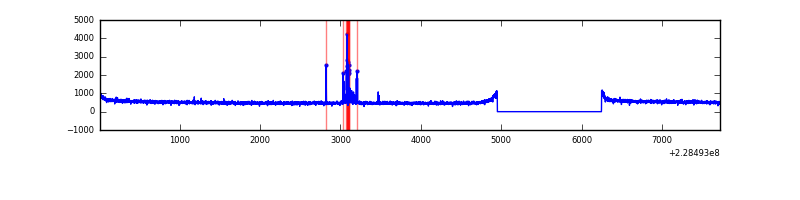 |
| D | 7708 | 6414 | 8 | 8 | 0.10% | 0.12% | 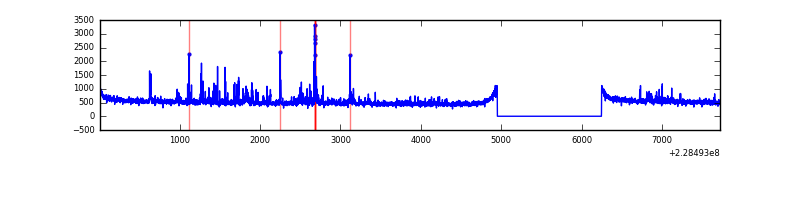 |
Top three noisy pixels from each quadrant. If the there are fewer than three noisy pixels in the level2.evt file, extra rows are filled as -1
| Pixel properties | Quadrant properties | ||||||
|---|---|---|---|---|---|---|---|
| Quadrant | DetID | PixID | Counts | Sigma | Mean | Median | Sigma |
| A | 8 | 15 | 23375 | 130.94 | 861 | 846 | 172.1 |
| A | 0 | 226 | 8203 | 42.76 | 861 | 846 | 172.1 |
| A | 12 | 194 | 7856 | 40.74 | 861 | 846 | 172.1 |
| B | 0 | 214 | 125913 | 773.9 | 860 | 845 | 161.6 |
| B | 10 | 16 | 55789 | 339.98 | 860 | 845 | 161.6 |
| B | 0 | 219 | 18739 | 110.73 | 860 | 845 | 161.6 |
| C | 12 | 4 | 79069 | 405.02 | 839 | 845 | 193.1 |
| C | 13 | 61 | 6373 | 28.62 | 839 | 845 | 193.1 |
| C | 1 | 16 | 5684 | 25.06 | 839 | 845 | 193.1 |
| D | 5 | 233 | 128008 | 624.1 | 842 | 819 | 203.8 |
| D | 12 | 233 | 29934 | 142.86 | 842 | 819 | 203.8 |
| D | 2 | 152 | 28454 | 135.6 | 842 | 819 | 203.8 |
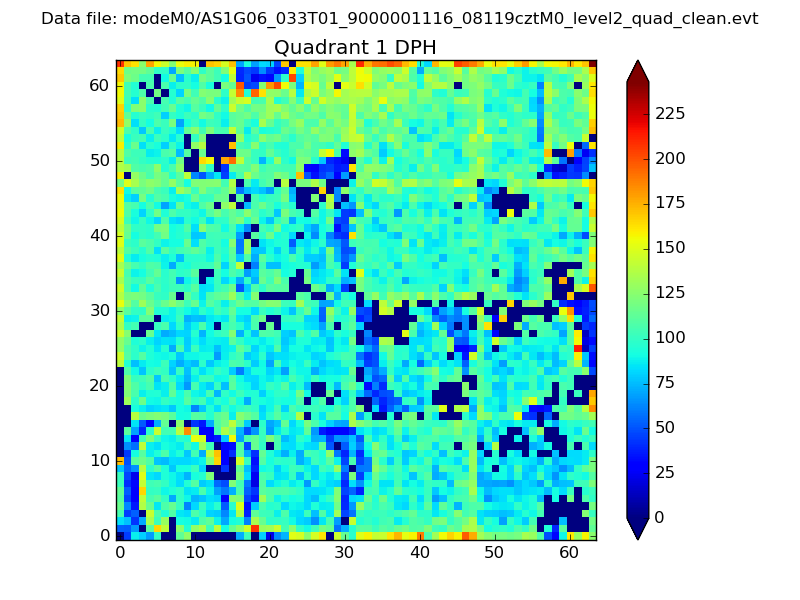
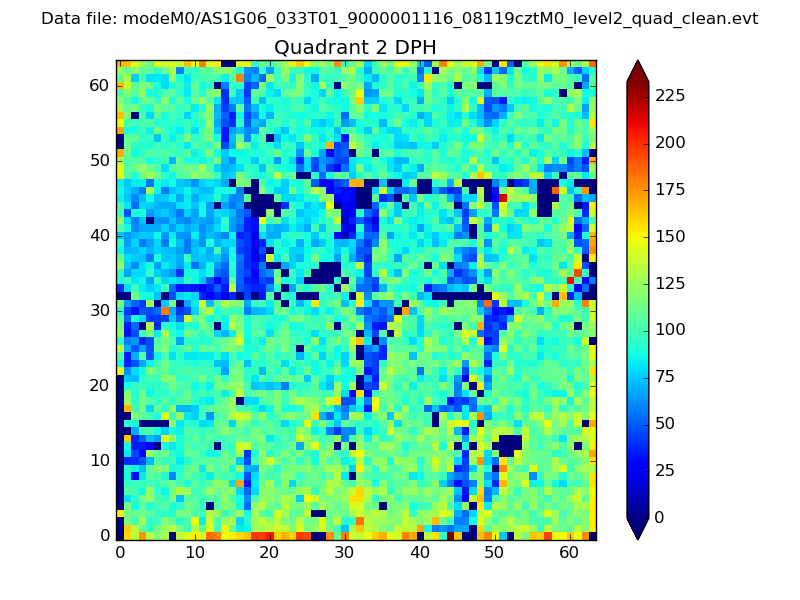
Histogram calculated using DETX and DETY for each event in the final _common_clean file
| Quadrant A | 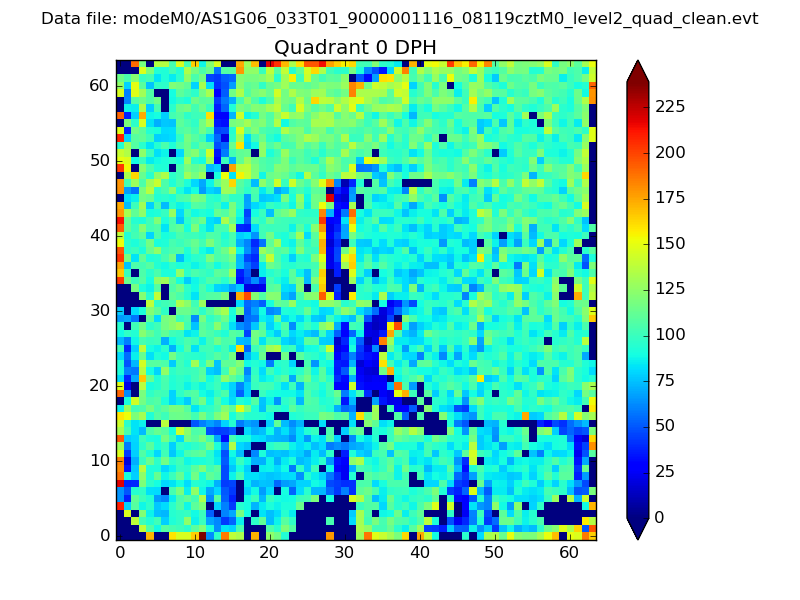 |
 |
Quadrant B |
|---|---|---|---|
| Quadrant D | 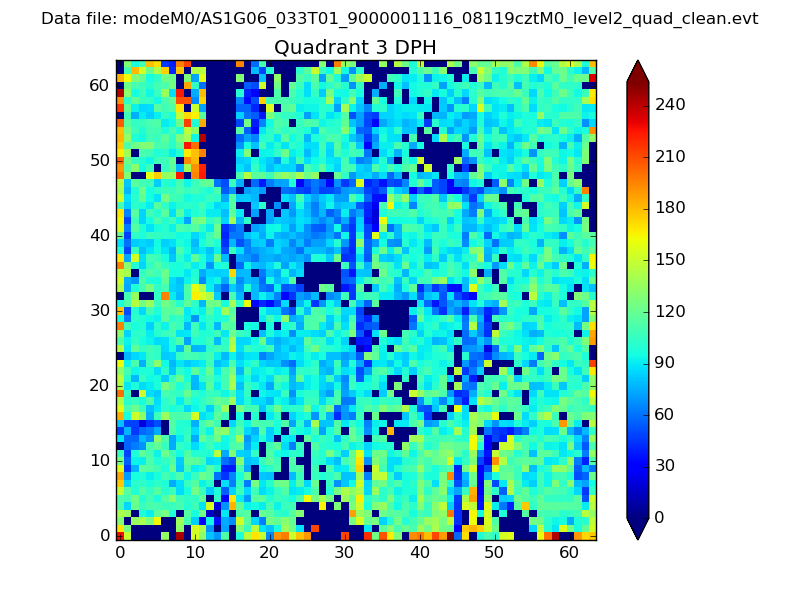 |
 |
Quadrant C |
| Plot type | Count rate plots | Images |
|---|---|---|
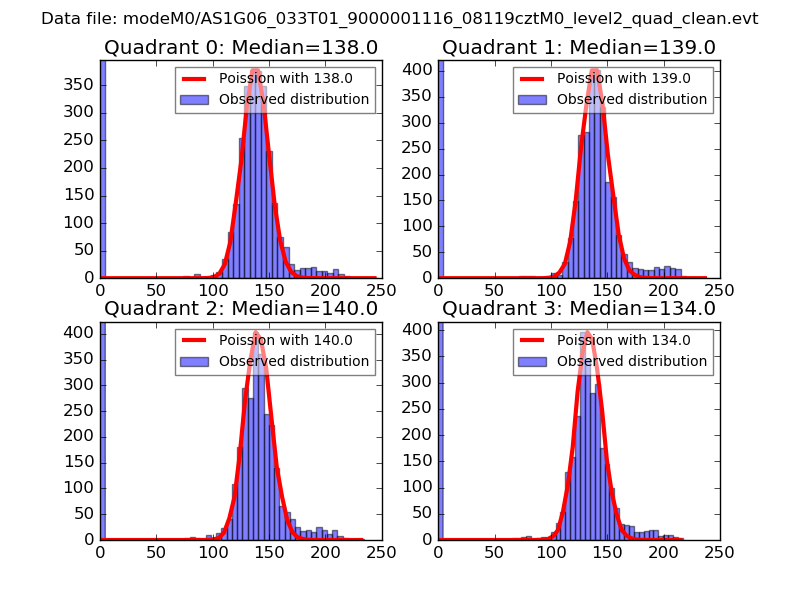
| Comparison with Poisson distribution Blue bars denote a histogram of data divided into 1 sec bins. Red curve is a Poisson curve with rate = median count rate of data. |
 |
 |
| Quadrant-wise count rates Data is divided into 100 sec bins |
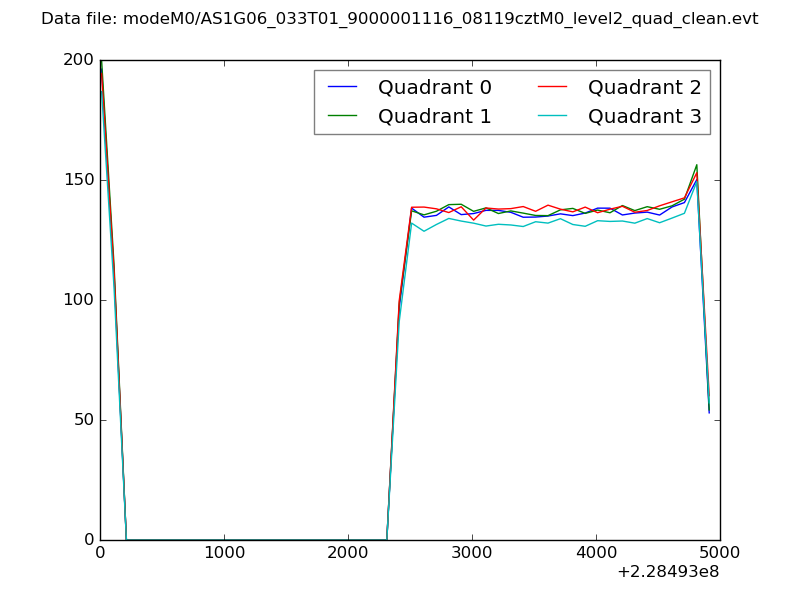 |
|
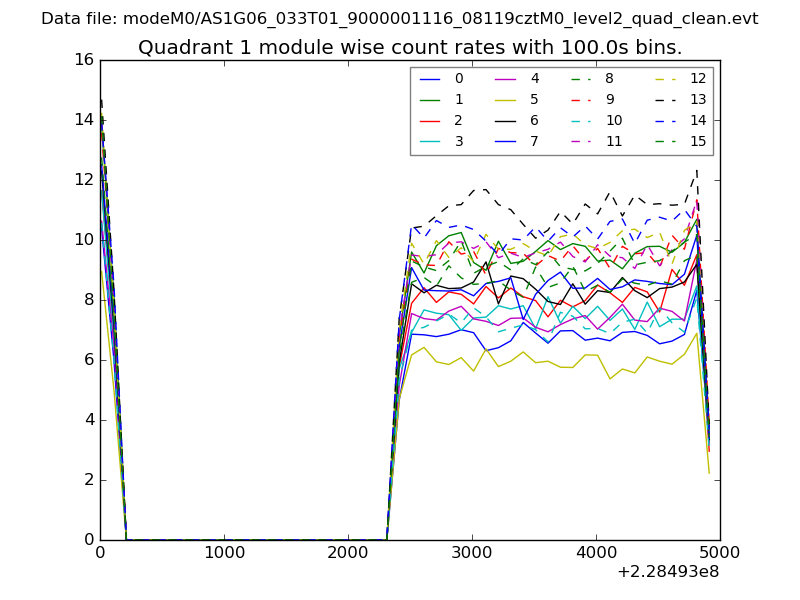
| Module-wise count rates for Quadrant A Data is divided into 100 sec bins |
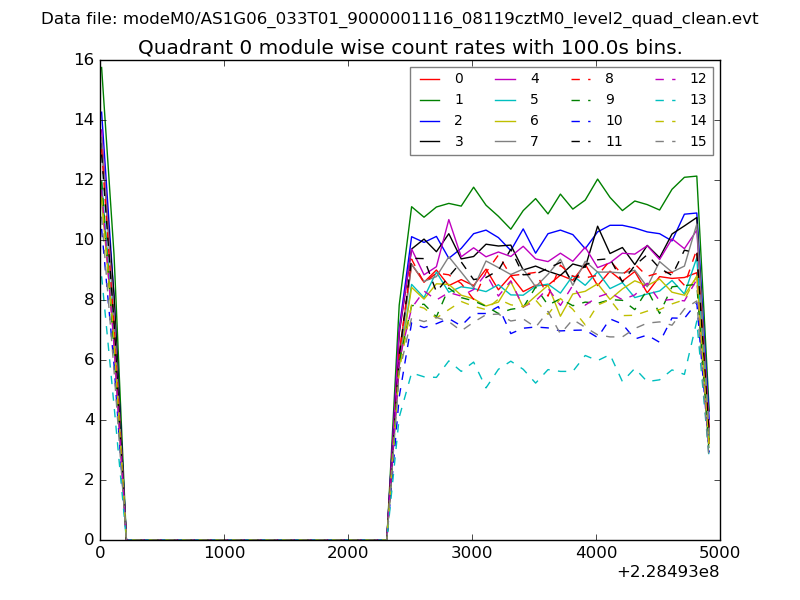 |
 |
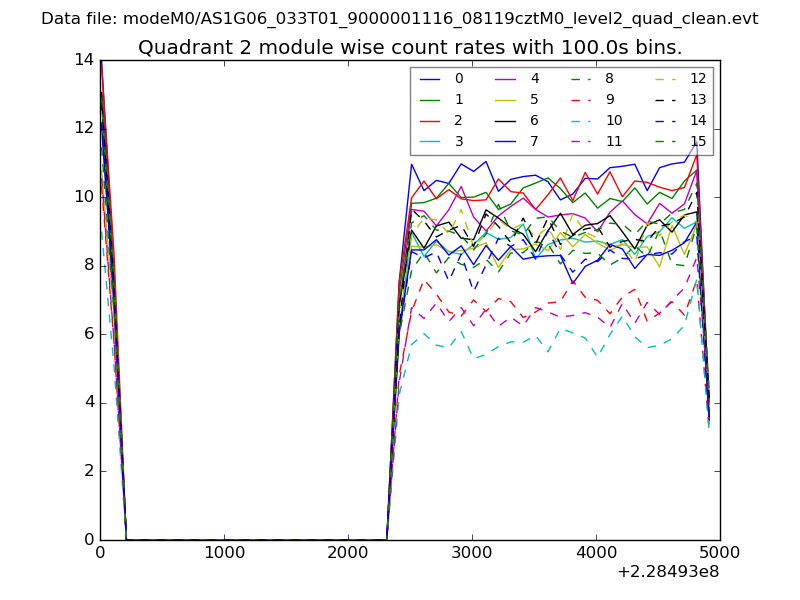
| Module-wise count rates for Quadrant B Data is divided into 100 sec bins |
 |
 |
| Module-wise count rates for Quadrant C Data is divided into 100 sec bins |
 |
 |
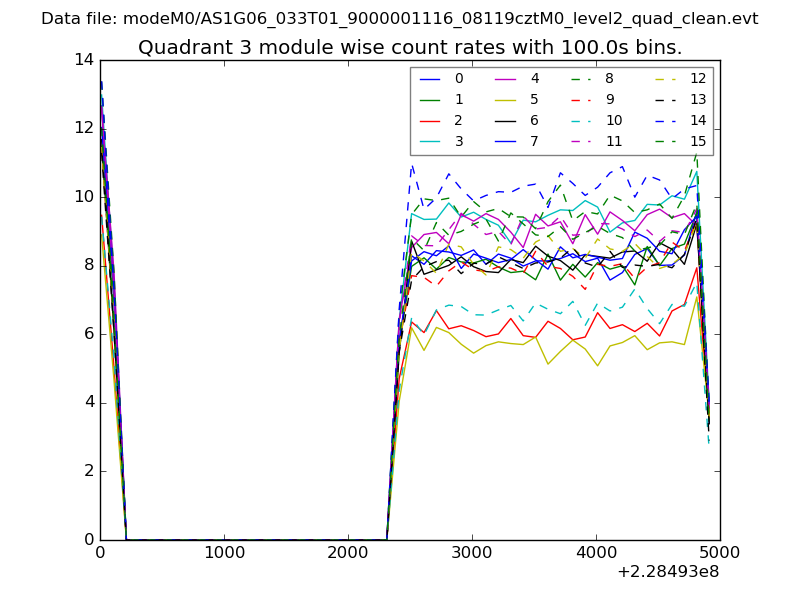
| Module-wise count rates for Quadrant D Data is divided into 100 sec bins |
 |
 |
| Parameter | Plot |
|---|---|
| CZT HV Monitor | 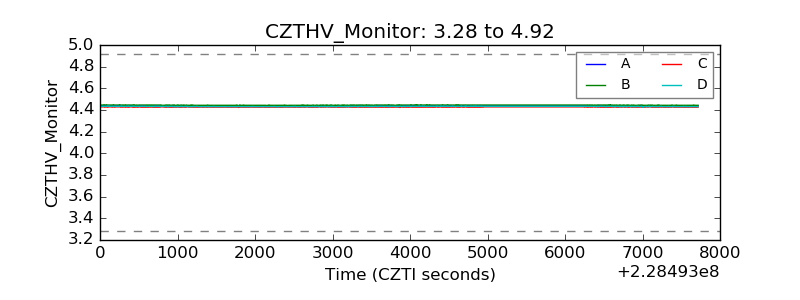 |
| D_VDD | 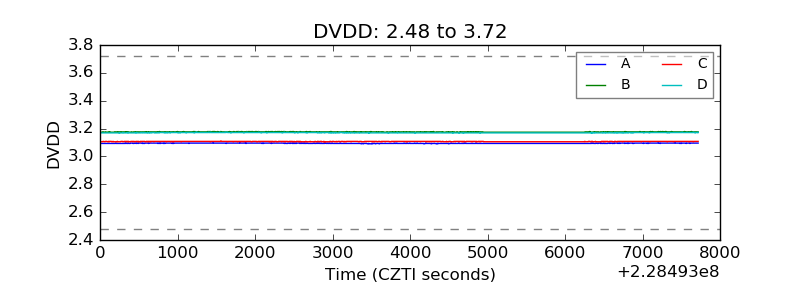 |
| Temperature 1 |  |
| Veto HV Monitor | 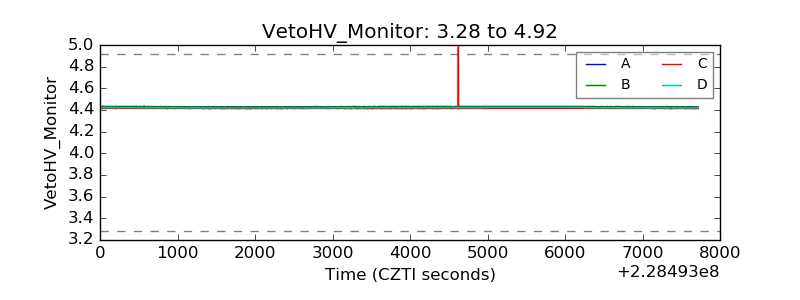 |
| Veto LLD | 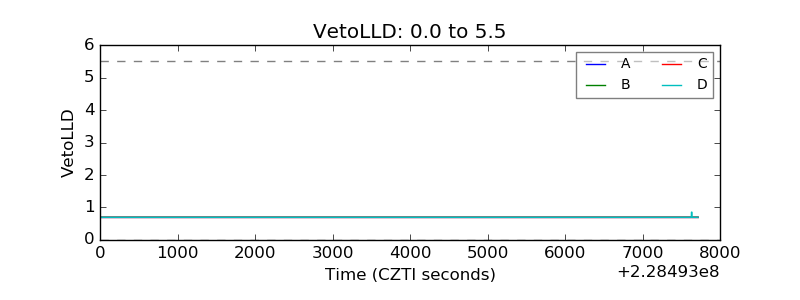 |
| Alpha Counter | 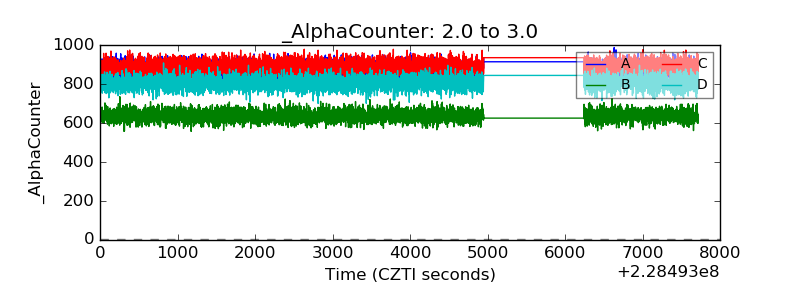 |
| _CPM_Rate | 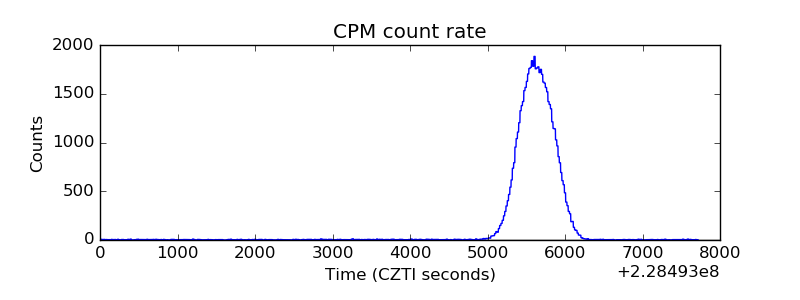 |
| CZT Counter | 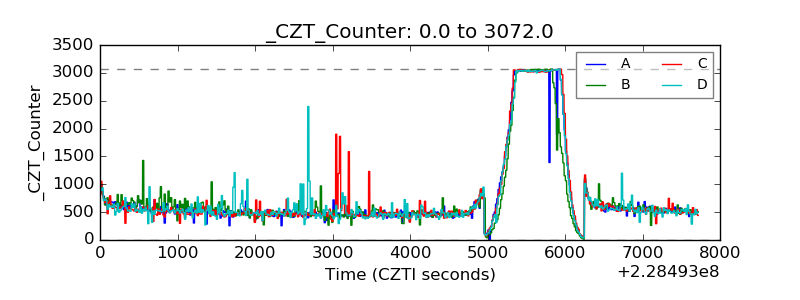 |
| +2.5 Volts monitor |  |
| +5 Volts monitor |  |
| _ROLL_ROT | 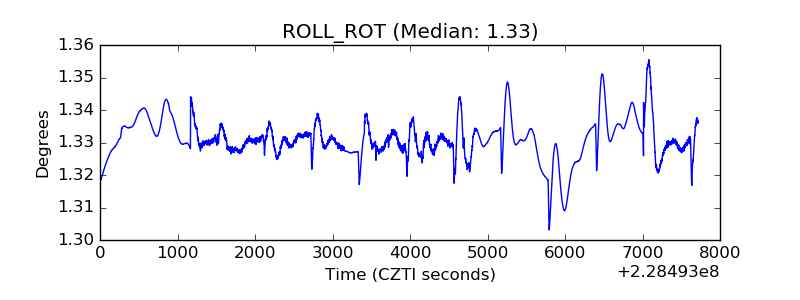 |
| _Roll_DEC | 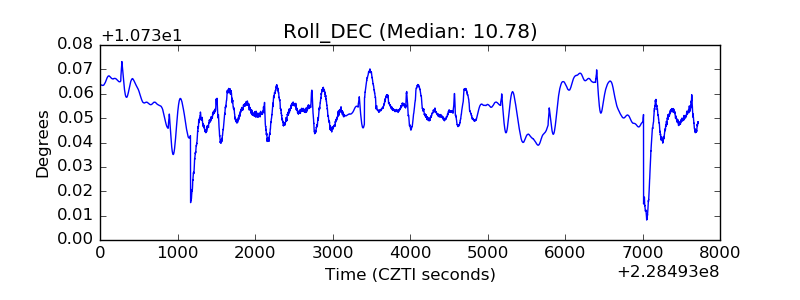 |
| _Roll_RA | 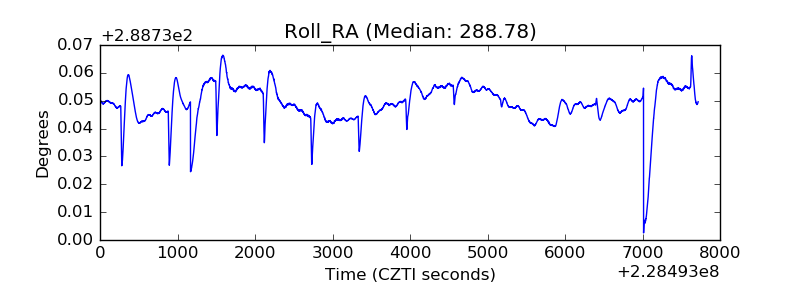 |
| Veto Counter | 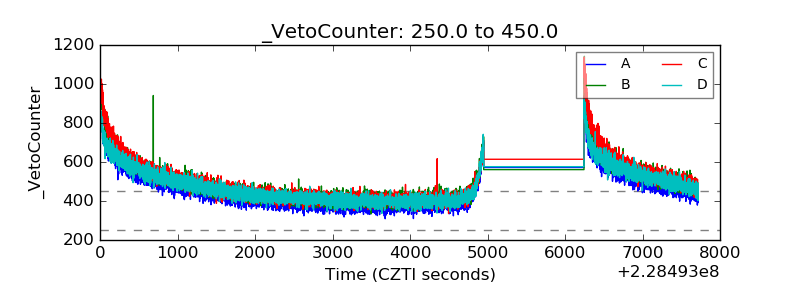 |