| Param | Original file | Final file |
|---|---|---|
| Filename | modeM0/AS1G06_033T01_9000001116_08120cztM0_level2.evt | modeM0/AS1G06_033T01_9000001116_08120cztM0_level2_quad_clean.evt |
| Size (bytes) | 456,952,320 | 67,633,920 |
| Size | 435.8 MB | 64.5 MB |
| Events in quadrant A | 3,282,506 | 403,061 |
| Events in quadrant B | 3,400,377 | 406,137 |
| Events in quadrant C | 3,239,450 | 410,417 |
| Events in quadrant D | 3,488,674 | 388,846 |
| Mode M9 | |||
|---|---|---|---|
| Quadrant | BADHDUFLAG | Total packets | Discarded packets |
| A | 0 | 16 | 0 |
| B | 0 | 16 | 0 |
| C | 0 | 16 | 0 |
| D | 0 | 17 | 0 |
| Mode SS | |||
|---|---|---|---|
| Quadrant | BADHDUFLAG | Total packets | Discarded packets |
| A | 0 | 128 | 0 |
| B | 0 | 128 | 0 |
| C | 0 | 128 | 0 |
| D | 0 | 128 | 0 |
| Mode M0 | |||
|---|---|---|---|
| Quadrant | BADHDUFLAG | Total packets | Discarded packets |
| A | 0 | 13629 | 3 |
| B | 0 | 13943 | 2 |
| C | 0 | 13416 | 2 |
| D | 0 | 14408 | 2 |
| Quadrant | Total seconds | Saturated seconds | Saturation percentage |
|---|---|---|---|
| A | 6294 | 122 | 1.938354% |
| B | 6294 | 121 | 1.922466% |
| C | 6294 | 89 | 1.414045% |
| D | 6294 | 139 | 2.208452% |
Noise dominated data is calculated using 1-second bins in cleaned event files. If a bin has >2000 counts, and if more than 50% of those come from <1% of pixels, then it is considered to be noise-dominated and hence unusable.
| Quadrant | # 1 sec bins | Bins with >0 counts | Bins with >2000 counts | High rate bins dominated by noise | Noise dominated (total time) | Noise dominated (detector-on time) | Marked lightcurve |
|---|---|---|---|---|---|---|---|
| A | 7579 | 6294 | 3 | 3 | 0.04% | 0.05% | 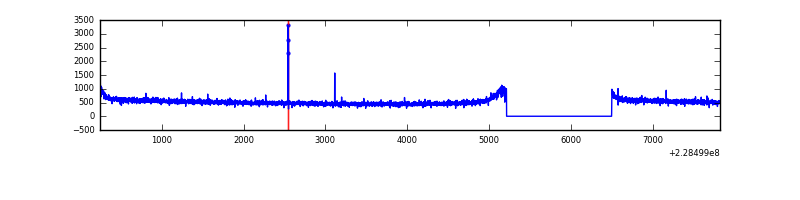 |
| B | 7579 | 6294 | 10 | 10 | 0.13% | 0.16% | 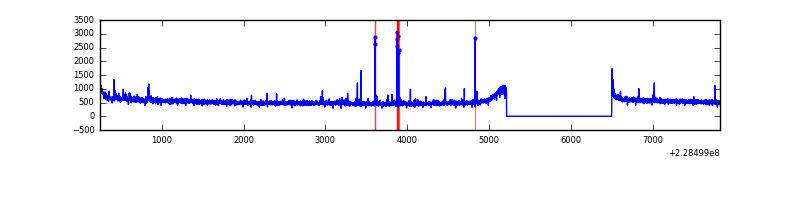 |
| C | 7579 | 6294 | 0 | 0 | 0.00% | 0.00% |  |
| D | 7579 | 6295 | 38 | 38 | 0.50% | 0.60% |  |
Top three noisy pixels from each quadrant. If the there are fewer than three noisy pixels in the level2.evt file, extra rows are filled as -1
| Pixel properties | Quadrant properties | ||||||
|---|---|---|---|---|---|---|---|
| Quadrant | DetID | PixID | Counts | Sigma | Mean | Median | Sigma |
| A | 12 | 112 | 9496 | 50.46 | 846 | 832 | 171.7 |
| A | 0 | 226 | 8070 | 42.15 | 846 | 832 | 171.7 |
| A | 12 | 194 | 7874 | 41.01 | 846 | 832 | 171.7 |
| B | 10 | 16 | 53324 | 324.08 | 849 | 832 | 162.0 |
| B | 0 | 219 | 19513 | 115.33 | 849 | 832 | 162.0 |
| B | 0 | 214 | 19324 | 114.17 | 849 | 832 | 162.0 |
| C | 13 | 61 | 6505 | 29.67 | 829 | 837 | 191.0 |
| C | 1 | 16 | 5728 | 25.6 | 829 | 837 | 191.0 |
| C | 14 | 67 | 2114 | 6.68 | 829 | 837 | 191.0 |
| D | 2 | 152 | 90915 | 445.0 | 829 | 806 | 202.5 |
| D | 13 | 105 | 77863 | 380.55 | 829 | 806 | 202.5 |
| D | 5 | 233 | 52101 | 253.32 | 829 | 806 | 202.5 |
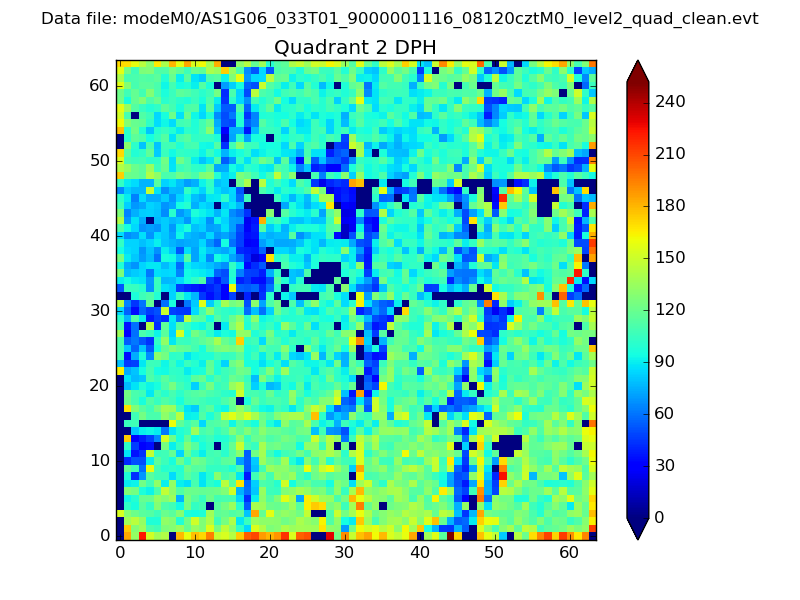
Histogram calculated using DETX and DETY for each event in the final _common_clean file
| Quadrant A | 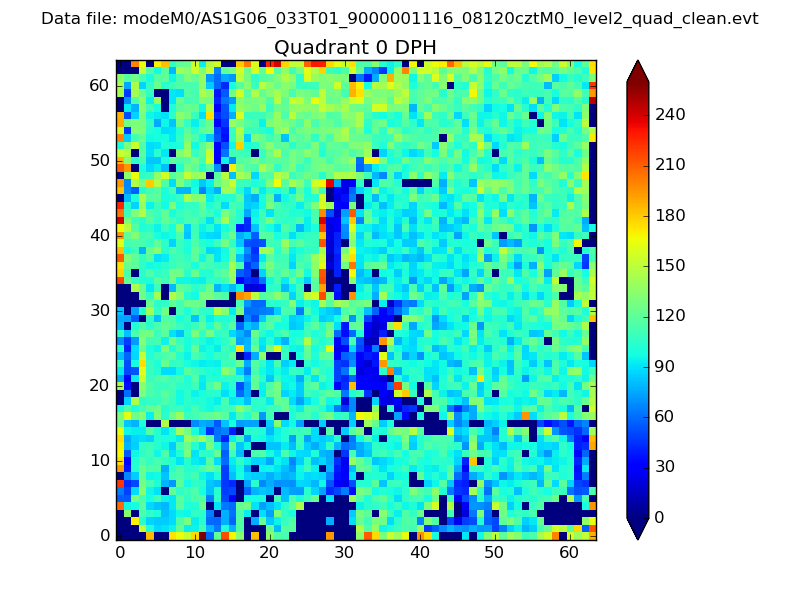 |
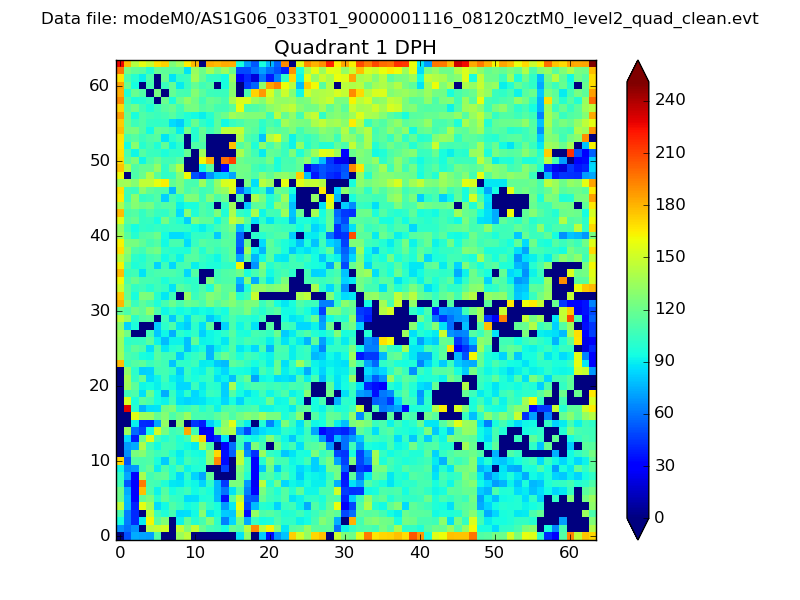 |
Quadrant B |
|---|---|---|---|
| Quadrant D | 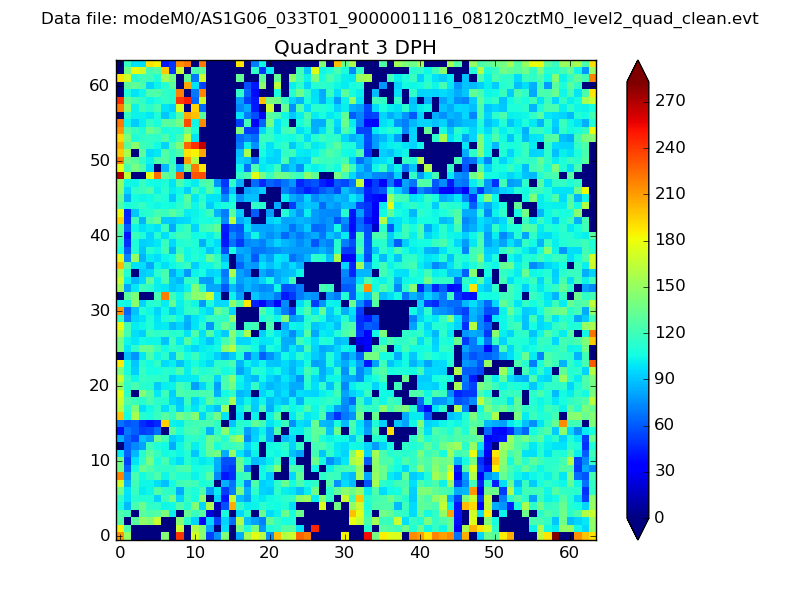 |
 |
Quadrant C |
| Plot type | Count rate plots | Images |
|---|---|---|
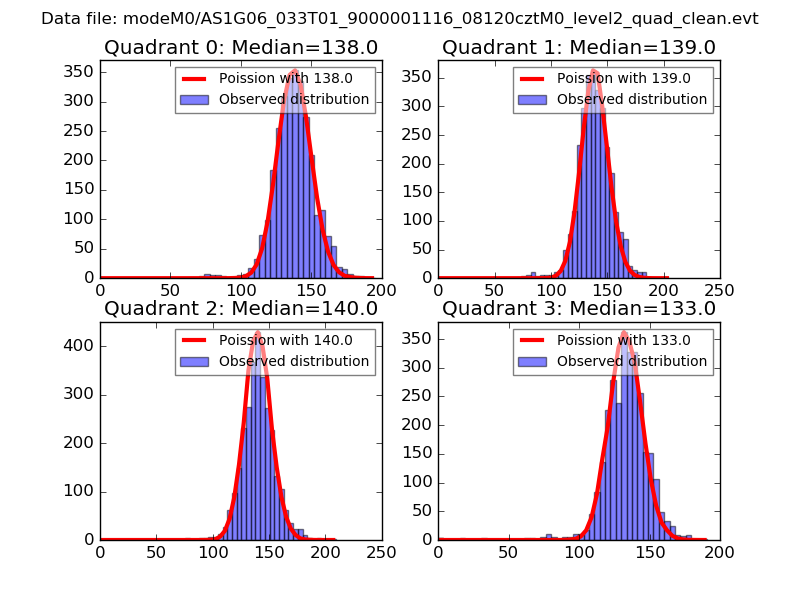
| Comparison with Poisson distribution Blue bars denote a histogram of data divided into 1 sec bins. Red curve is a Poisson curve with rate = median count rate of data. |
 |
 |
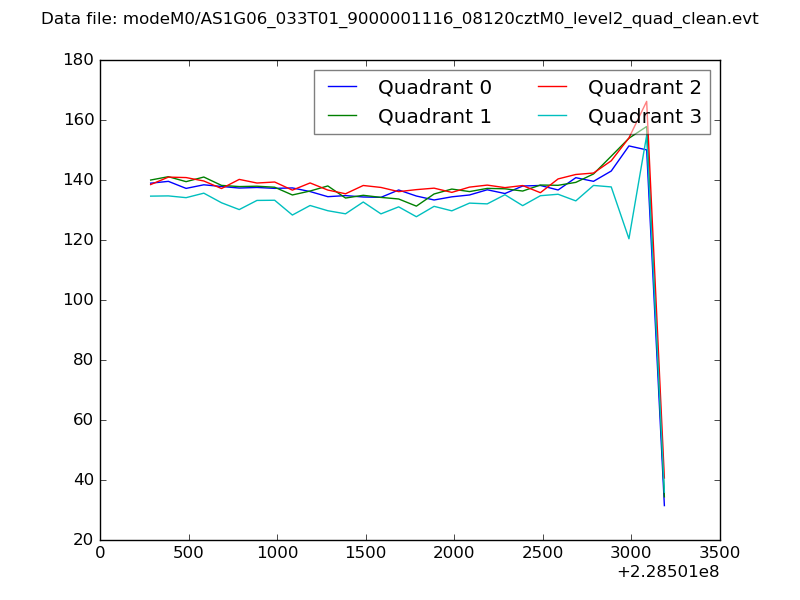
| Quadrant-wise count rates Data is divided into 100 sec bins |
 |
|
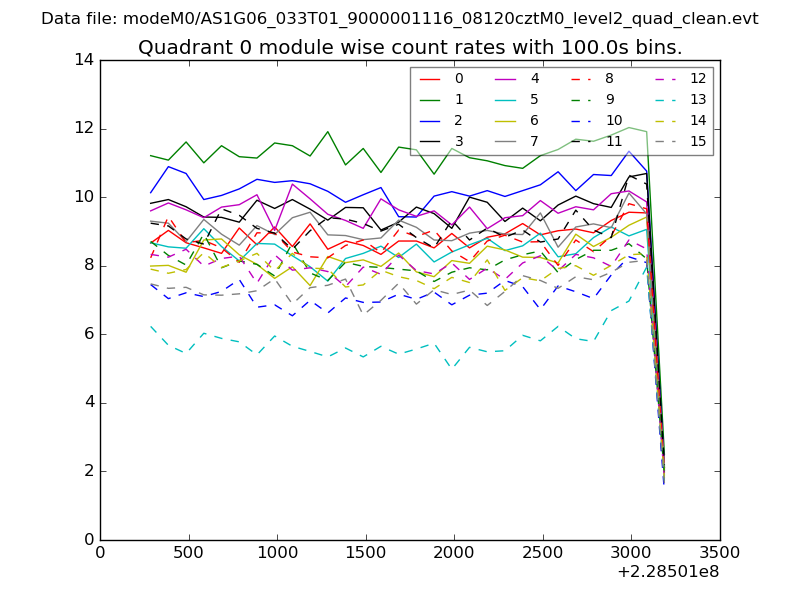
| Module-wise count rates for Quadrant A Data is divided into 100 sec bins |
 |
 |
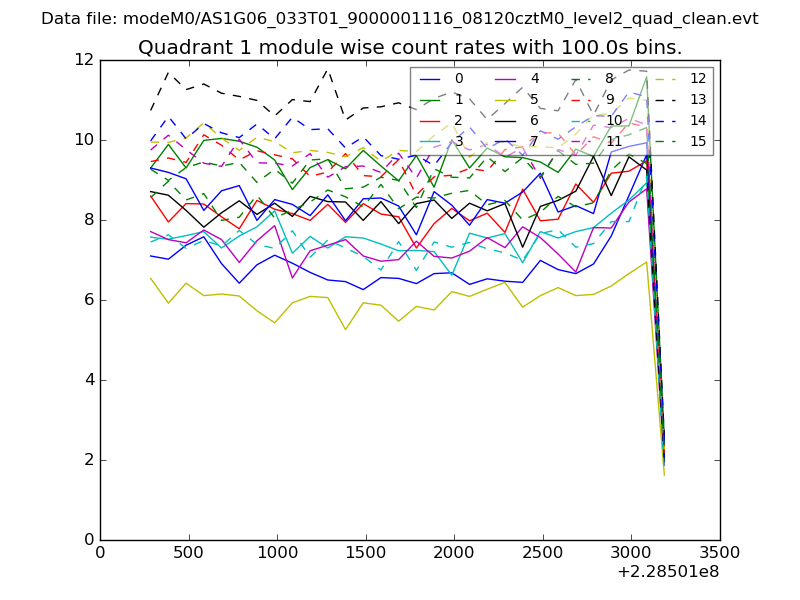
| Module-wise count rates for Quadrant B Data is divided into 100 sec bins |
 |
 |
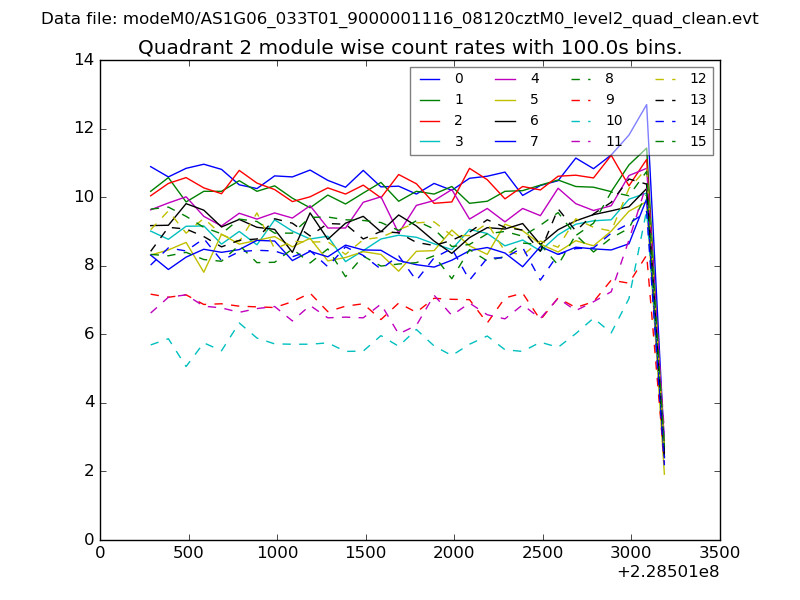
| Module-wise count rates for Quadrant C Data is divided into 100 sec bins |
 |
 |
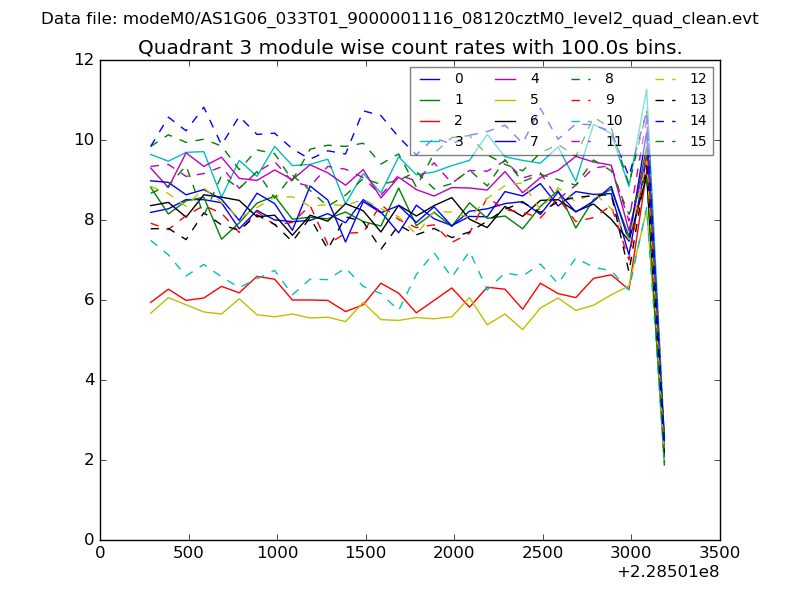
| Module-wise count rates for Quadrant D Data is divided into 100 sec bins |
 |
 |
| Parameter | Plot |
|---|---|
| CZT HV Monitor | 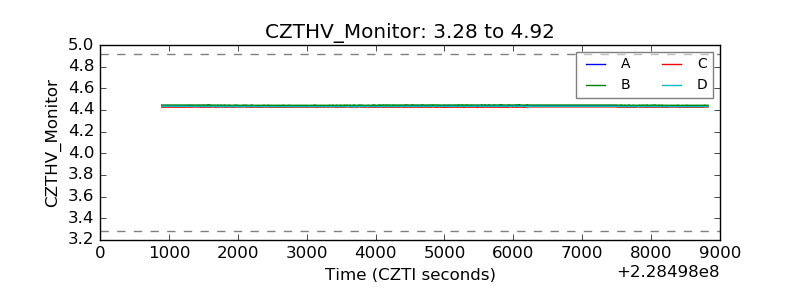 |
| D_VDD | 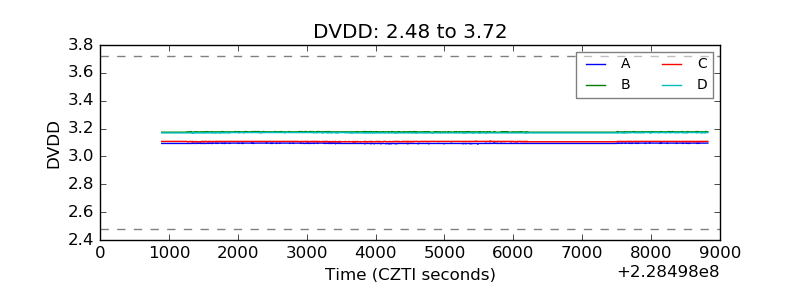 |
| Temperature 1 | 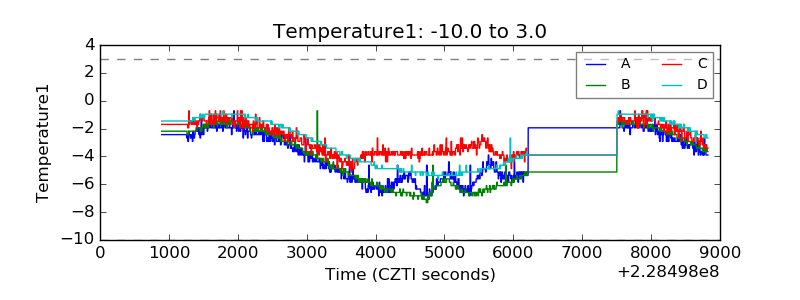 |
| Veto HV Monitor | 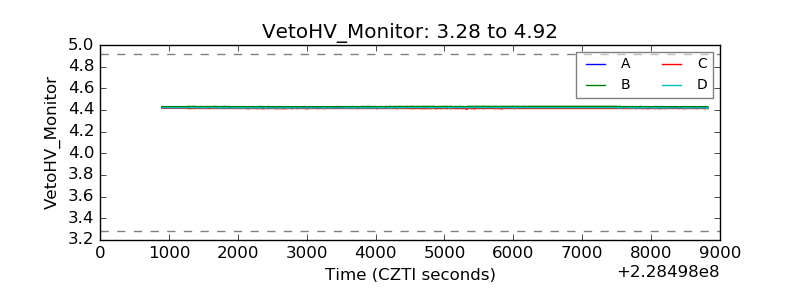 |
| Veto LLD | 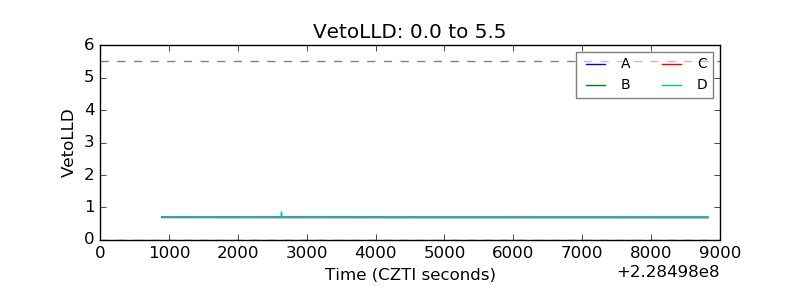 |
| Alpha Counter | 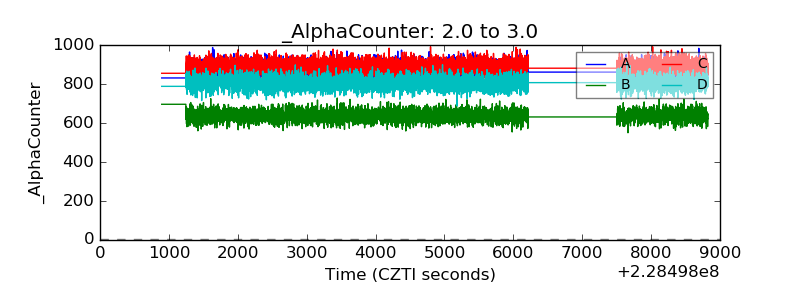 |
| _CPM_Rate | 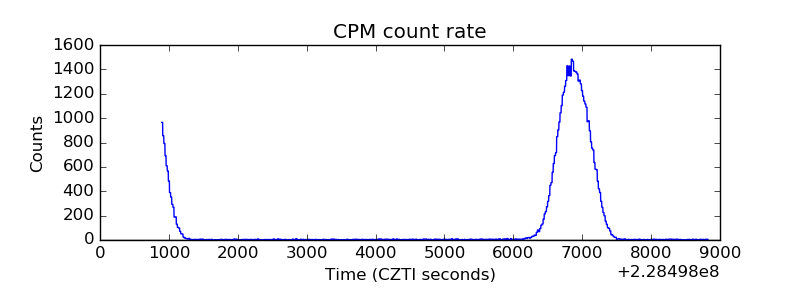 |
| CZT Counter |  |
| +2.5 Volts monitor |  |
| +5 Volts monitor |  |
| _ROLL_ROT | 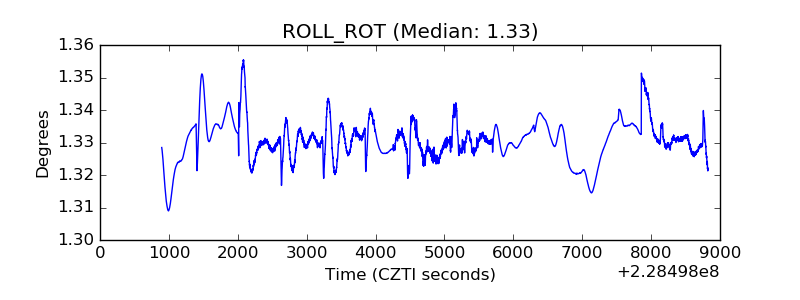 |
| _Roll_DEC | 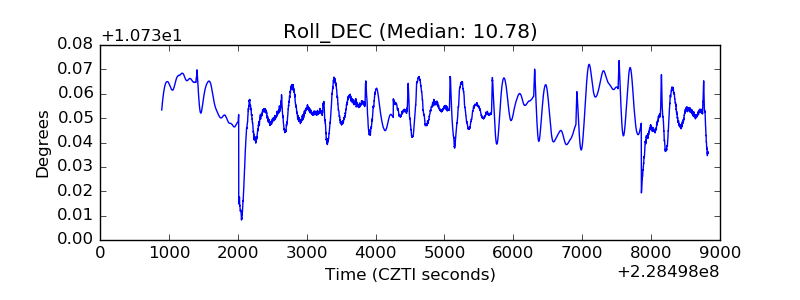 |
| _Roll_RA | 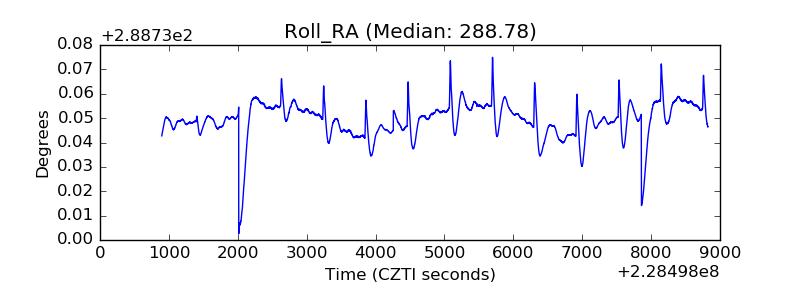 |
| Veto Counter | 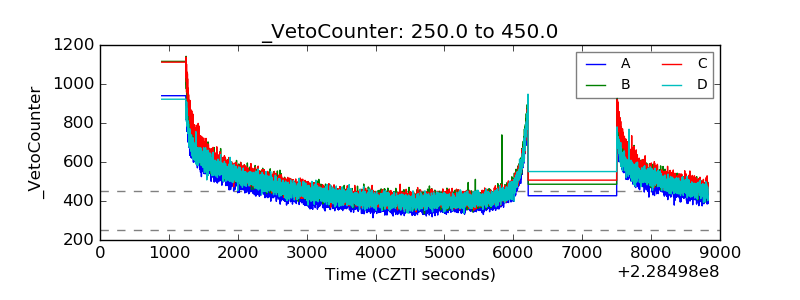 |