| Param | Original file | Final file |
|---|---|---|
| Filename | modeM0/AS1G06_033T01_9000001116_08121cztM0_level2.evt | modeM0/AS1G06_033T01_9000001116_08121cztM0_level2_quad_clean.evt |
| Size (bytes) | 463,098,240 | 77,731,200 |
| Size | 441.6 MB | 74.1 MB |
| Events in quadrant A | 3,437,310 | 476,371 |
| Events in quadrant B | 3,344,273 | 481,874 |
| Events in quadrant C | 3,210,636 | 486,214 |
| Events in quadrant D | 3,597,248 | 462,005 |
| Mode M9 | |||
|---|---|---|---|
| Quadrant | BADHDUFLAG | Total packets | Discarded packets |
| A | 0 | 20 | 0 |
| B | 0 | 20 | 0 |
| C | 0 | 20 | 0 |
| D | 0 | 21 | 0 |
| Mode SS | |||
|---|---|---|---|
| Quadrant | BADHDUFLAG | Total packets | Discarded packets |
| A | 0 | 130 | 0 |
| B | 0 | 130 | 0 |
| C | 0 | 130 | 0 |
| D | 0 | 130 | 0 |
| Mode M0 | |||
|---|---|---|---|
| Quadrant | BADHDUFLAG | Total packets | Discarded packets |
| A | 0 | 14305 | 3 |
| B | 0 | 13857 | 2 |
| C | 0 | 13519 | 2 |
| D | 0 | 14967 | 2 |
| Quadrant | Total seconds | Saturated seconds | Saturation percentage |
|---|---|---|---|
| A | 6411 | 128 | 1.996568% |
| B | 6411 | 115 | 1.793792% |
| C | 6411 | 64 | 0.998284% |
| D | 6411 | 129 | 2.012167% |
Noise dominated data is calculated using 1-second bins in cleaned event files. If a bin has >2000 counts, and if more than 50% of those come from <1% of pixels, then it is considered to be noise-dominated and hence unusable.
| Quadrant | # 1 sec bins | Bins with >0 counts | Bins with >2000 counts | High rate bins dominated by noise | Noise dominated (total time) | Noise dominated (detector-on time) | Marked lightcurve |
|---|---|---|---|---|---|---|---|
| A | 7606 | 6412 | 0 | 0 | 0.00% | 0.00% | 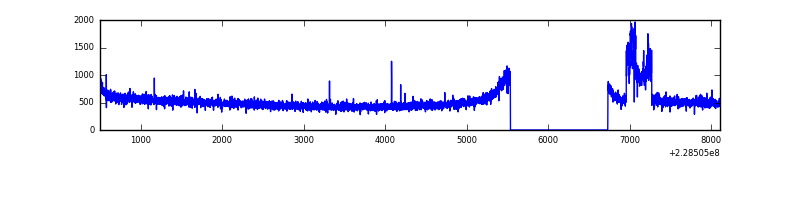 |
| B | 7606 | 6412 | 2 | 2 | 0.03% | 0.03% | 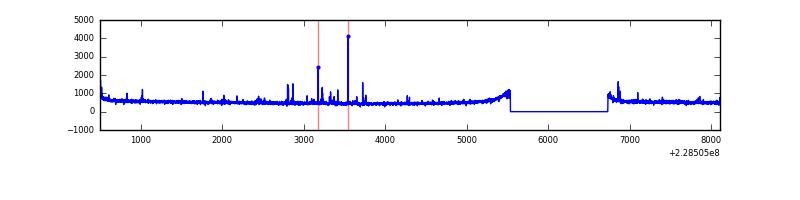 |
| C | 7606 | 6411 | 0 | 0 | 0.00% | 0.00% | 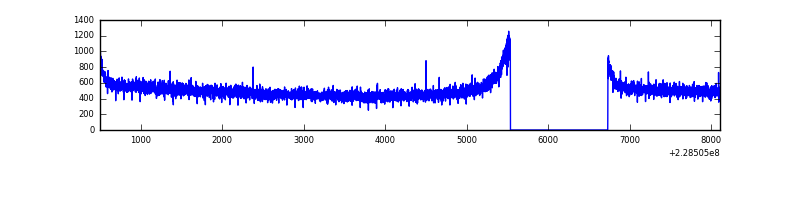 |
| D | 7606 | 6412 | 45 | 45 | 0.59% | 0.70% | 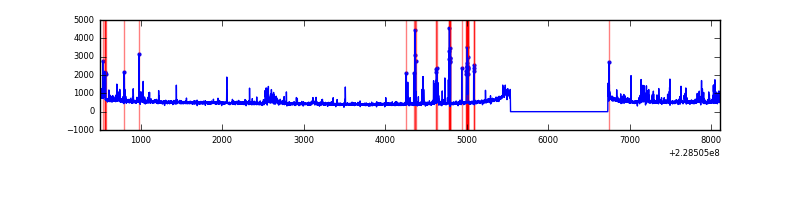 |
Top three noisy pixels from each quadrant. If the there are fewer than three noisy pixels in the level2.evt file, extra rows are filled as -1
| Pixel properties | Quadrant properties | ||||||
|---|---|---|---|---|---|---|---|
| Quadrant | DetID | PixID | Counts | Sigma | Mean | Median | Sigma |
| A | 15 | 79 | 216273 | 1269.29 | 832 | 815 | 169.7 |
| A | 8 | 15 | 8391 | 44.63 | 832 | 815 | 169.7 |
| A | 0 | 226 | 7795 | 41.12 | 832 | 815 | 169.7 |
| B | 0 | 219 | 32294 | 197.48 | 839 | 823 | 159.4 |
| B | 10 | 16 | 22019 | 133.0 | 839 | 823 | 159.4 |
| B | 5 | 255 | 19853 | 119.41 | 839 | 823 | 159.4 |
| C | 13 | 61 | 6286 | 28.88 | 821 | 829 | 189.0 |
| C | 1 | 16 | 6271 | 28.8 | 821 | 829 | 189.0 |
| C | 14 | 67 | 2258 | 7.56 | 821 | 829 | 189.0 |
| D | 2 | 152 | 190328 | 941.22 | 819 | 797 | 201.4 |
| D | 1 | 52 | 135108 | 666.99 | 819 | 797 | 201.4 |
| D | 12 | 233 | 78068 | 383.73 | 819 | 797 | 201.4 |
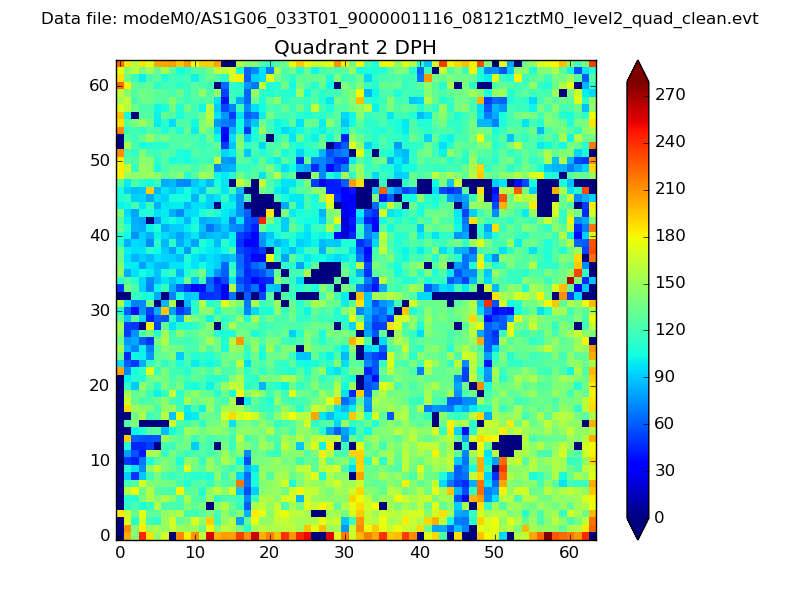
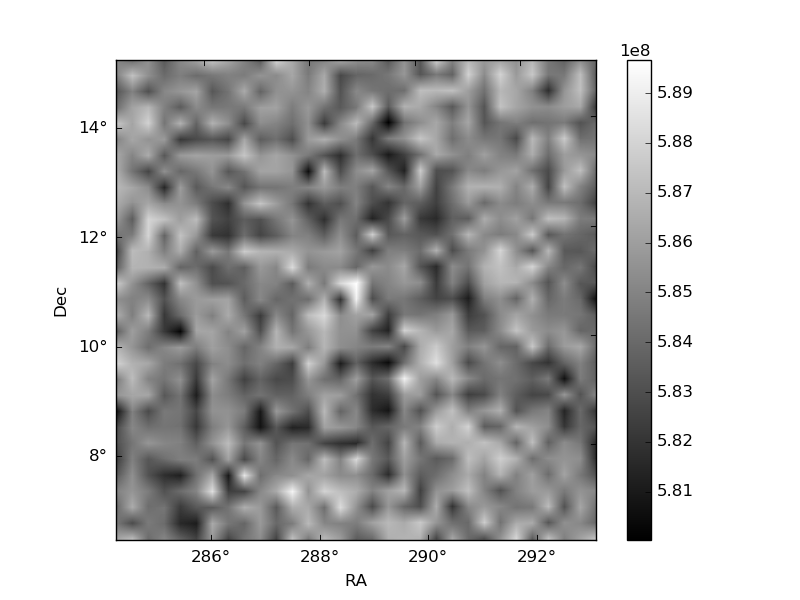
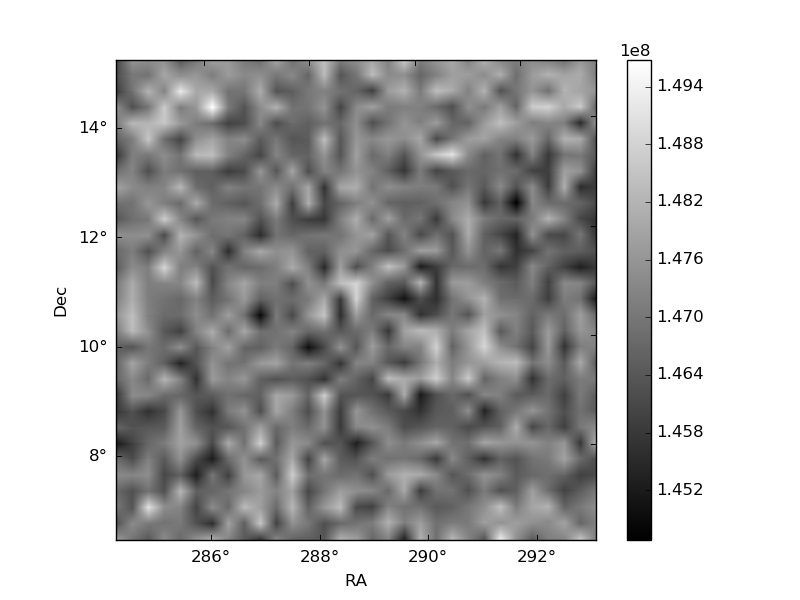
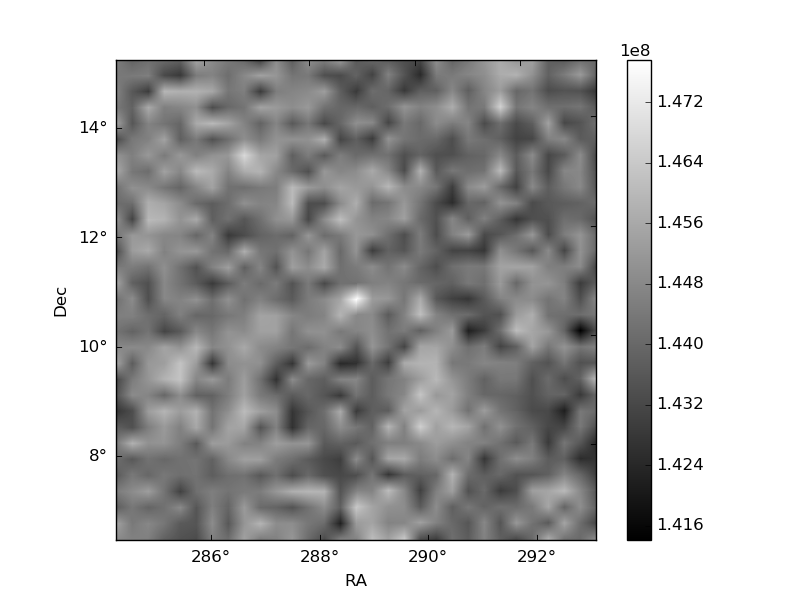
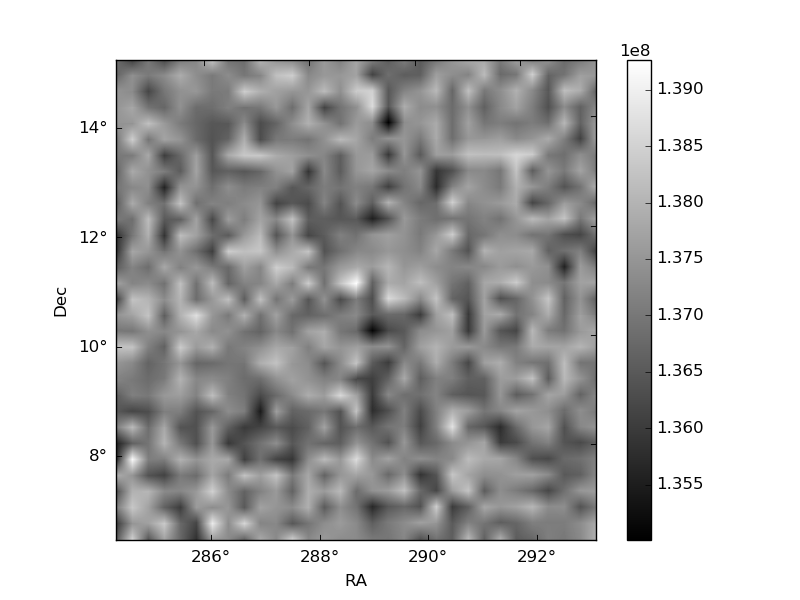
Histogram calculated using DETX and DETY for each event in the final _common_clean file
| Quadrant A | 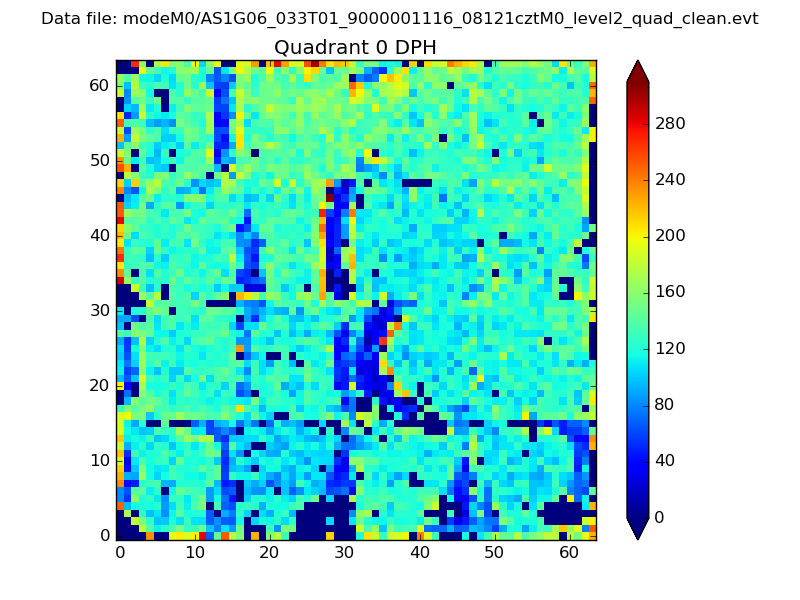 |
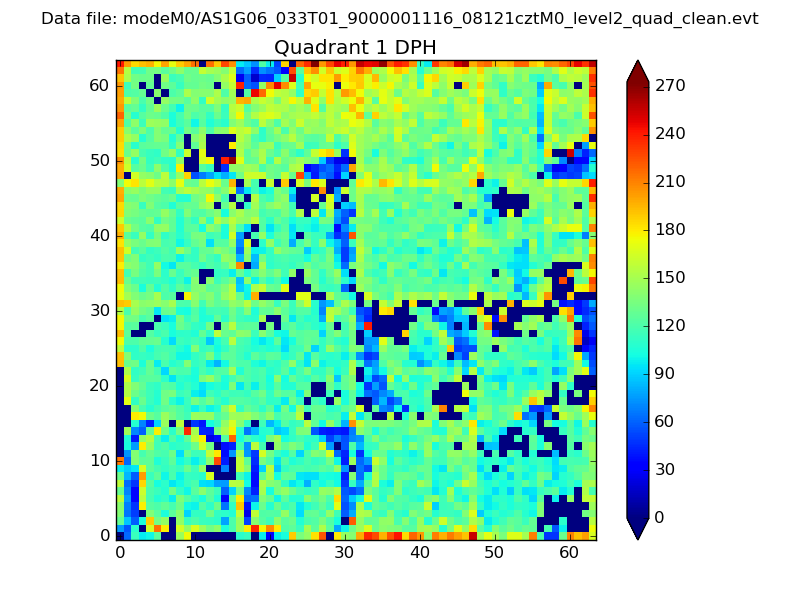 |
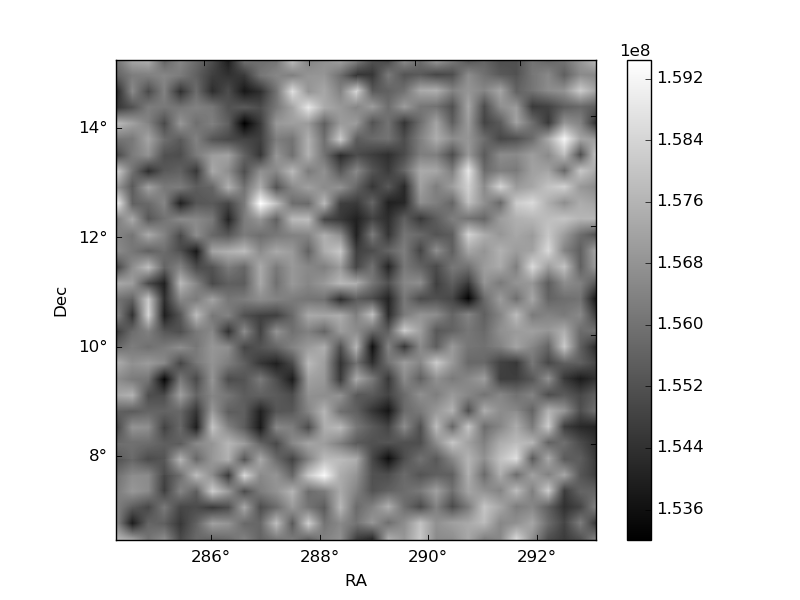
Quadrant B |
|---|---|---|---|
| Quadrant D | 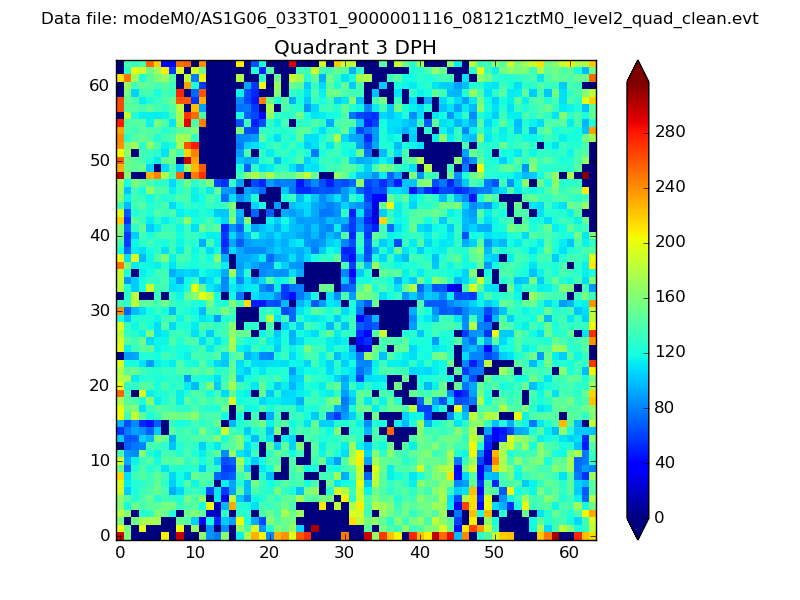 |
 |
Quadrant C |
| Plot type | Count rate plots | Images |
|---|---|---|
| Comparison with Poisson distribution Blue bars denote a histogram of data divided into 1 sec bins. Red curve is a Poisson curve with rate = median count rate of data. |
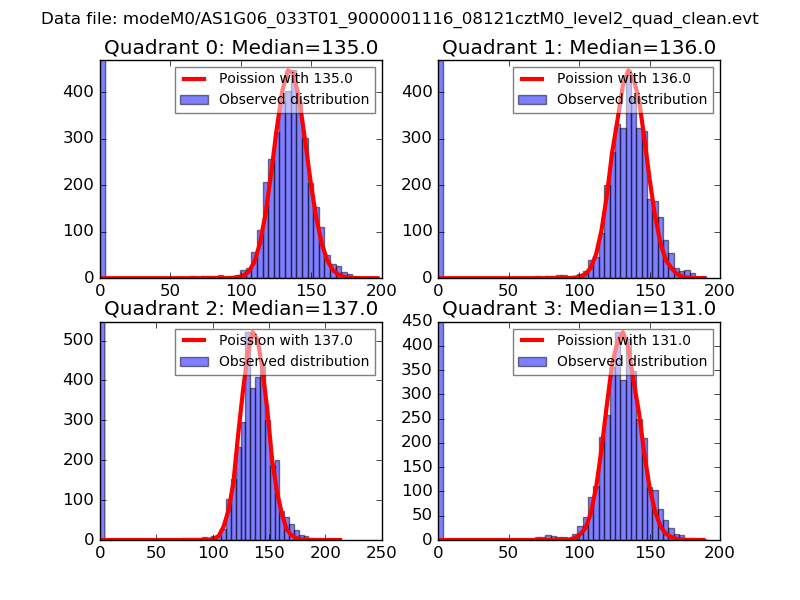 |
 |
| Quadrant-wise count rates Data is divided into 100 sec bins |
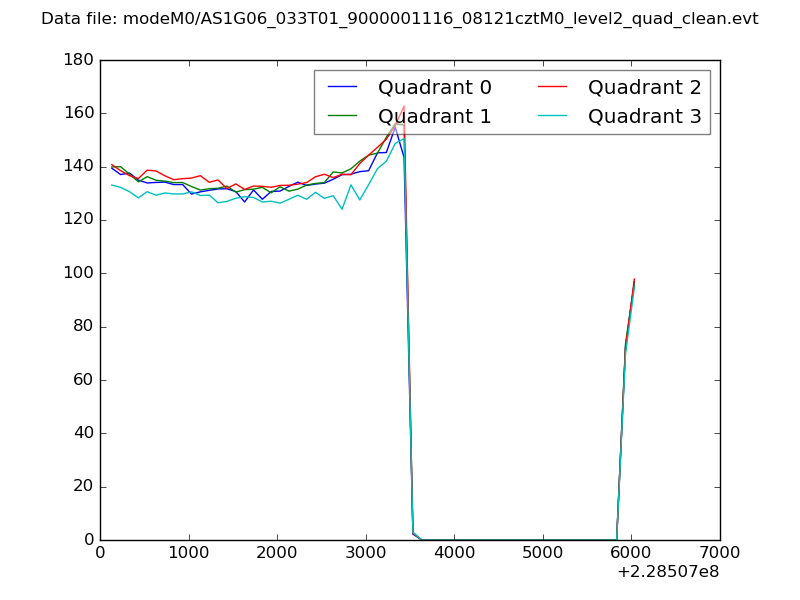 |
|
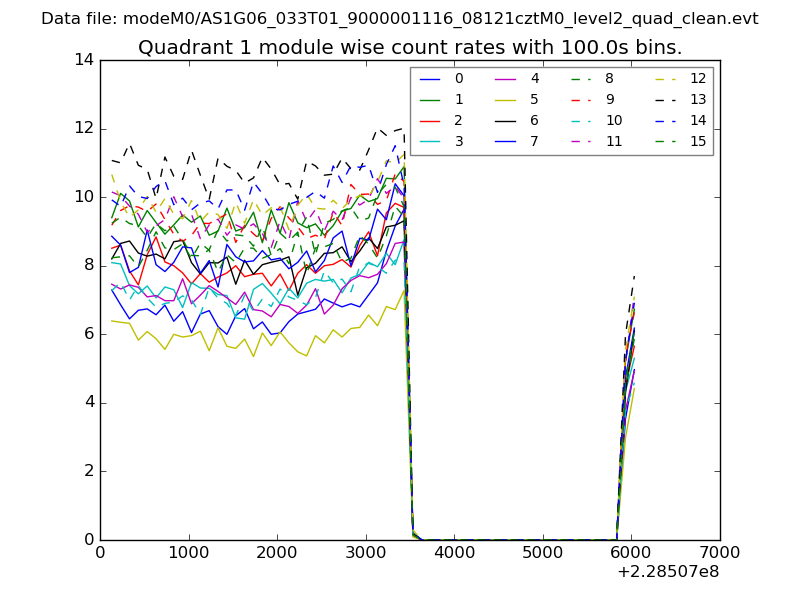
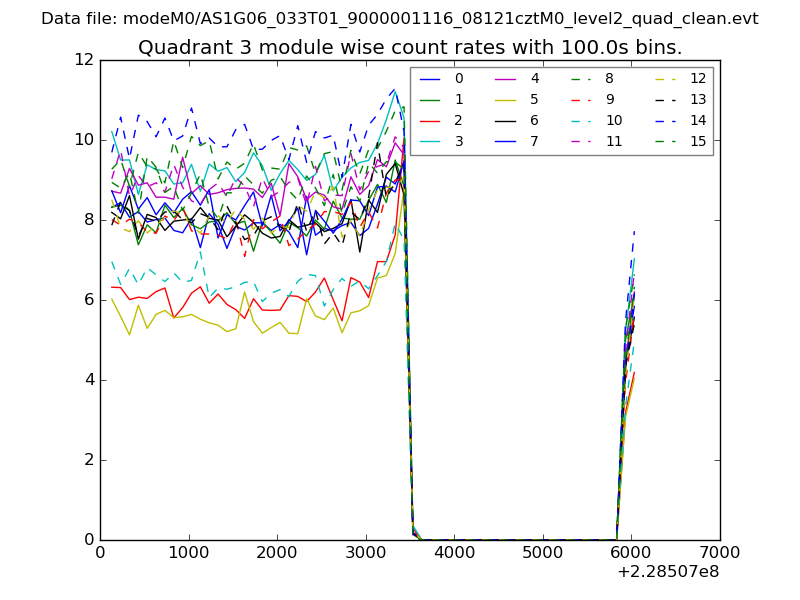
| Module-wise count rates for Quadrant A Data is divided into 100 sec bins |
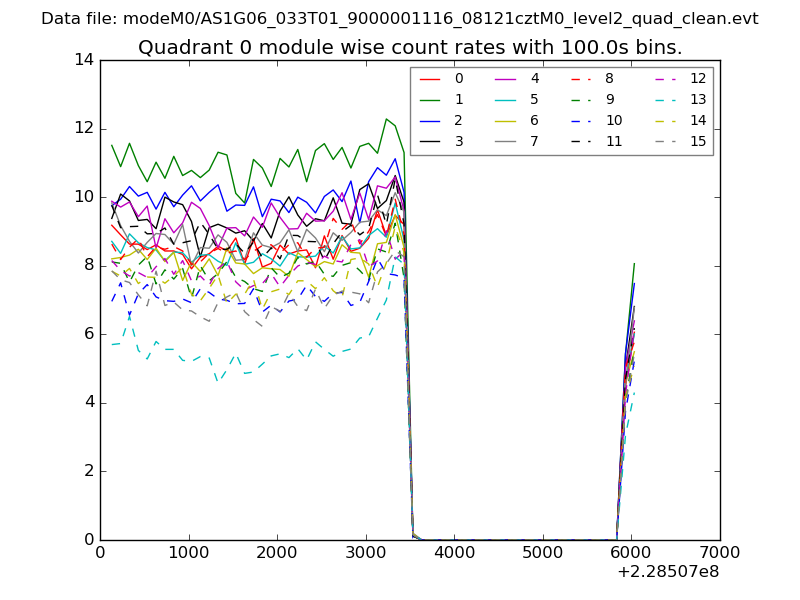 |
 |
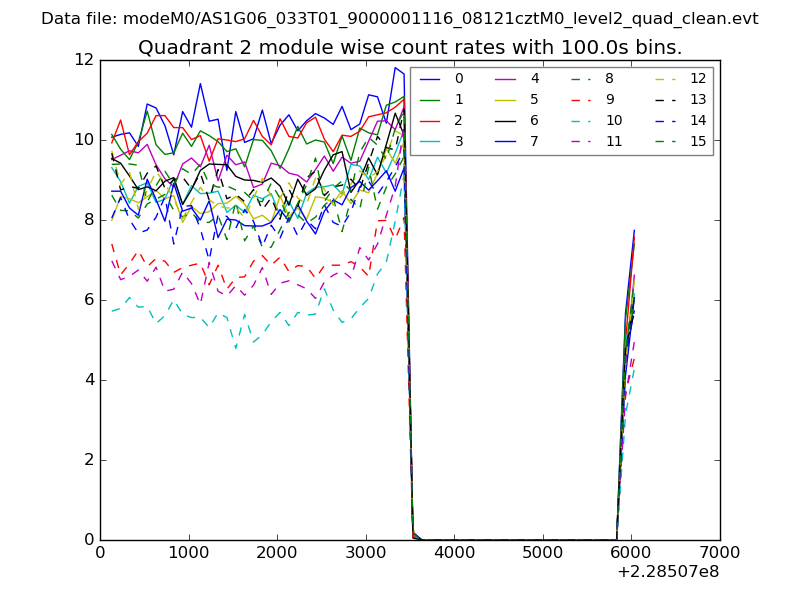
| Module-wise count rates for Quadrant B Data is divided into 100 sec bins |
 |
 |
| Module-wise count rates for Quadrant C Data is divided into 100 sec bins |
 |
 |
| Module-wise count rates for Quadrant D Data is divided into 100 sec bins |
 |
 |
| Parameter | Plot |
|---|---|
| CZT HV Monitor | 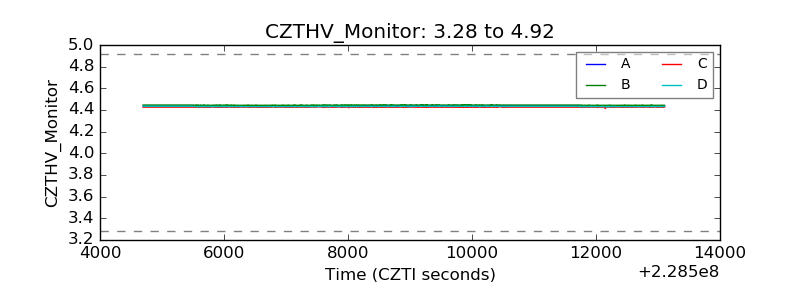 |
| D_VDD | 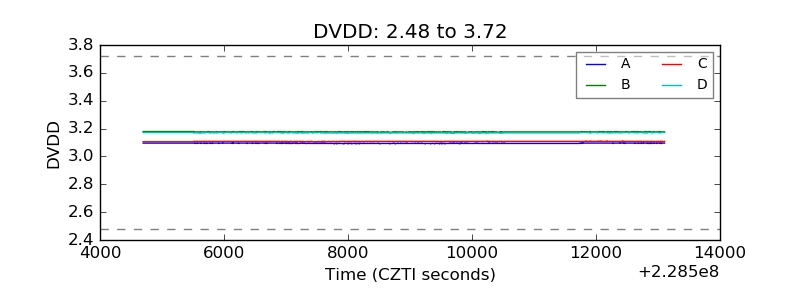 |
| Temperature 1 | 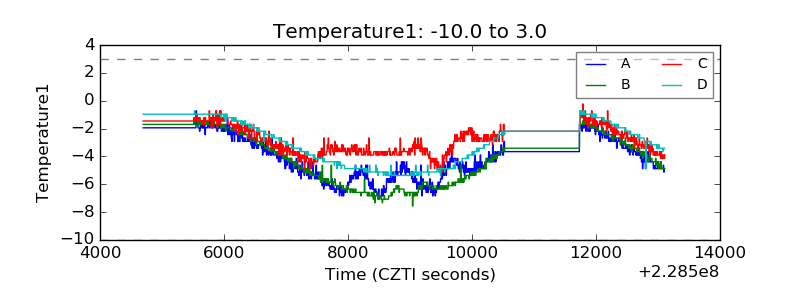 |
| Veto HV Monitor | 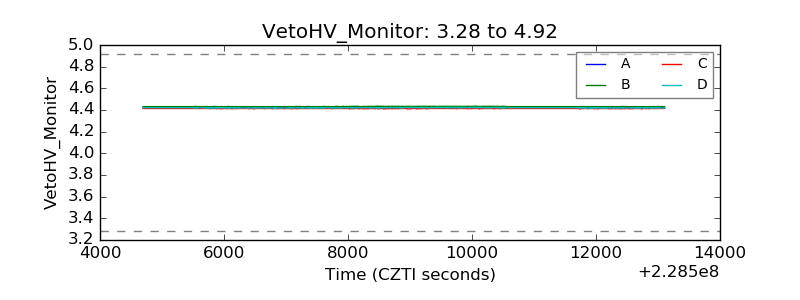 |
| Veto LLD | 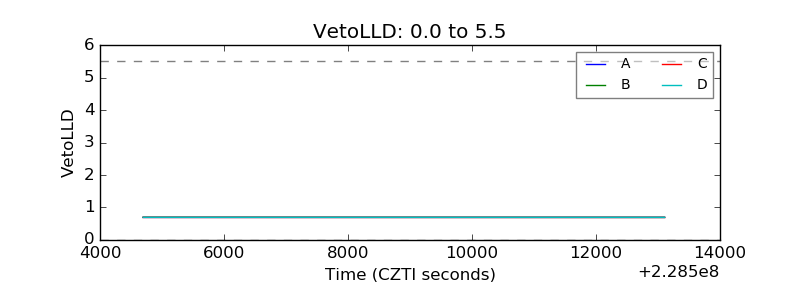 |
| Alpha Counter | 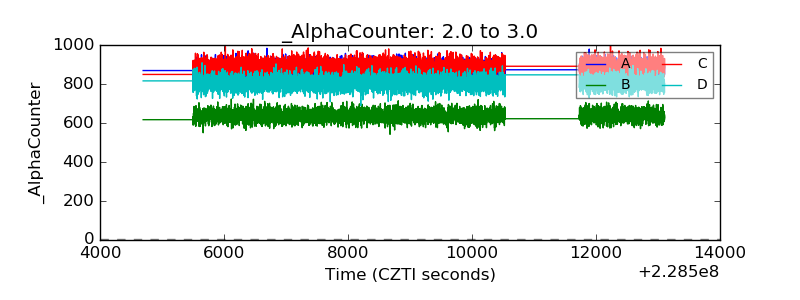 |
| _CPM_Rate |  |
| CZT Counter | 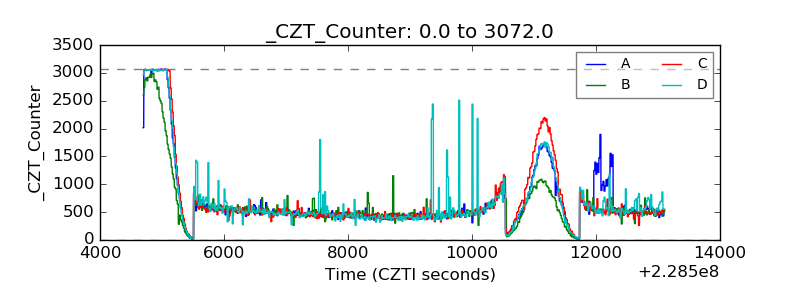 |
| +2.5 Volts monitor |  |
| +5 Volts monitor | 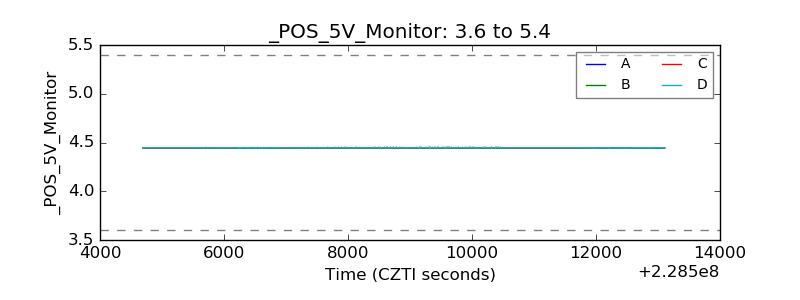 |
| _ROLL_ROT | 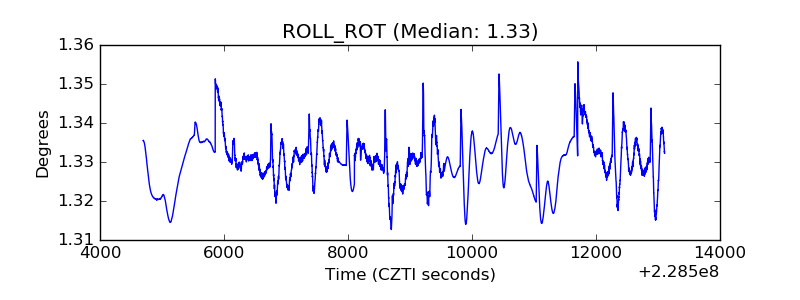 |
| _Roll_DEC | 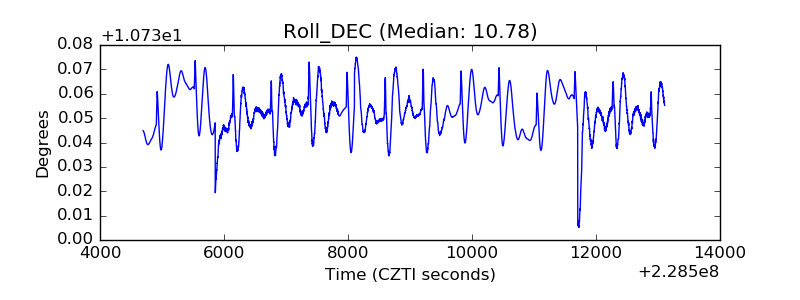 |
| _Roll_RA | 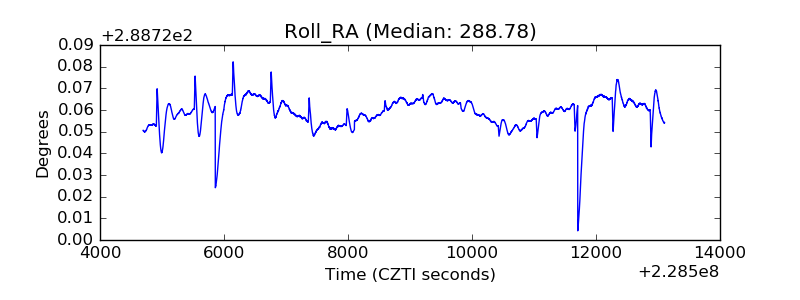 |
| Veto Counter | 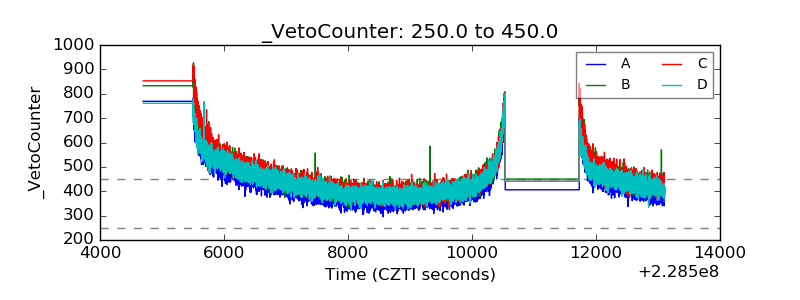 |