| Param | Original file | Final file |
|---|---|---|
| Filename | modeM0/AS1G06_033T01_9000001116_08122cztM0_level2.evt | modeM0/AS1G06_033T01_9000001116_08122cztM0_level2_quad_clean.evt |
| Size (bytes) | 109,630,080 | 8,130,240 |
| Size | 104.6 MB | 7.8 MB |
| Events in quadrant A | 921,190 | 35,338 |
| Events in quadrant B | 727,830 | 35,963 |
| Events in quadrant C | 699,086 | 35,888 |
| Events in quadrant D | 874,506 | 34,296 |
| Mode SS | |||
|---|---|---|---|
| Quadrant | BADHDUFLAG | Total packets | Discarded packets |
| A | 0 | 28 | 0 |
| B | 0 | 28 | 0 |
| C | 0 | 28 | 0 |
| D | 0 | 28 | 0 |
| Mode M0 | |||
|---|---|---|---|
| Quadrant | BADHDUFLAG | Total packets | Discarded packets |
| A | 0 | 3542 | 0 |
| B | 0 | 2918 | 0 |
| C | 0 | 2835 | 0 |
| D | 0 | 3469 | 0 |
| Quadrant | Total seconds | Saturated seconds | Saturation percentage |
|---|---|---|---|
| A | 1393 | 29 | 2.081838% |
| B | 1393 | 9 | 0.646088% |
| C | 1393 | 3 | 0.215363% |
| D | 1393 | 6 | 0.430725% |
Noise dominated data is calculated using 1-second bins in cleaned event files. If a bin has >2000 counts, and if more than 50% of those come from <1% of pixels, then it is considered to be noise-dominated and hence unusable.
| Quadrant | # 1 sec bins | Bins with >0 counts | Bins with >2000 counts | High rate bins dominated by noise | Noise dominated (total time) | Noise dominated (detector-on time) | Marked lightcurve |
|---|---|---|---|---|---|---|---|
| A | 1393 | 1393 | 0 | 0 | 0.00% | 0.00% | 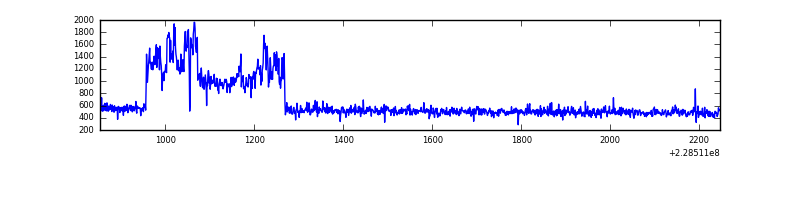 |
| B | 1393 | 1393 | 0 | 0 | 0.00% | 0.00% | 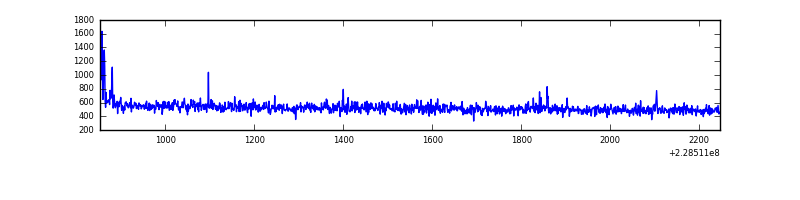 |
| C | 1393 | 1393 | 0 | 0 | 0.00% | 0.00% | 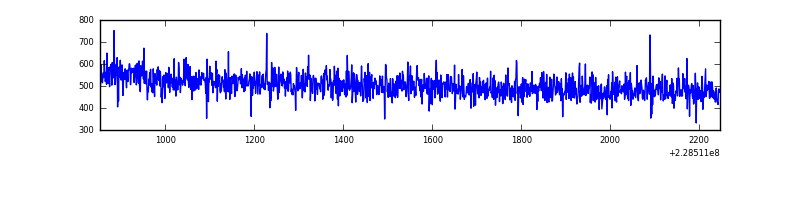 |
| D | 1393 | 1393 | 0 | 0 | 0.00% | 0.00% | 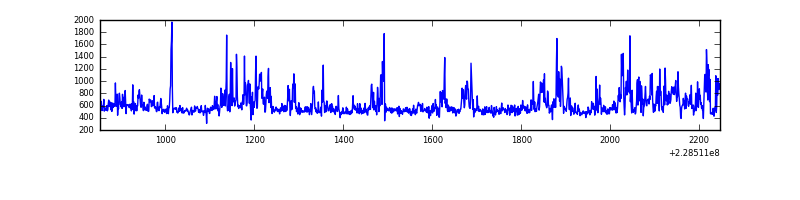 |
Top three noisy pixels from each quadrant. If the there are fewer than three noisy pixels in the level2.evt file, extra rows are filled as -1
| Pixel properties | Quadrant properties | ||||||
|---|---|---|---|---|---|---|---|
| Quadrant | DetID | PixID | Counts | Sigma | Mean | Median | Sigma |
| A | 15 | 79 | 212762 | 5468.01 | 182 | 178 | 38.9 |
| A | 3 | 1 | 3276 | 79.69 | 182 | 178 | 38.9 |
| A | 13 | 254 | 2197 | 51.93 | 182 | 178 | 38.9 |
| B | 5 | 255 | 7522 | 201.29 | 183 | 179 | 36.5 |
| B | 12 | 111 | 3056 | 78.86 | 183 | 179 | 36.5 |
| B | 0 | 219 | 2826 | 72.56 | 183 | 179 | 36.5 |
| C | 1 | 16 | 1623 | 33.97 | 178 | 179 | 42.5 |
| C | 13 | 61 | 1387 | 28.42 | 178 | 179 | 42.5 |
| C | 3 | 202 | 475 | 6.96 | 178 | 179 | 42.5 |
| D | 2 | 152 | 151910 | 3312.22 | 179 | 173 | 45.8 |
| D | 5 | 233 | 24705 | 535.5 | 179 | 173 | 45.8 |
| D | 13 | 122 | 12639 | 272.12 | 179 | 173 | 45.8 |
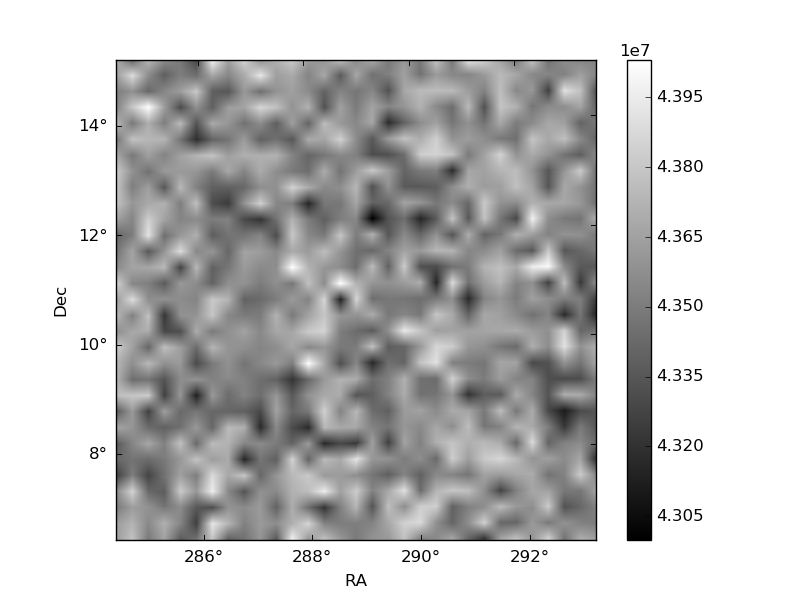
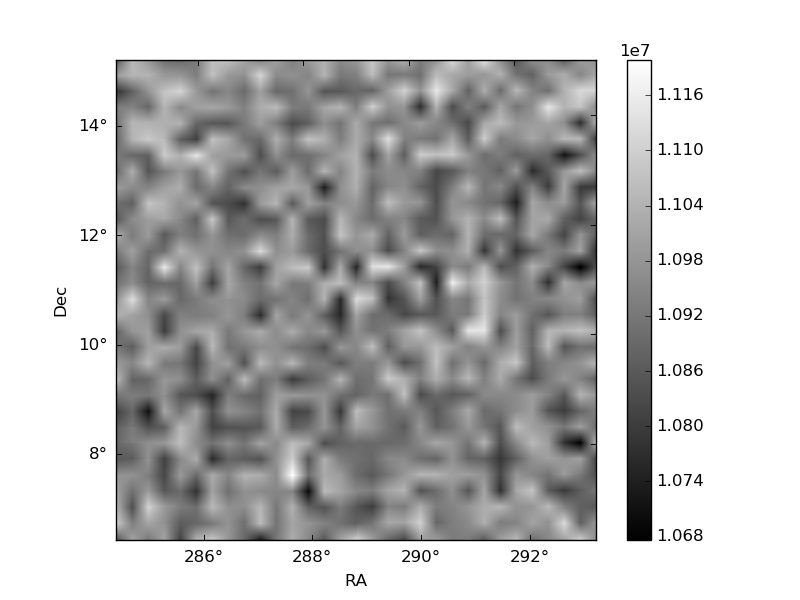
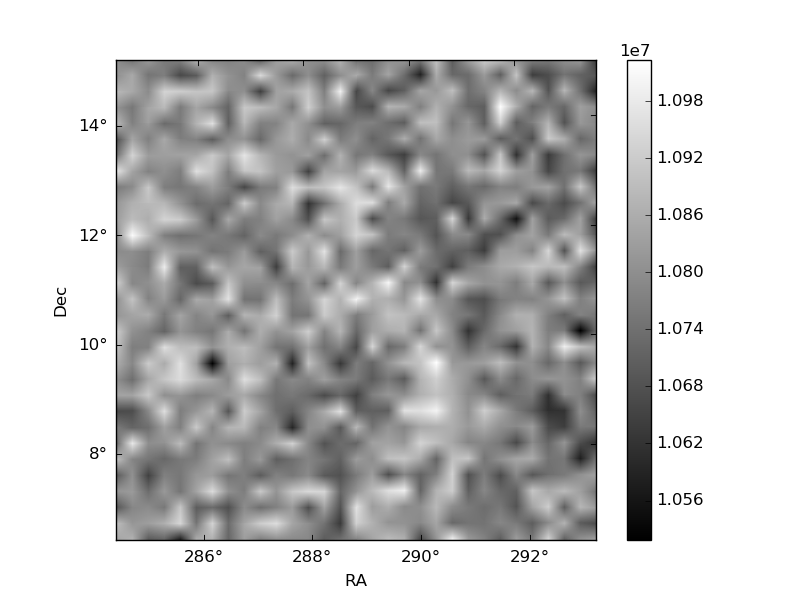
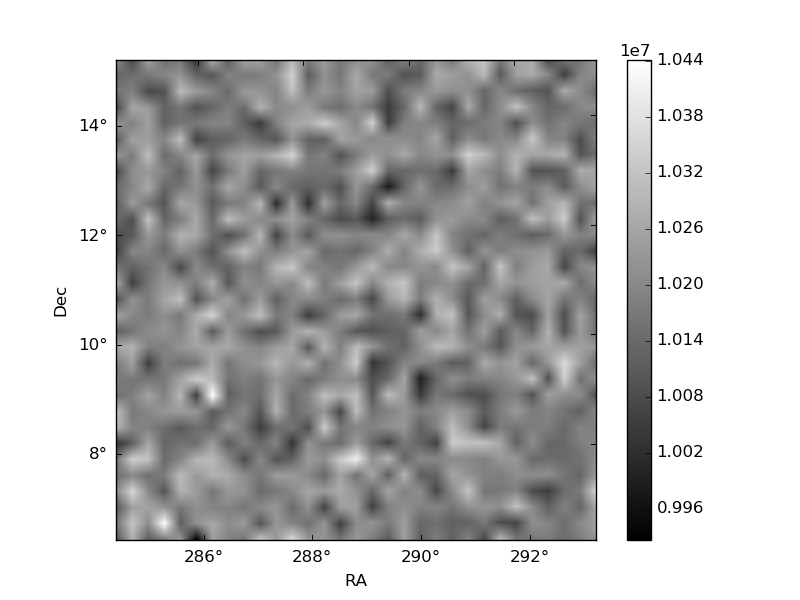
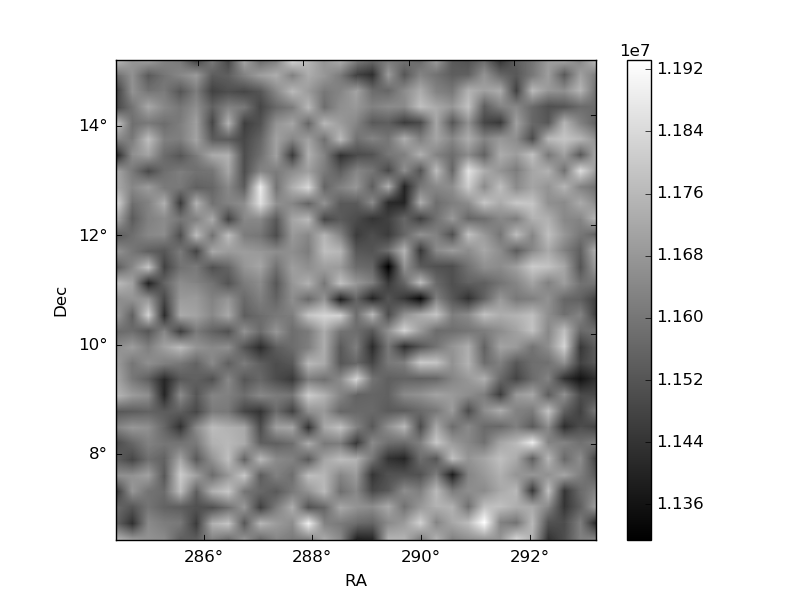
Histogram calculated using DETX and DETY for each event in the final _common_clean file
| Quadrant A | 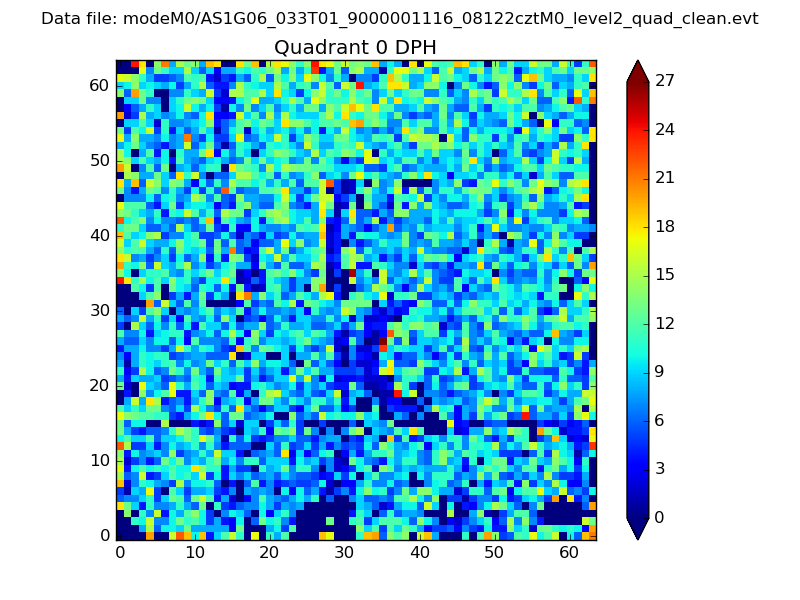 |
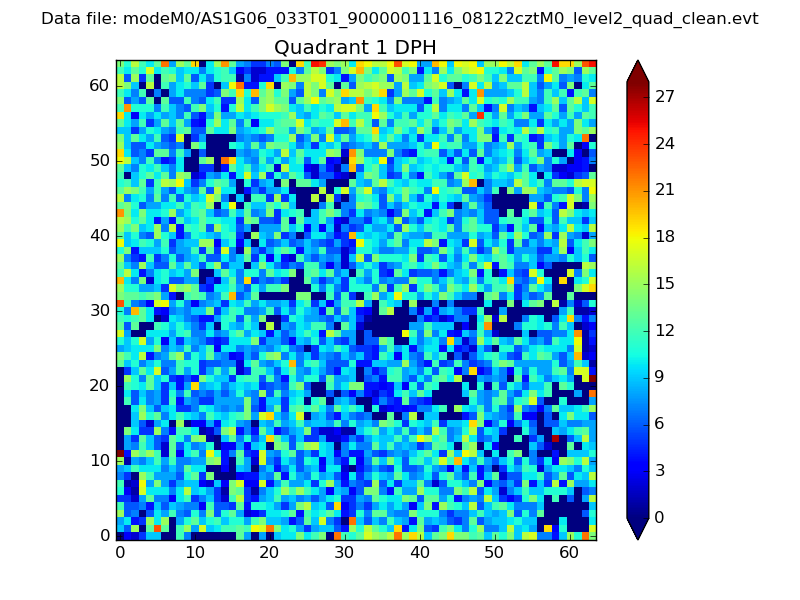 |
Quadrant B |
|---|---|---|---|
| Quadrant D | 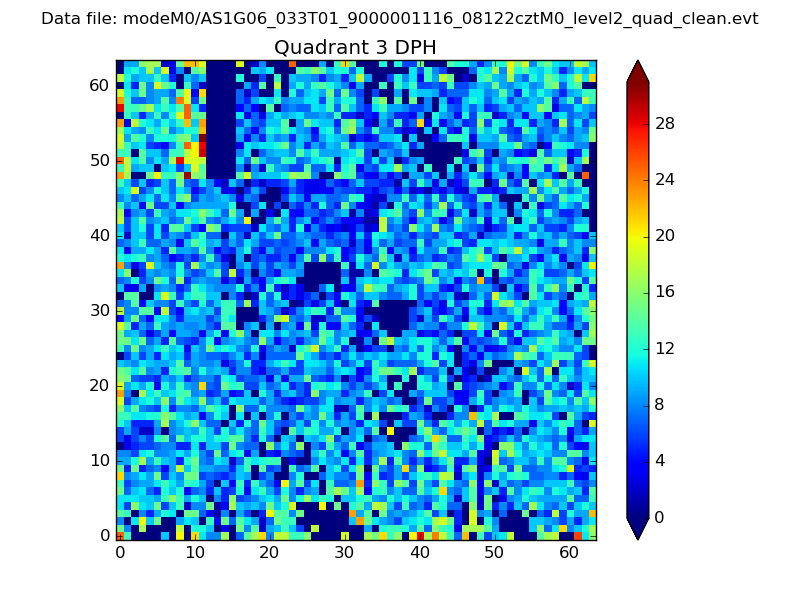 |
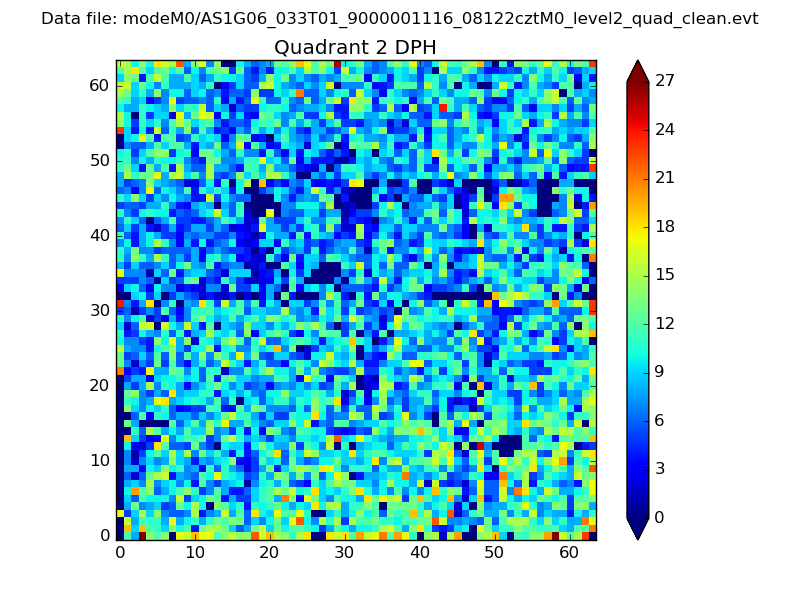 |
Quadrant C |
| Plot type | Count rate plots | Images |
|---|---|---|
| Comparison with Poisson distribution Blue bars denote a histogram of data divided into 1 sec bins. Red curve is a Poisson curve with rate = median count rate of data. |
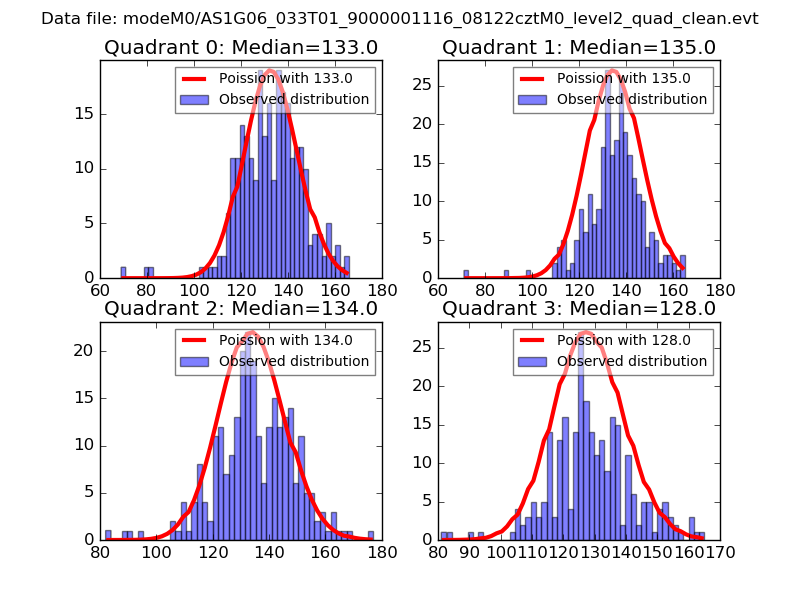 |
 |
| Quadrant-wise count rates Data is divided into 100 sec bins |
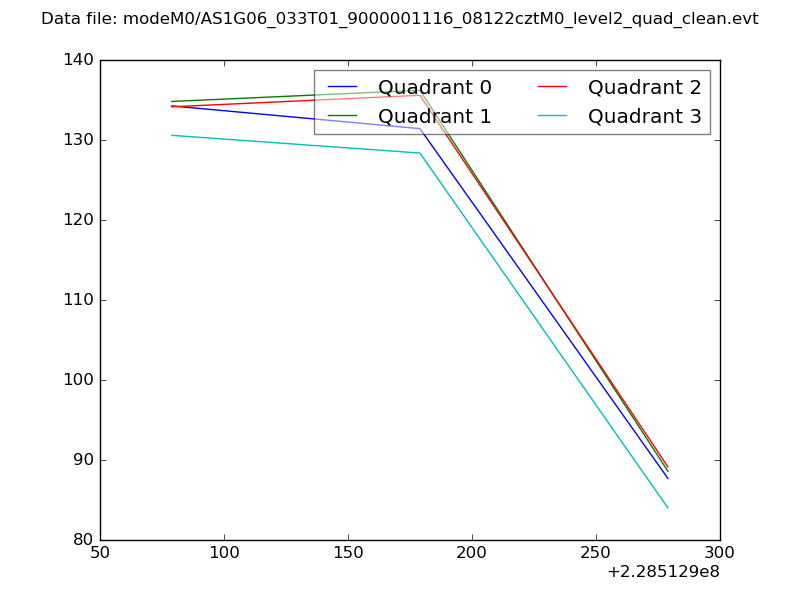 |
|
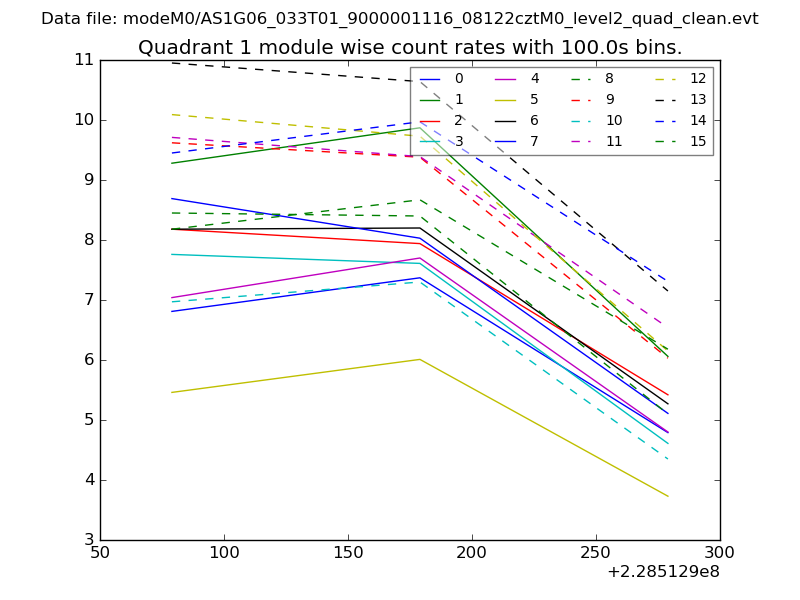
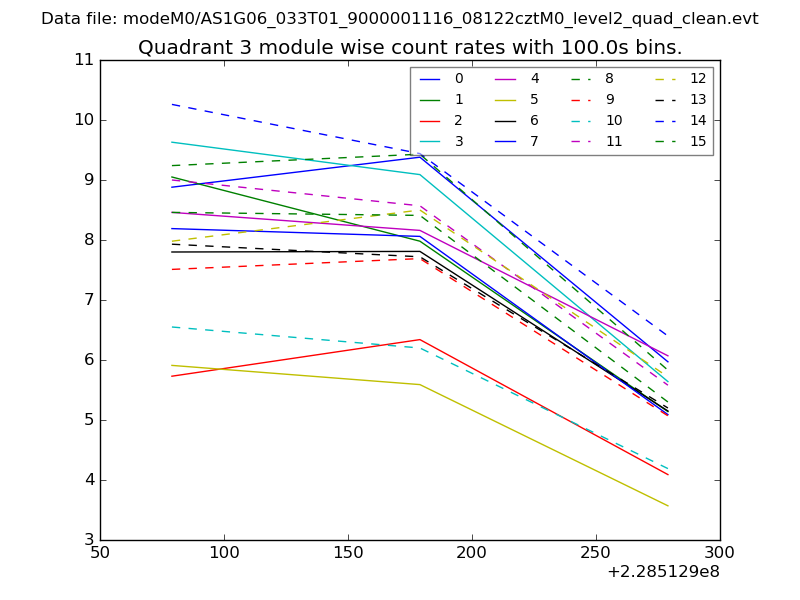
| Module-wise count rates for Quadrant A Data is divided into 100 sec bins |
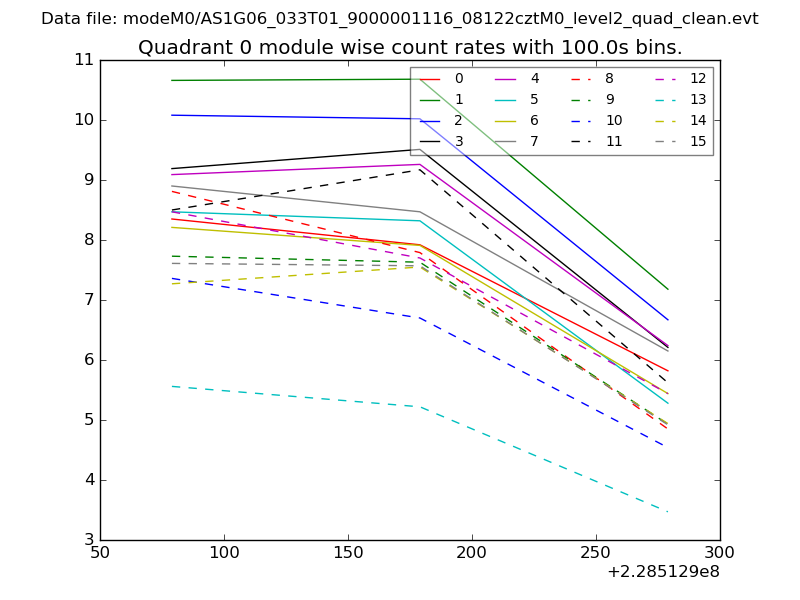 |
 |
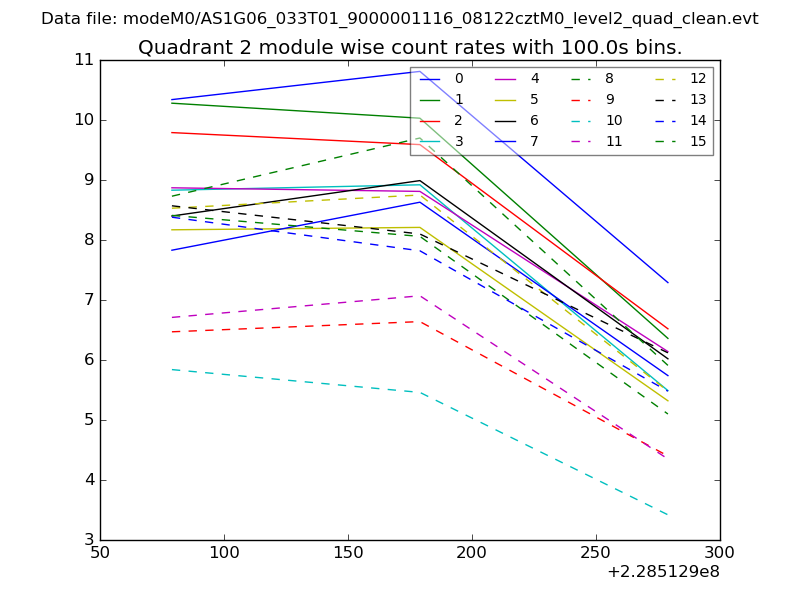
| Module-wise count rates for Quadrant B Data is divided into 100 sec bins |
 |
 |
| Module-wise count rates for Quadrant C Data is divided into 100 sec bins |
 |
 |
| Module-wise count rates for Quadrant D Data is divided into 100 sec bins |
 |
 |
| Parameter | Plot |
|---|---|
| CZT HV Monitor | 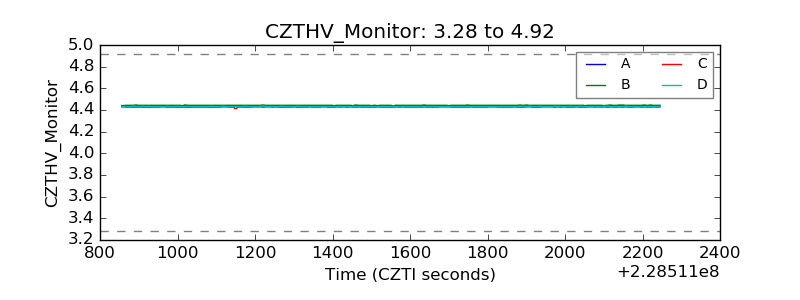 |
| D_VDD | 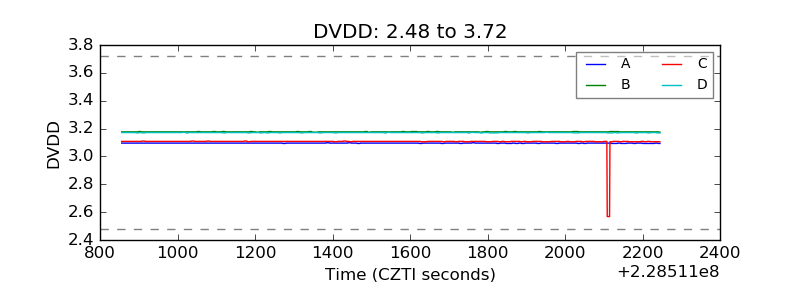 |
| Temperature 1 | 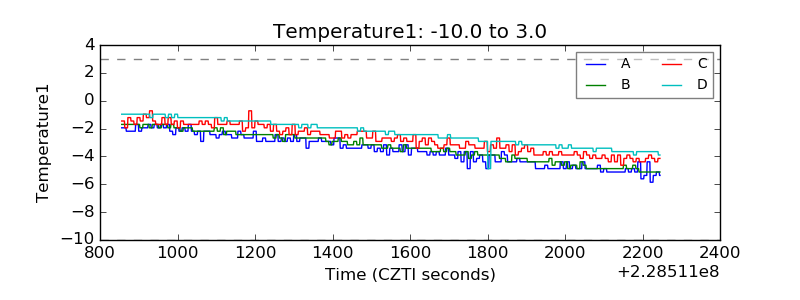 |
| Veto HV Monitor | 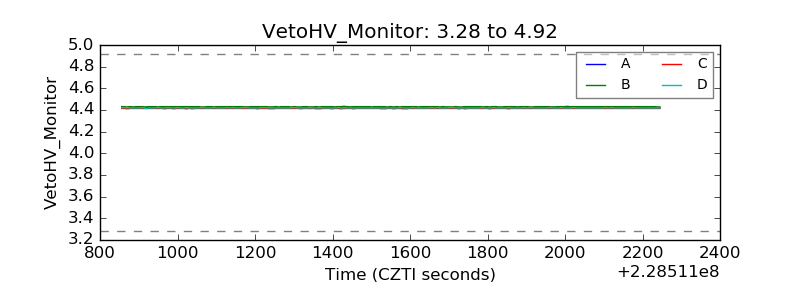 |
| Veto LLD | 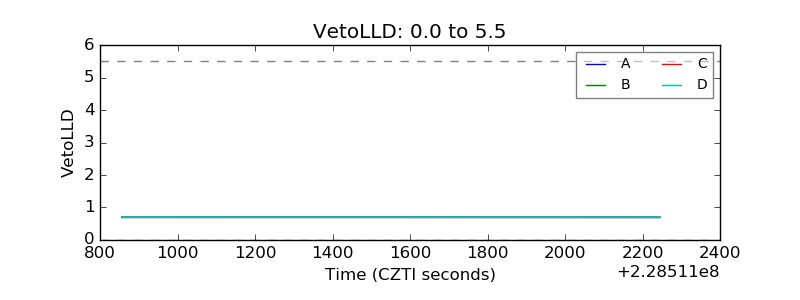 |
| Alpha Counter | 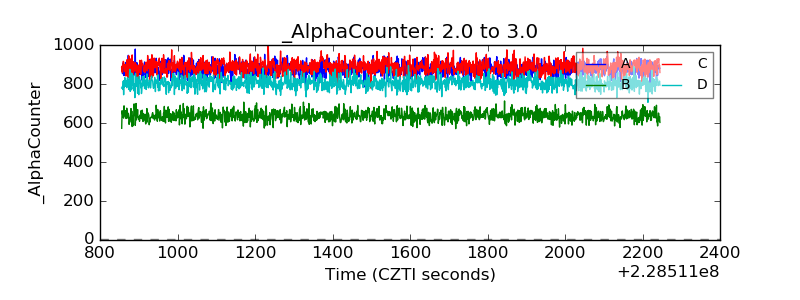 |
| _CPM_Rate | 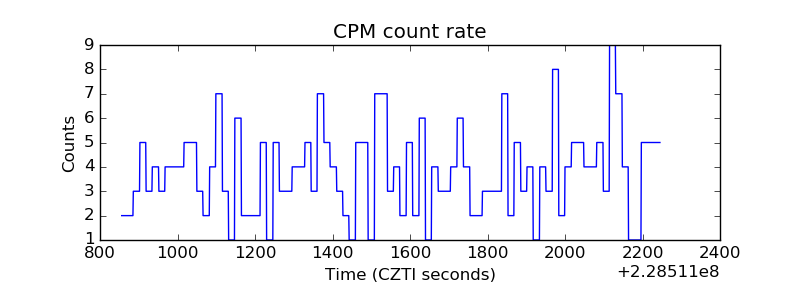 |
| CZT Counter | 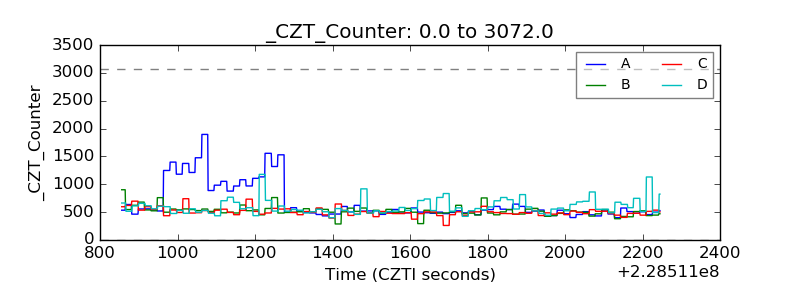 |
| +2.5 Volts monitor |  |
| +5 Volts monitor |  |
| _ROLL_ROT | 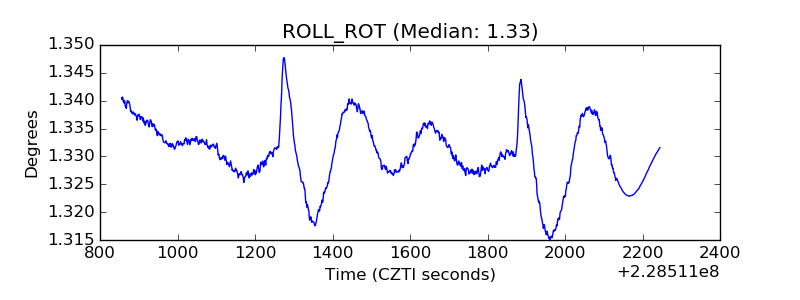 |
| _Roll_DEC | 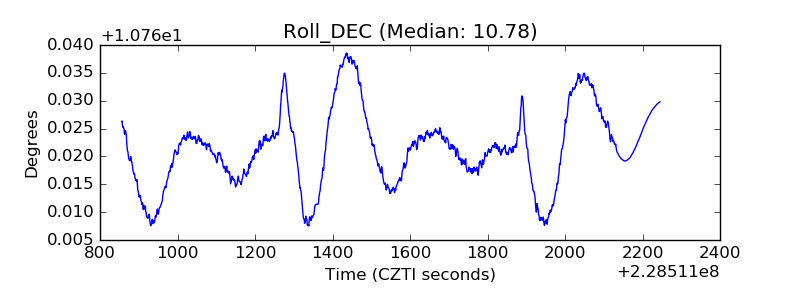 |
| _Roll_RA | 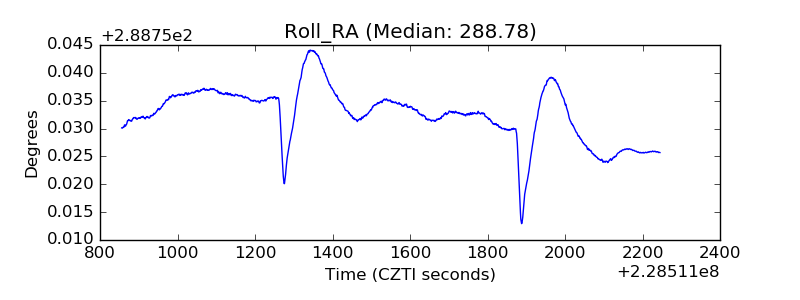 |
| Veto Counter | 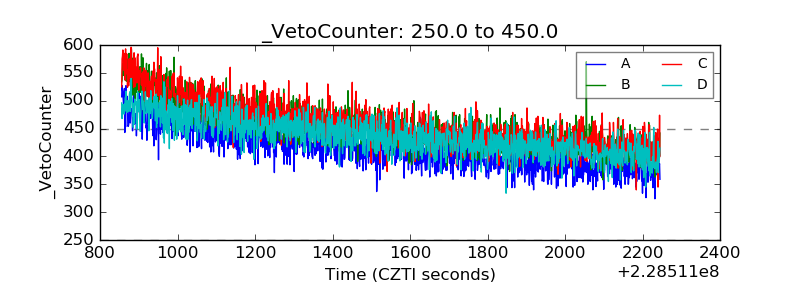 |