| Param | Original file | Final file |
|---|---|---|
| Filename | modeM0/AS1A02_178T01_9000001118cztM0_level2.fits | modeM0/AS1A02_178T01_9000001118cztM0_level2_quad_clean.evt |
| Size (bytes) | 687,631,680 | 703,863,360 |
| Size | 655.8 MB | 671.3 MB |
| Events in quadrant A | 3,772,978 | 3,705,011 |
| Events in quadrant B | 4,121,208 | 4,448,967 |
| Events in quadrant C | 4,199,676 | 4,209,709 |
| Events in quadrant D | 3,600,612 | 3,828,961 |
| Mode SS | |||
|---|---|---|---|
| Quadrant | BADHDUFLAG | Total packets | Discarded packets |
| A | 0 | 1526 | 0 |
| B | 0 | 1526 | 0 |
| C | 0 | 1526 | 0 |
| D | 0 | 1526 | 0 |
| Mode M0 | |||
|---|---|---|---|
| Quadrant | BADHDUFLAG | Total packets | Discarded packets |
| A | 0 | 233476 | 0 |
| B | 0 | 158284 | 0 |
| C | 0 | 154379 | 0 |
| D | 0 | 167589 | 0 |
| Mode M9 | |||
|---|---|---|---|
| Quadrant | BADHDUFLAG | Total packets | Discarded packets |
| A | 0 | 114 | 0 |
| B | 0 | 114 | 0 |
| C | 0 | 114 | 0 |
| D | 0 | 114 | 0 |
| Quadrant | Total seconds | Saturated seconds | Saturation percentage |
|---|---|---|---|
| A | 74726 | 11900 | 15.924845% |
| B | 74732 | 1121 | 1.500027% |
| C | 74732 | 716 | 0.958090% |
| D | 74730 | 1634 | 2.186538% |
Noise dominated data is calculated using 1-second bins in cleaned event files. If a bin has >2000 counts, and if more than 50% of those come from <1% of pixels, then it is considered to be noise-dominated and hence unusable.
| Quadrant | # 1 sec bins | Bins with >0 counts | Bins with >2000 counts | High rate bins dominated by noise | Noise dominated (total time) | Noise dominated (detector-on time) | Marked lightcurve |
|---|---|---|---|---|---|---|---|
| A | 86186 | 74425 | 0 | 0 | 0.00% | 0.00% |  |
| B | 86186 | 74734 | 0 | 0 | 0.00% | 0.00% |  |
| C | 86186 | 74735 | 0 | 0 | 0.00% | 0.00% | 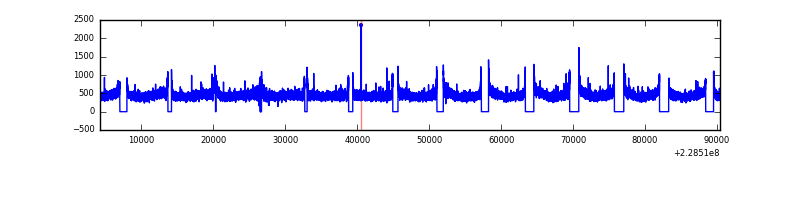 |
| D | 86186 | 74720 | 0 | 0 | 0.00% | 0.00% |  |
Top three noisy pixels from each quadrant. If the there are fewer than three noisy pixels in the level2.evt file, extra rows are filled as -1
| Pixel properties | Quadrant properties | ||||||
|---|---|---|---|---|---|---|---|
| Quadrant | DetID | PixID | Counts | Sigma | Mean | Median | Sigma |
| A | 0 | 29 | 3672 | 11.19 | 977 | 912 | 246.7 |
| A | 14 | 188 | 3667 | 11.17 | 977 | 912 | 246.7 |
| A | 14 | 204 | 3242 | 9.45 | 977 | 912 | 246.7 |
| B | 2 | 9 | 3605 | 11.73 | 1087 | 1032 | 219.4 |
| B | 3 | 17 | 2814 | 8.12 | 1087 | 1032 | 219.4 |
| B | 12 | 226 | 2788 | 8.0 | 1087 | 1032 | 219.4 |
| C | 1 | 80 | 3040 | 6.91 | 1109 | 1029 | 291.2 |
| C | 1 | 81 | 2955 | 6.61 | 1109 | 1029 | 291.2 |
| C | 12 | 241 | 2861 | 6.29 | 1109 | 1029 | 291.2 |
| D | 6 | 231 | 2672 | 6.33 | 1027 | 933 | 274.8 |
| D | 3 | 14 | 2609 | 6.1 | 1027 | 933 | 274.8 |
| D | 7 | 5 | 2531 | 5.82 | 1027 | 933 | 274.8 |
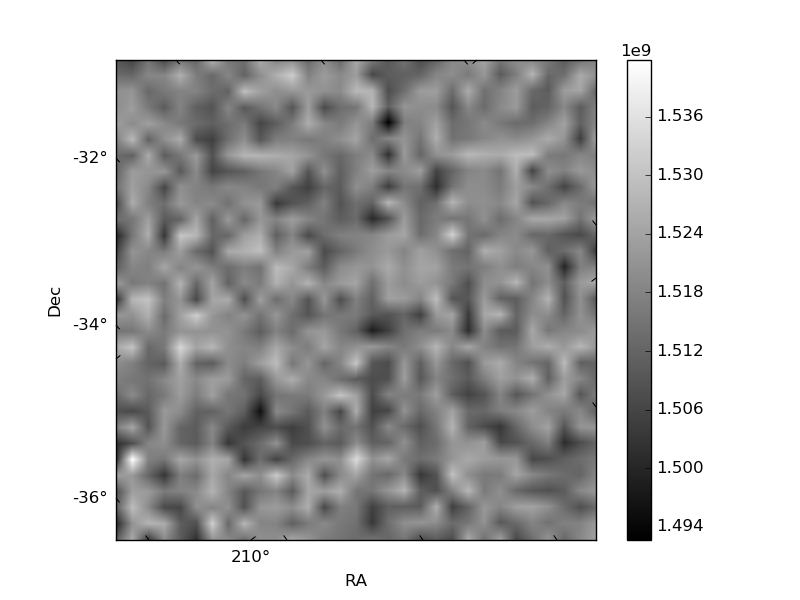
Histogram calculated using DETX and DETY for each event in the final _common_clean file
| Quadrant A |  |
 |
Quadrant B |
|---|---|---|---|
| Quadrant D | 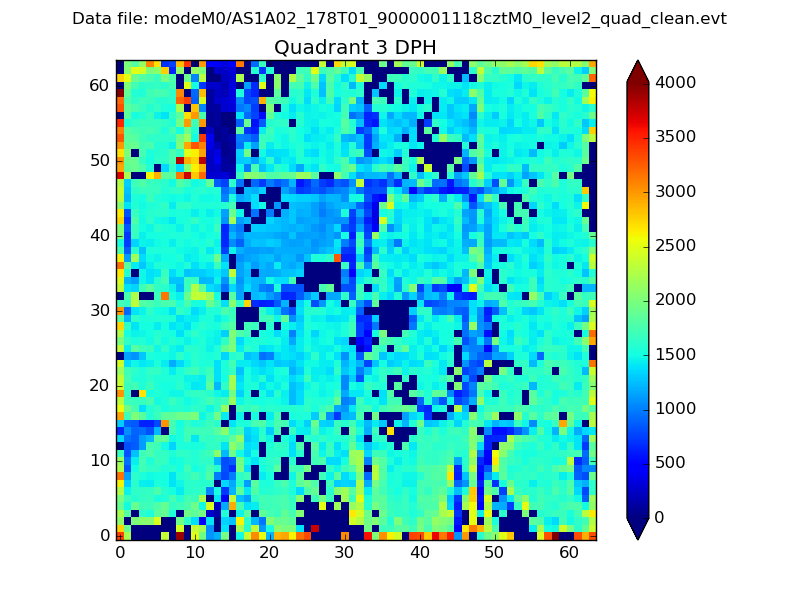 |
 |
Quadrant C |
| Plot type | Count rate plots | Images |
|---|---|---|
| Comparison with Poisson distribution Blue bars denote a histogram of data divided into 1 sec bins. Red curve is a Poisson curve with rate = median count rate of data. |
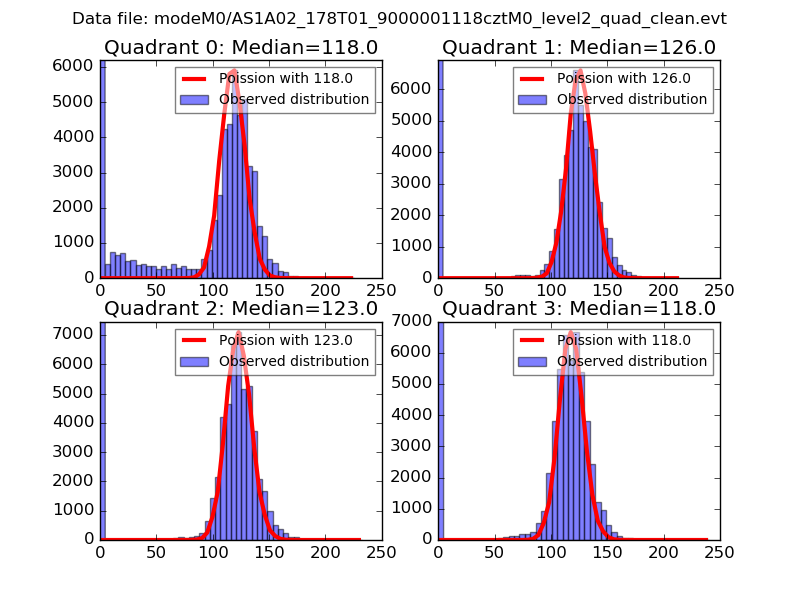 |
 |
| Quadrant-wise count rates Data is divided into 100 sec bins |
 |
|
| Module-wise count rates for Quadrant A Data is divided into 100 sec bins |
 |
 |
| Module-wise count rates for Quadrant B Data is divided into 100 sec bins |
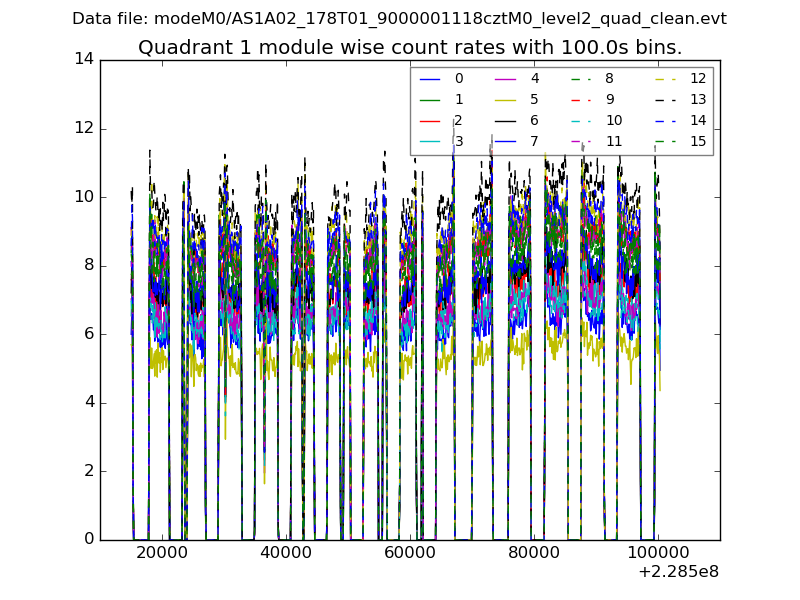 |
 |
| Module-wise count rates for Quadrant C Data is divided into 100 sec bins |
 |
 |
| Module-wise count rates for Quadrant D Data is divided into 100 sec bins |
 |
 |
| Parameter | Plot |
|---|---|
| CZT HV Monitor |  |
| D_VDD |  |
| Temperature 1 |  |
| Veto HV Monitor |  |
| Veto LLD | 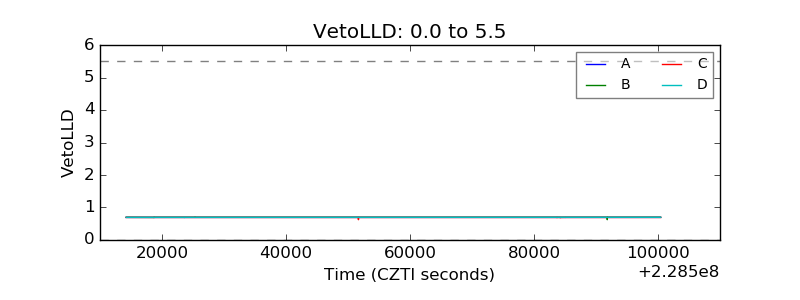 |
| Alpha Counter |  |
| _CPM_Rate |  |
| CZT Counter |  |
| +2.5 Volts monitor |  |
| +5 Volts monitor | 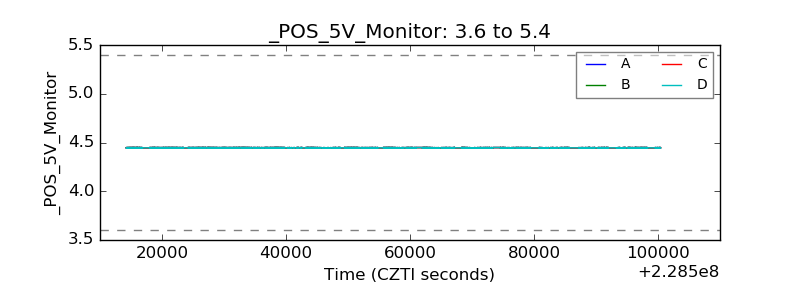 |
| _ROLL_ROT |  |
| _Roll_DEC |  |
| _Roll_RA |  |
| Veto Counter |  |