| Param | Original file | Final file |
|---|---|---|
| Filename | modeM0/AS1A02_178T01_9000001118_08124cztM0_level2.evt | modeM0/AS1A02_178T01_9000001118_08124cztM0_level2_quad_clean.evt |
| Size (bytes) | 605,203,200 | 116,642,880 |
| Size | 577.2 MB | 111.2 MB |
| Events in quadrant A | 4,006,206 | 741,872 |
| Events in quadrant B | 4,338,286 | 758,843 |
| Events in quadrant C | 4,020,047 | 746,199 |
| Events in quadrant D | 5,380,529 | 688,218 |
| Mode SS | |||
|---|---|---|---|
| Quadrant | BADHDUFLAG | Total packets | Discarded packets |
| A | 0 | 174 | 0 |
| B | 0 | 174 | 0 |
| C | 0 | 174 | 0 |
| D | 0 | 174 | 0 |
| Mode M0 | |||
|---|---|---|---|
| Quadrant | BADHDUFLAG | Total packets | Discarded packets |
| A | 0 | 17892 | 3 |
| B | 0 | 18780 | 2 |
| C | 0 | 17901 | 2 |
| D | 0 | 22030 | 2 |
| Mode M9 | |||
|---|---|---|---|
| Quadrant | BADHDUFLAG | Total packets | Discarded packets |
| A | 0 | 6 | 0 |
| B | 0 | 6 | 0 |
| C | 0 | 6 | 0 |
| D | 0 | 6 | 0 |
| Quadrant | Total seconds | Saturated seconds | Saturation percentage |
|---|---|---|---|
| A | 8606 | 94 | 1.092261% |
| B | 8606 | 177 | 2.056705% |
| C | 8606 | 90 | 1.045782% |
| D | 8606 | 522 | 6.065536% |
Noise dominated data is calculated using 1-second bins in cleaned event files. If a bin has >2000 counts, and if more than 50% of those come from <1% of pixels, then it is considered to be noise-dominated and hence unusable.
| Quadrant | # 1 sec bins | Bins with >0 counts | Bins with >2000 counts | High rate bins dominated by noise | Noise dominated (total time) | Noise dominated (detector-on time) | Marked lightcurve |
|---|---|---|---|---|---|---|---|
| A | 9191 | 8608 | 1 | 1 | 0.01% | 0.01% | 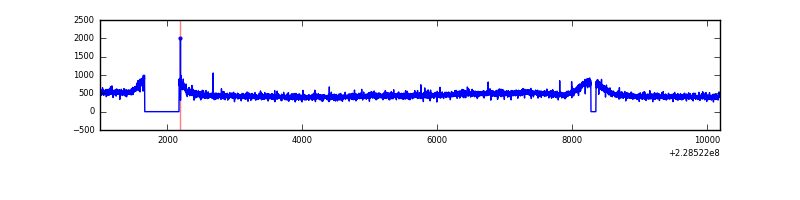 |
| B | 9191 | 8608 | 37 | 37 | 0.40% | 0.43% | 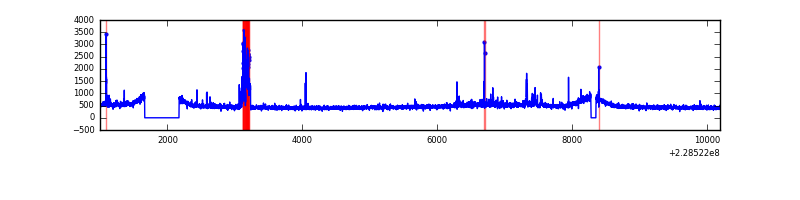 |
| C | 9191 | 8608 | 0 | 0 | 0.00% | 0.00% | 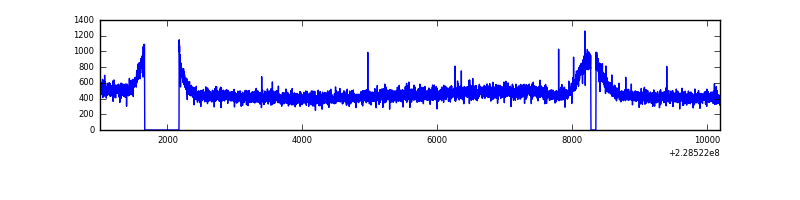 |
| D | 9191 | 8607 | 296 | 296 | 3.22% | 3.44% |  |
Top three noisy pixels from each quadrant. If the there are fewer than three noisy pixels in the level2.evt file, extra rows are filled as -1
| Pixel properties | Quadrant properties | ||||||
|---|---|---|---|---|---|---|---|
| Quadrant | DetID | PixID | Counts | Sigma | Mean | Median | Sigma |
| A | 8 | 15 | 18465 | 81.16 | 1035 | 1009 | 215.1 |
| A | 0 | 226 | 9761 | 40.69 | 1035 | 1009 | 215.1 |
| A | 12 | 194 | 9420 | 39.1 | 1035 | 1009 | 215.1 |
| B | 10 | 16 | 207110 | 1020.09 | 1044 | 1017 | 202.0 |
| B | 0 | 214 | 74197 | 362.22 | 1044 | 1017 | 202.0 |
| B | 12 | 111 | 22703 | 107.34 | 1044 | 1017 | 202.0 |
| C | 1 | 16 | 36054 | 146.64 | 1021 | 1024 | 238.9 |
| C | 13 | 61 | 7622 | 27.62 | 1021 | 1024 | 238.9 |
| C | 12 | 4 | 3556 | 10.6 | 1021 | 1024 | 238.9 |
| D | 12 | 221 | 1294149 | 5046.21 | 983 | 958 | 256.3 |
| D | 1 | 52 | 104651 | 404.62 | 983 | 958 | 256.3 |
| D | 13 | 169 | 101966 | 394.15 | 983 | 958 | 256.3 |
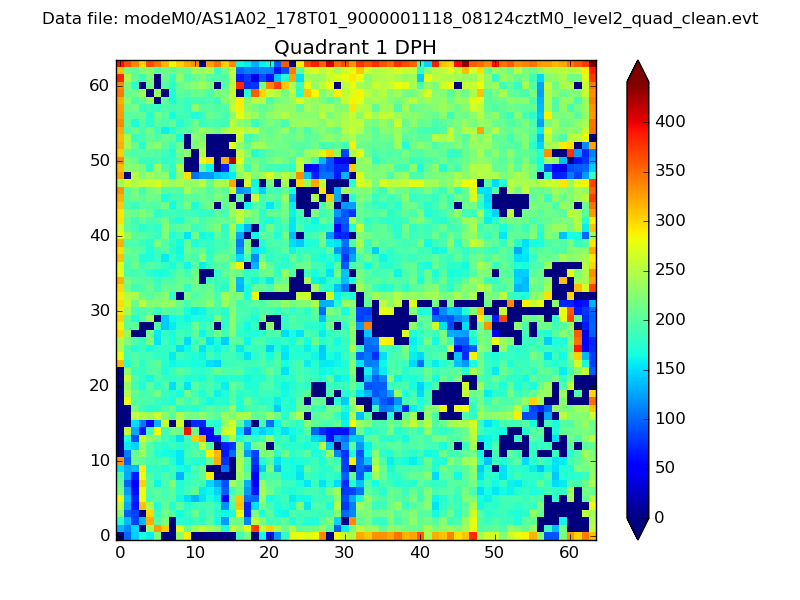
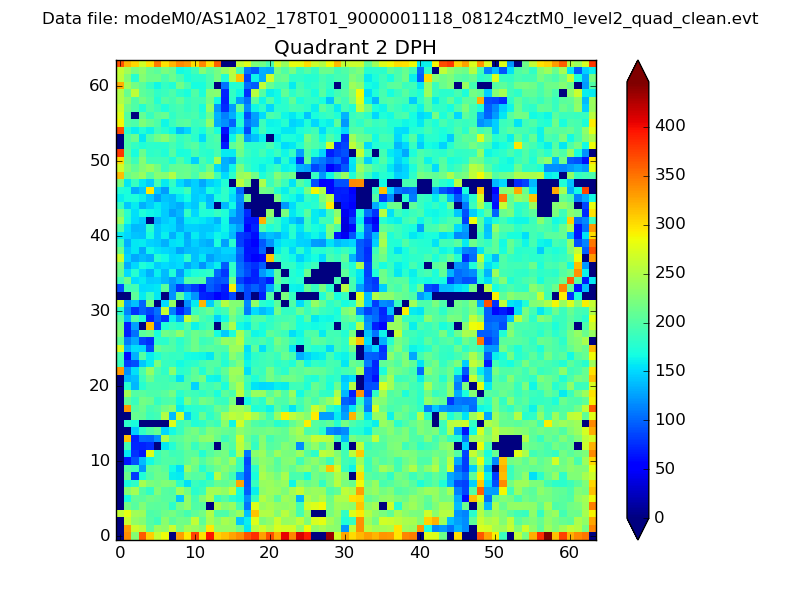
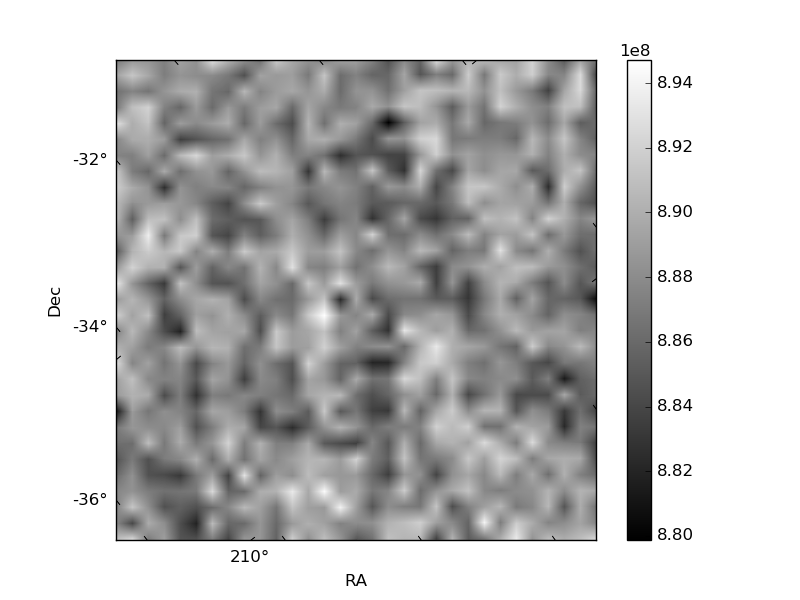
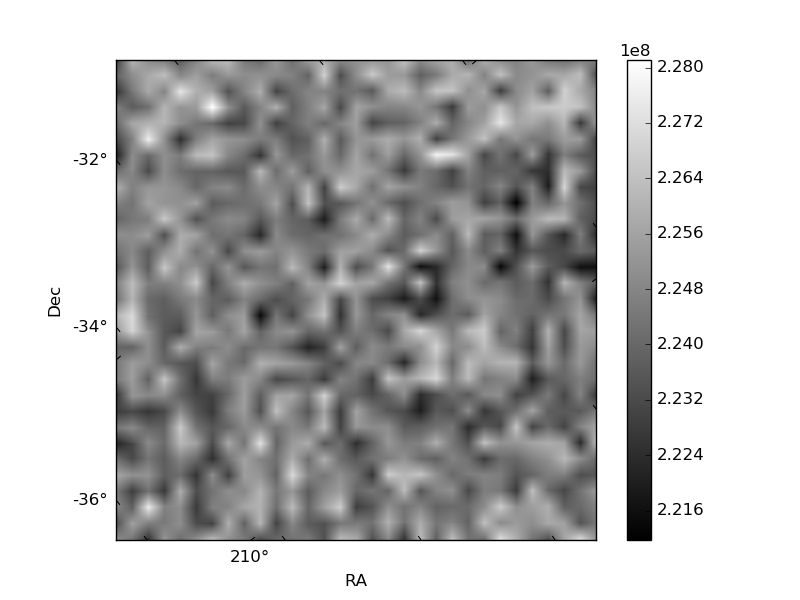
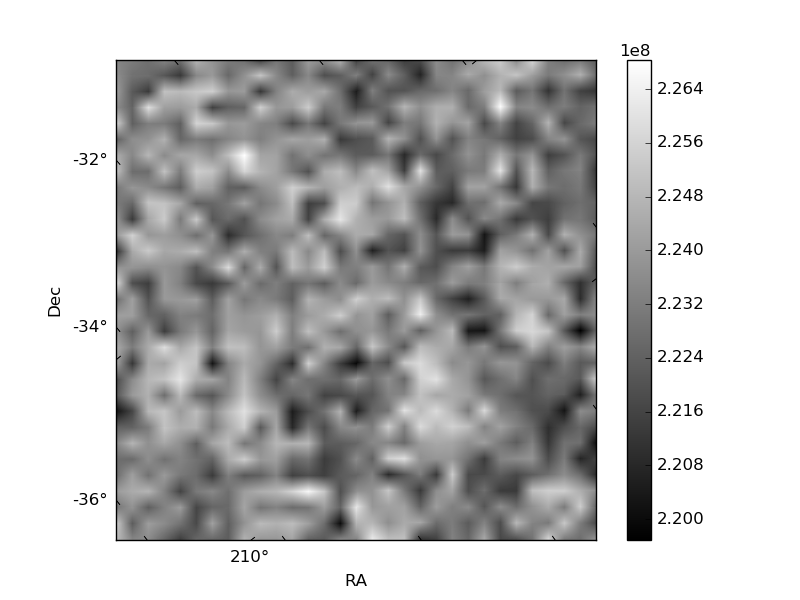
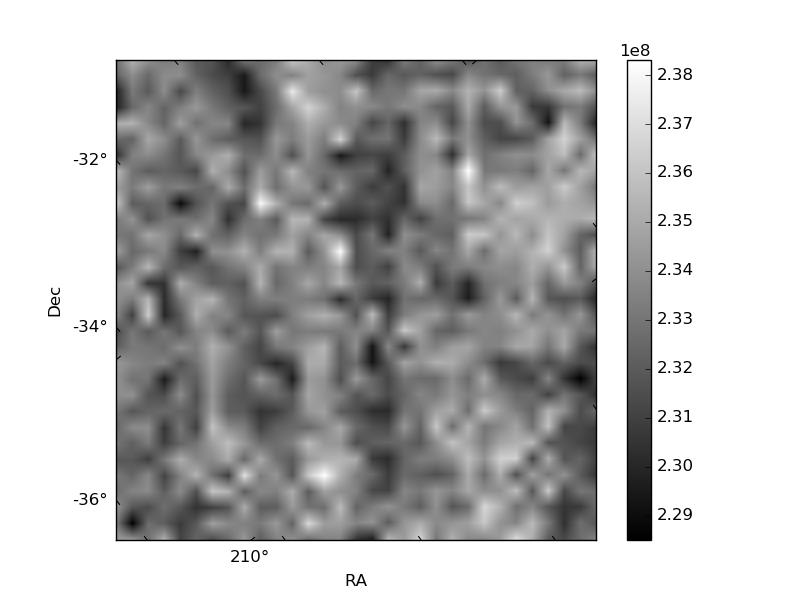
Histogram calculated using DETX and DETY for each event in the final _common_clean file
| Quadrant A | 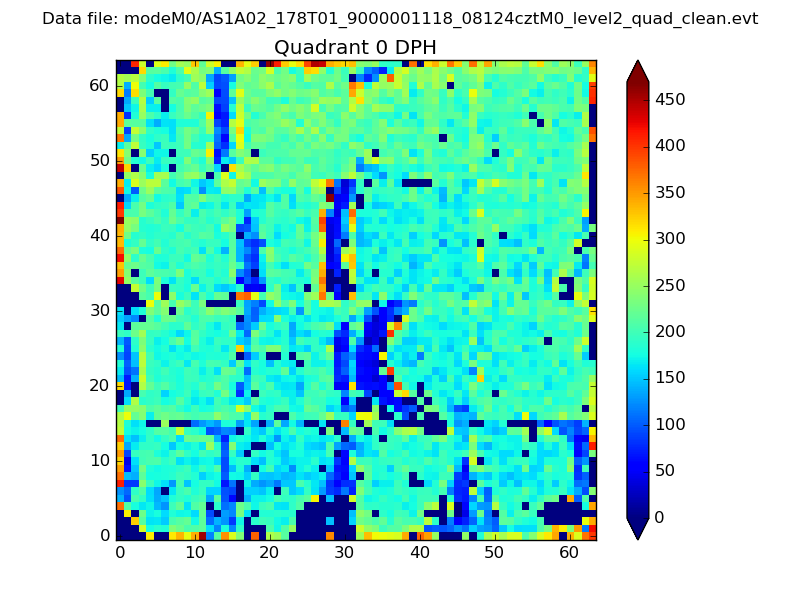 |
 |
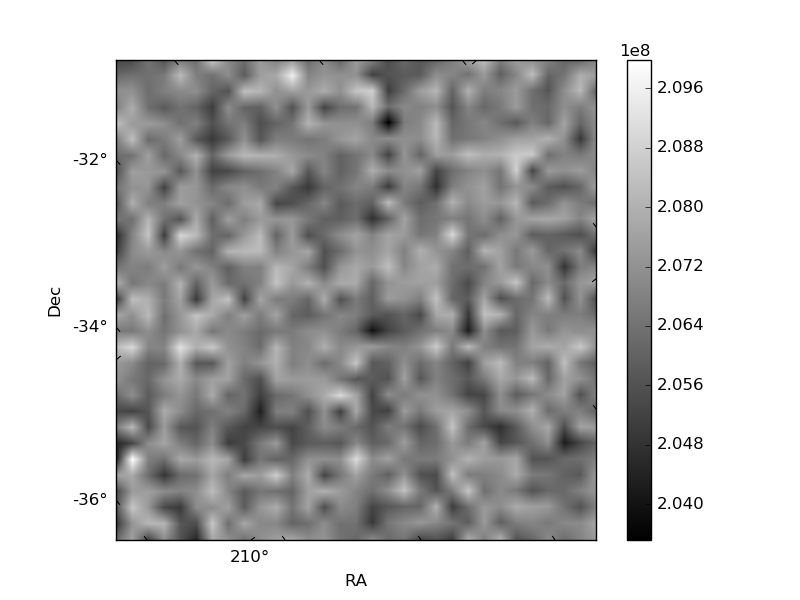
Quadrant B |
|---|---|---|---|
| Quadrant D | 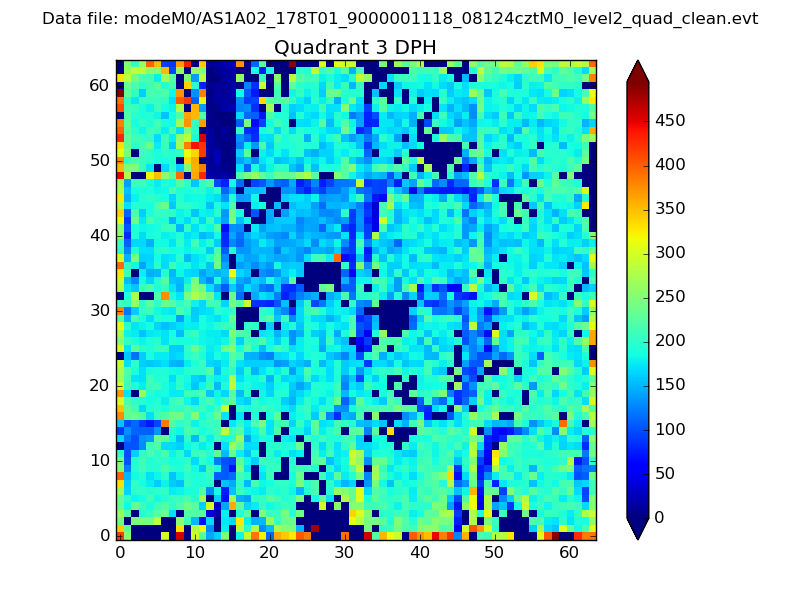 |
 |
Quadrant C |
| Plot type | Count rate plots | Images |
|---|---|---|
| Comparison with Poisson distribution Blue bars denote a histogram of data divided into 1 sec bins. Red curve is a Poisson curve with rate = median count rate of data. |
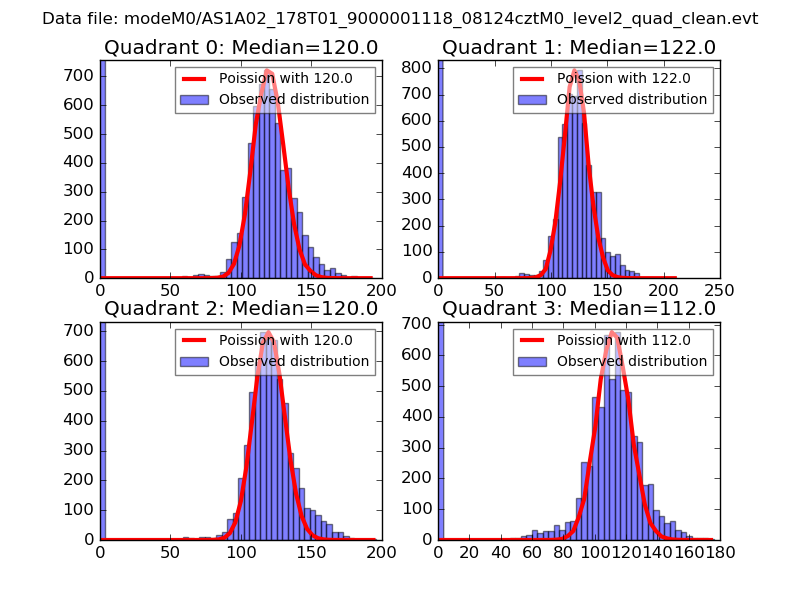 |
 |
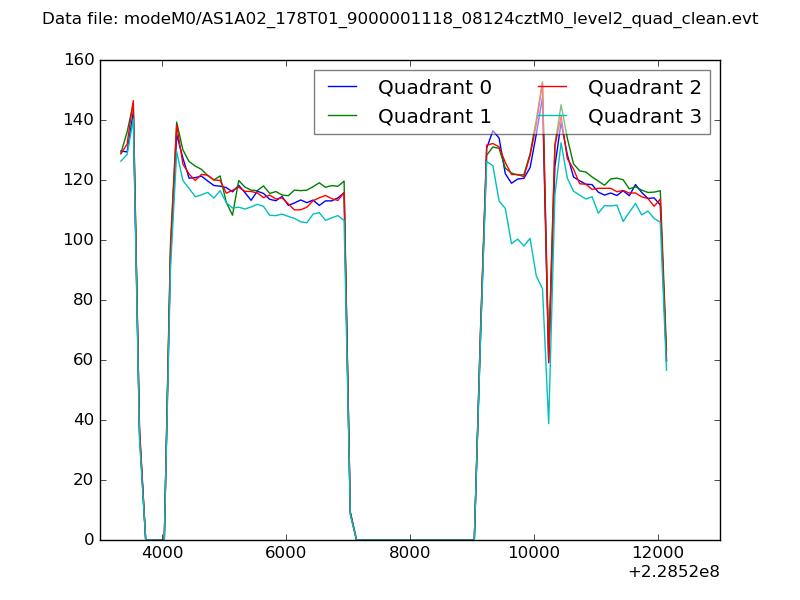
| Quadrant-wise count rates Data is divided into 100 sec bins |
 |
|
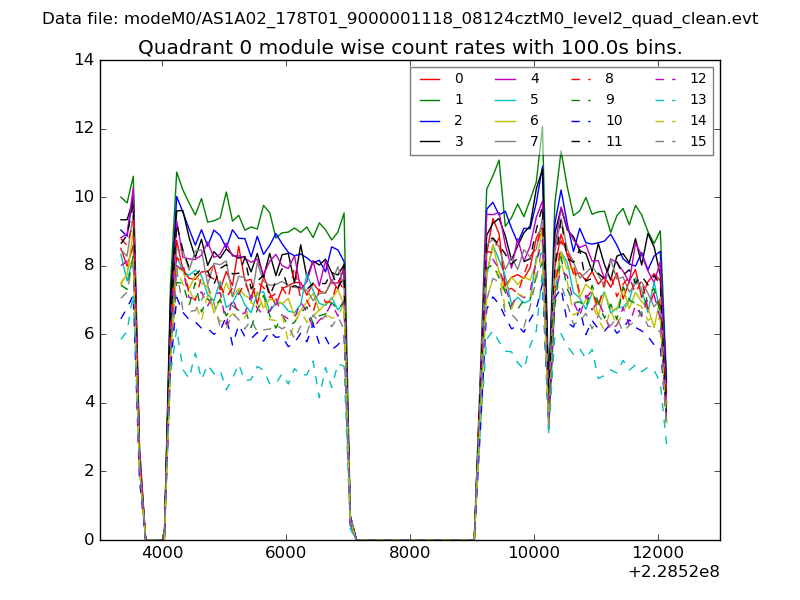
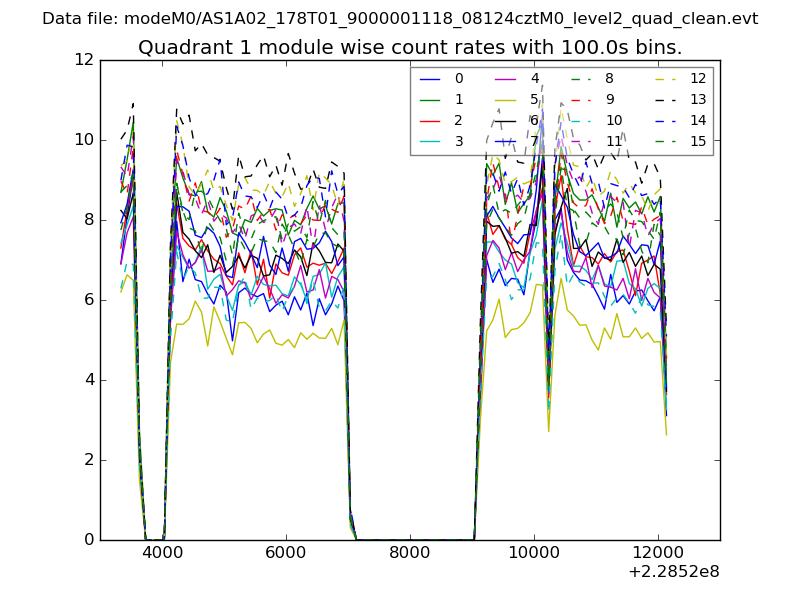
| Module-wise count rates for Quadrant A Data is divided into 100 sec bins |
 |
 |
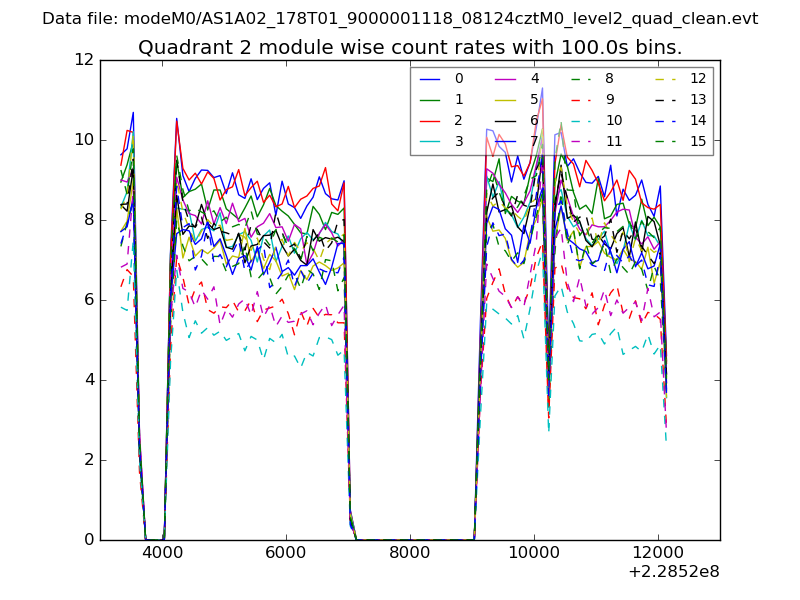
| Module-wise count rates for Quadrant B Data is divided into 100 sec bins |
 |
 |
| Module-wise count rates for Quadrant C Data is divided into 100 sec bins |
 |
 |
| Module-wise count rates for Quadrant D Data is divided into 100 sec bins |
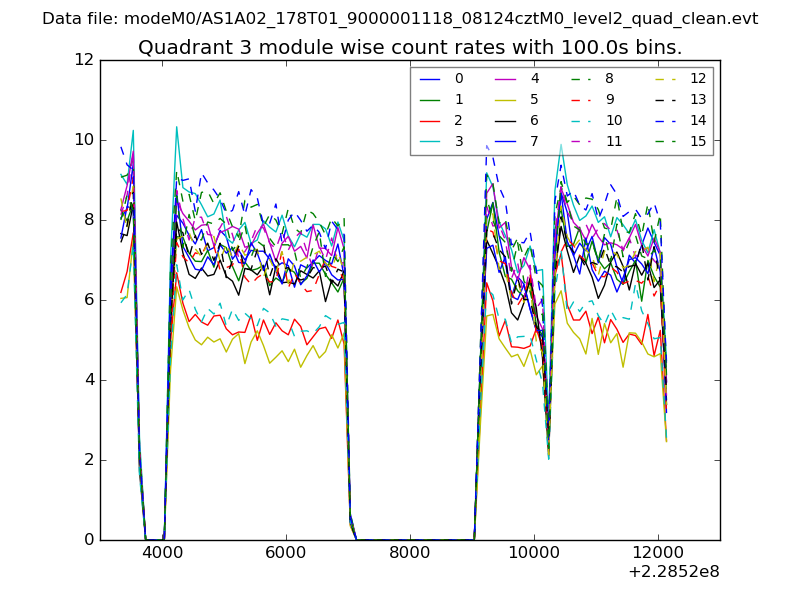 |
 |
| Parameter | Plot |
|---|---|
| CZT HV Monitor | 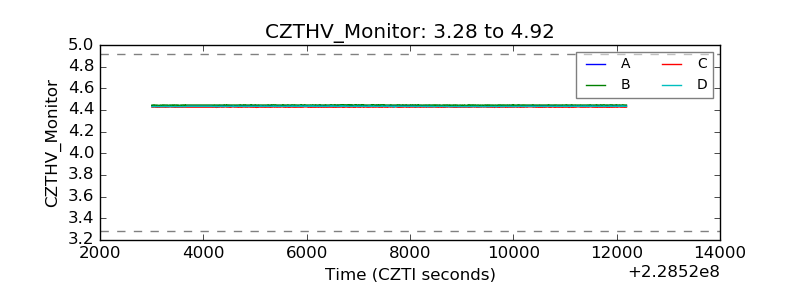 |
| D_VDD | 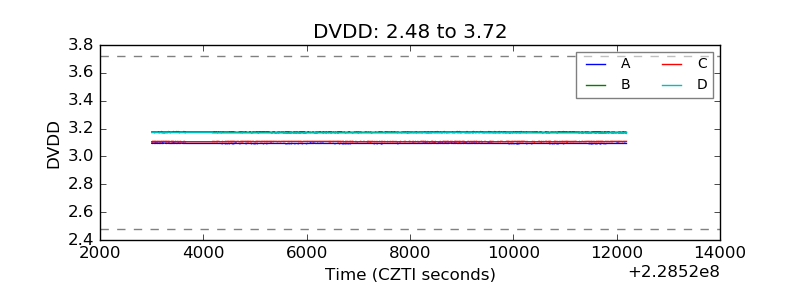 |
| Temperature 1 |  |
| Veto HV Monitor | 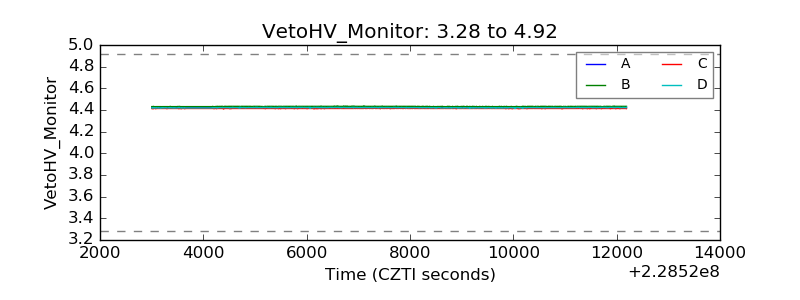 |
| Veto LLD | 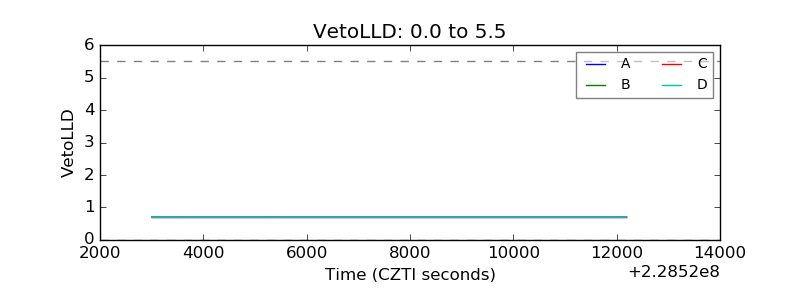 |
| Alpha Counter | 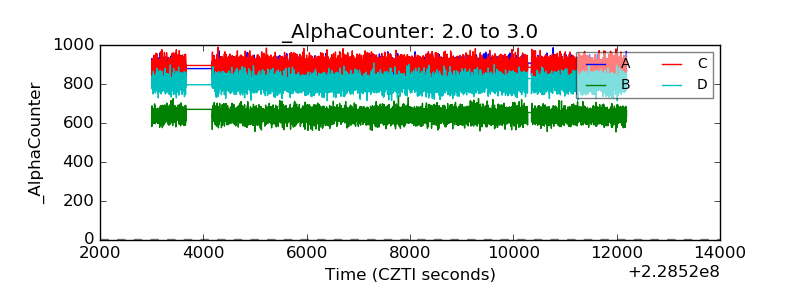 |
| _CPM_Rate | 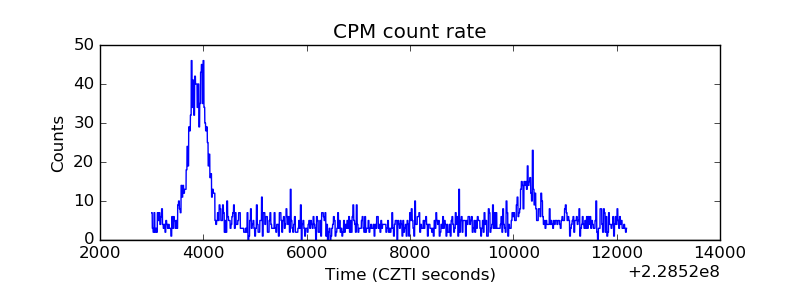 |
| CZT Counter | 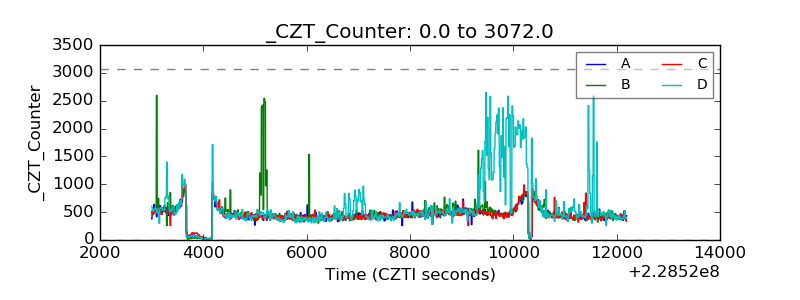 |
| +2.5 Volts monitor |  |
| +5 Volts monitor |  |
| _ROLL_ROT | 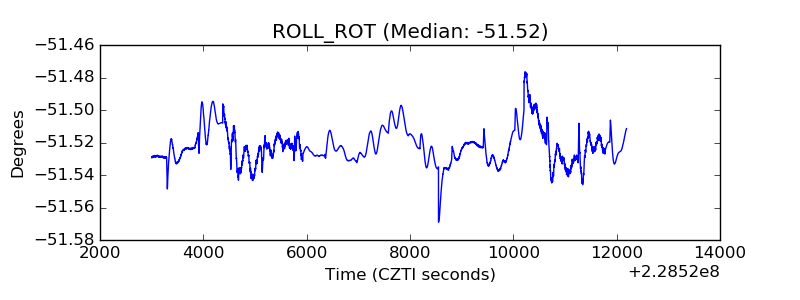 |
| _Roll_DEC | 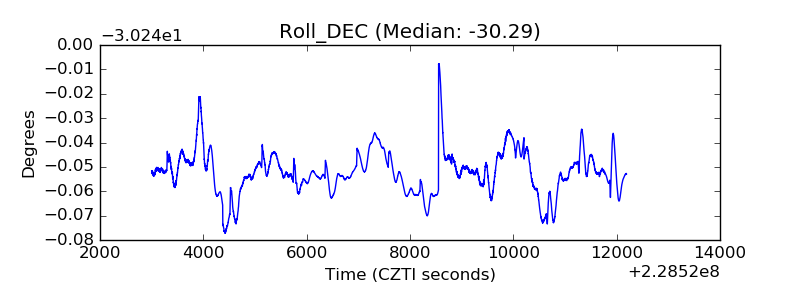 |
| _Roll_RA | 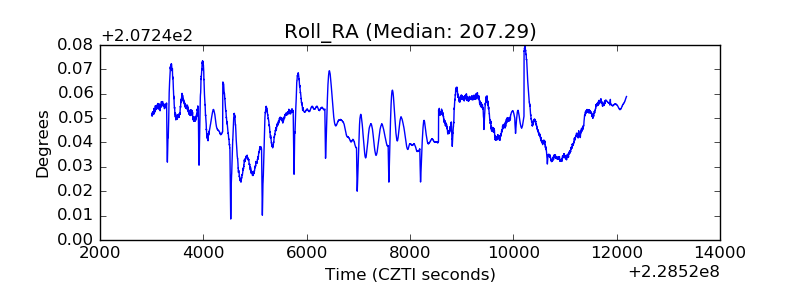 |
| Veto Counter | 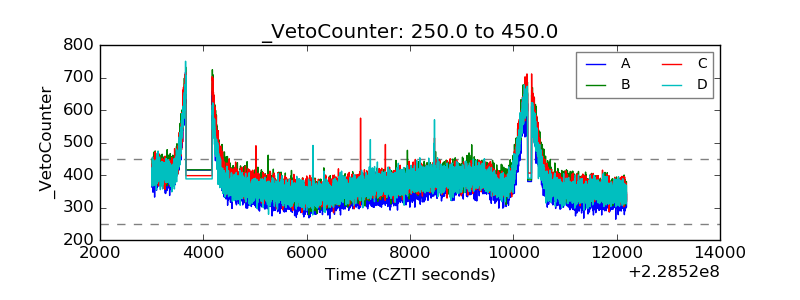 |