| Param | Original file | Final file |
|---|---|---|
| Filename | modeM0/AS1A02_178T01_9000001118_08128cztM0_level2.evt | modeM0/AS1A02_178T01_9000001118_08128cztM0_level2_quad_clean.evt |
| Size (bytes) | 797,578,560 | 158,817,600 |
| Size | 760.6 MB | 151.5 MB |
| Events in quadrant A | 5,639,810 | 989,524 |
| Events in quadrant B | 6,118,188 | 1,010,912 |
| Events in quadrant C | 5,657,285 | 992,149 |
| Events in quadrant D | 5,892,375 | 953,654 |
| Mode SS | |||
|---|---|---|---|
| Quadrant | BADHDUFLAG | Total packets | Discarded packets |
| A | 0 | 256 | 0 |
| B | 0 | 256 | 0 |
| C | 0 | 256 | 0 |
| D | 0 | 256 | 0 |
| Mode M0 | |||
|---|---|---|---|
| Quadrant | BADHDUFLAG | Total packets | Discarded packets |
| A | 0 | 25568 | 23 |
| B | 0 | 26478 | 17 |
| C | 0 | 25585 | 6 |
| D | 0 | 26526 | 14 |
| Mode M9 | |||
|---|---|---|---|
| Quadrant | BADHDUFLAG | Total packets | Discarded packets |
| A | 0 | 11 | 0 |
| B | 0 | 10 | 0 |
| C | 0 | 10 | 0 |
| D | 0 | 10 | 0 |
| Quadrant | Total seconds | Saturated seconds | Saturation percentage |
|---|---|---|---|
| A | 12494 | 216 | 1.728830% |
| B | 12497 | 289 | 2.312555% |
| C | 12503 | 223 | 1.783572% |
| D | 12499 | 247 | 1.976158% |
Noise dominated data is calculated using 1-second bins in cleaned event files. If a bin has >2000 counts, and if more than 50% of those come from <1% of pixels, then it is considered to be noise-dominated and hence unusable.
| Quadrant | # 1 sec bins | Bins with >0 counts | Bins with >2000 counts | High rate bins dominated by noise | Noise dominated (total time) | Noise dominated (detector-on time) | Marked lightcurve |
|---|---|---|---|---|---|---|---|
| A | 13005 | 12509 | 0 | 0 | 0.00% | 0.00% | 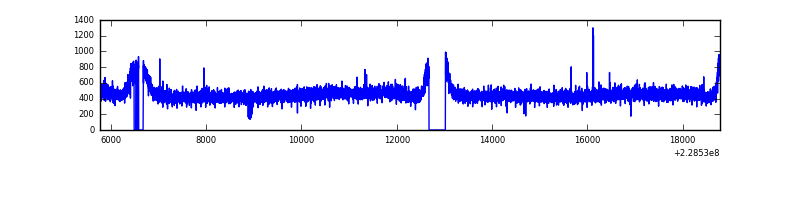 |
| B | 13005 | 12508 | 33 | 33 | 0.25% | 0.26% | 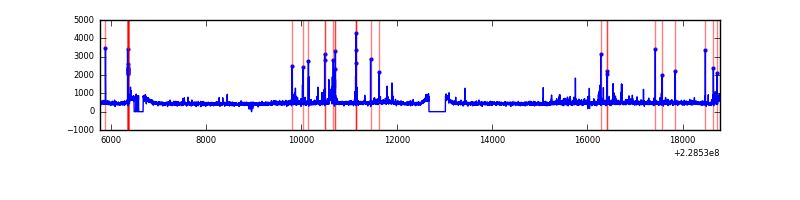 |
| C | 13005 | 12507 | 0 | 0 | 0.00% | 0.00% | 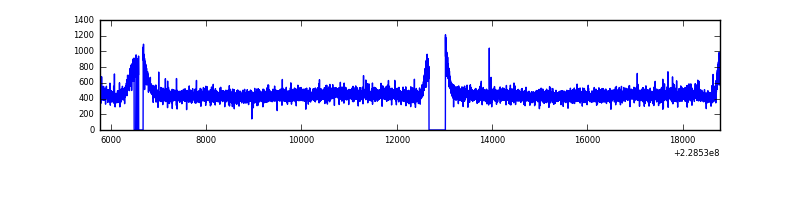 |
| D | 13004 | 12508 | 49 | 49 | 0.38% | 0.39% | 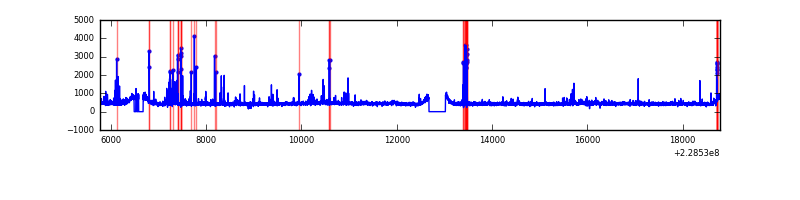 |
Top three noisy pixels from each quadrant. If the there are fewer than three noisy pixels in the level2.evt file, extra rows are filled as -1
| Pixel properties | Quadrant properties | ||||||
|---|---|---|---|---|---|---|---|
| Quadrant | DetID | PixID | Counts | Sigma | Mean | Median | Sigma |
| A | 0 | 226 | 13689 | 41.03 | 1461 | 1426 | 298.9 |
| A | 12 | 194 | 13076 | 38.98 | 1461 | 1426 | 298.9 |
| A | 8 | 15 | 12214 | 36.1 | 1461 | 1426 | 298.9 |
| B | 10 | 16 | 206896 | 733.85 | 1471 | 1435 | 280.0 |
| B | 0 | 214 | 100424 | 353.56 | 1471 | 1435 | 280.0 |
| B | 0 | 219 | 44682 | 154.47 | 1471 | 1435 | 280.0 |
| C | 1 | 16 | 50311 | 147.55 | 1436 | 1438 | 331.2 |
| C | 13 | 61 | 10873 | 28.49 | 1436 | 1438 | 331.2 |
| C | 8 | 222 | 5914 | 13.51 | 1436 | 1438 | 331.2 |
| D | 1 | 52 | 141524 | 396.42 | 1417 | 1379 | 353.5 |
| D | 12 | 233 | 133048 | 372.45 | 1417 | 1379 | 353.5 |
| D | 13 | 122 | 91403 | 254.65 | 1417 | 1379 | 353.5 |
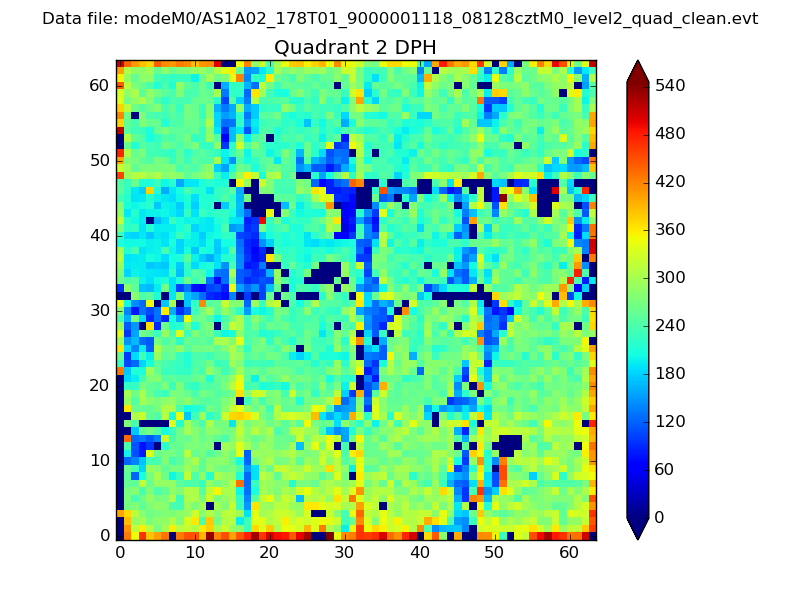
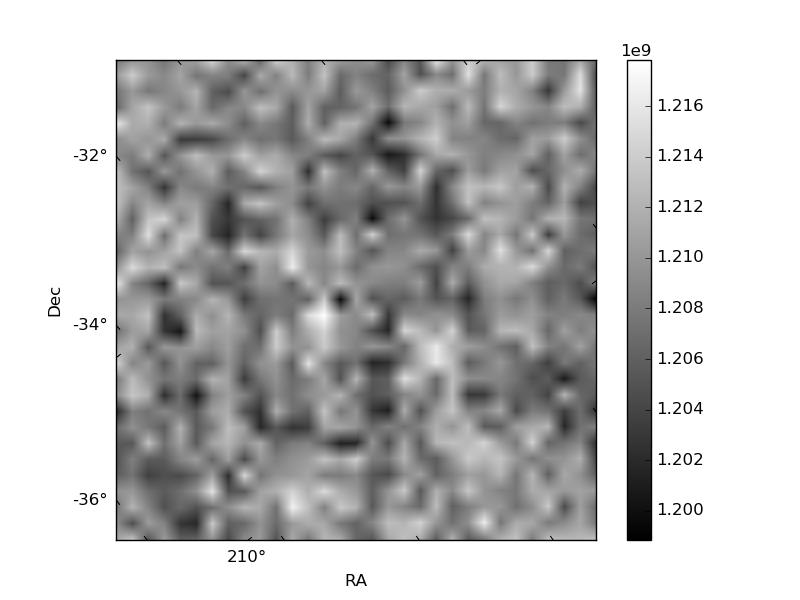
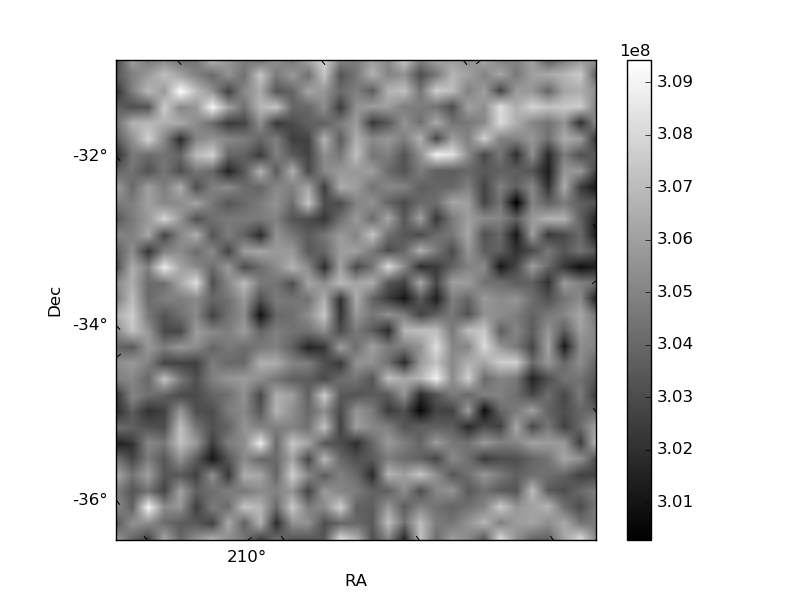
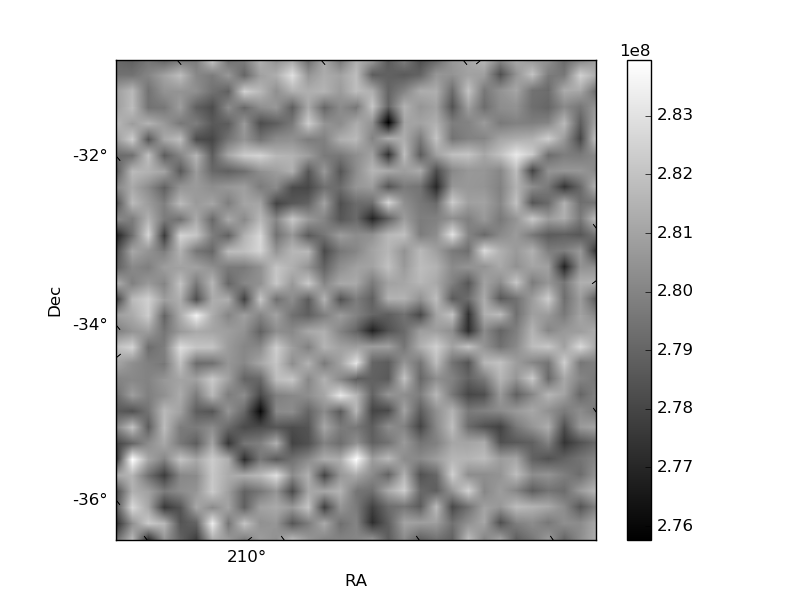
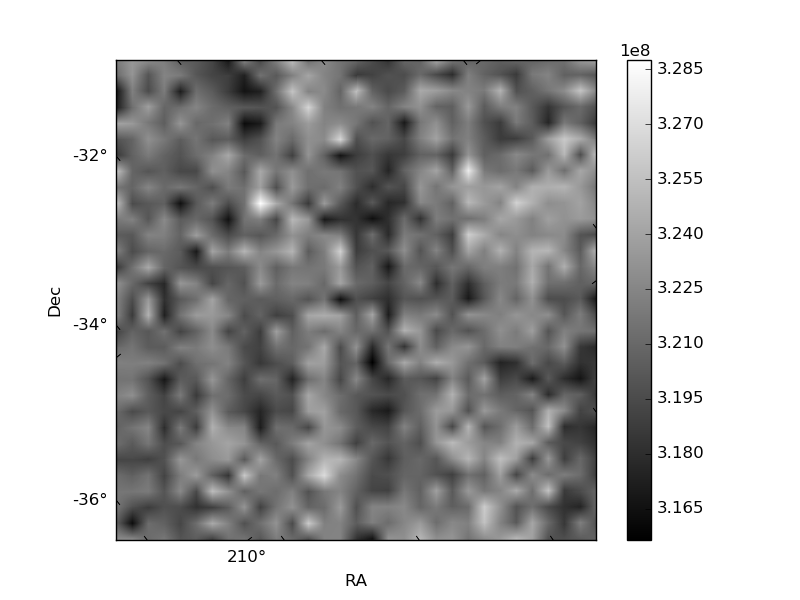
Histogram calculated using DETX and DETY for each event in the final _common_clean file
| Quadrant A | 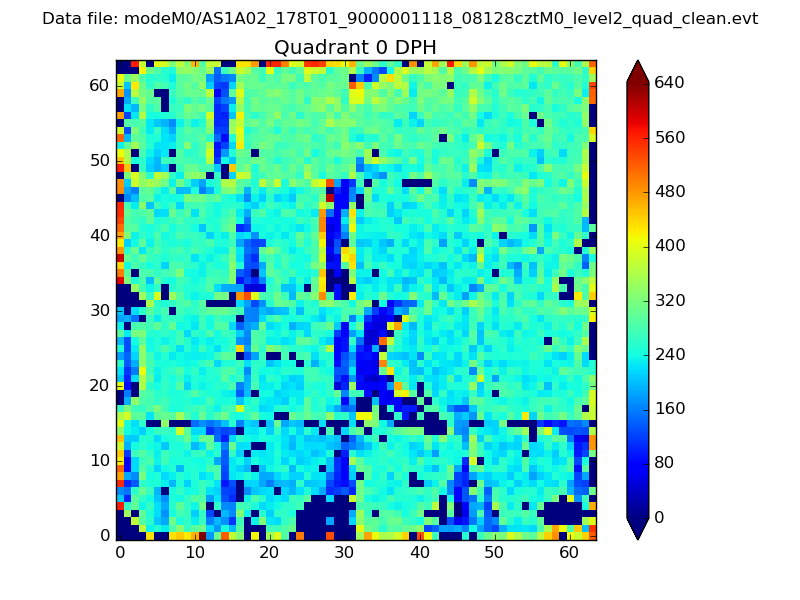 |
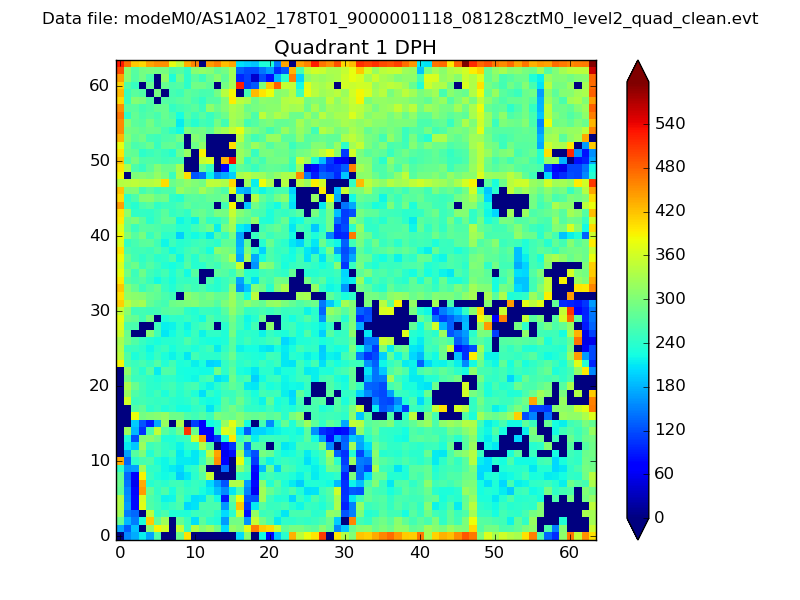 |
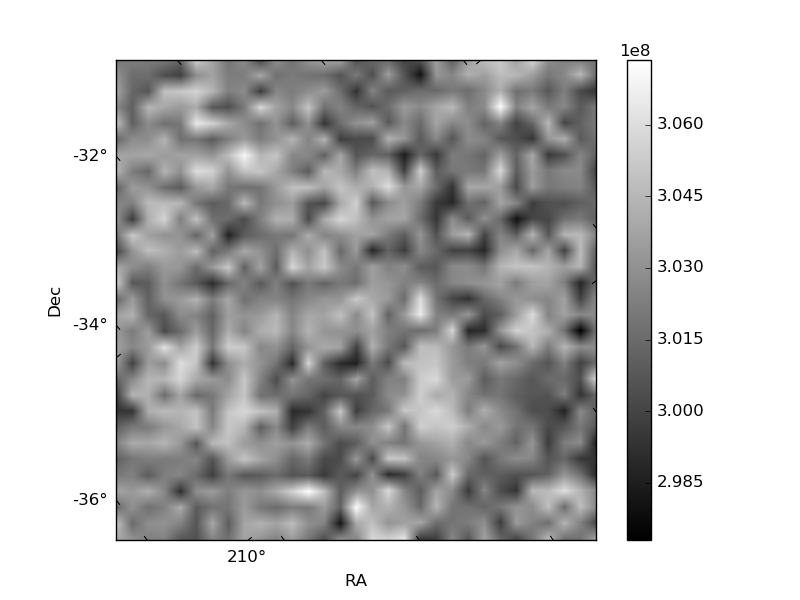
Quadrant B |
|---|---|---|---|
| Quadrant D | 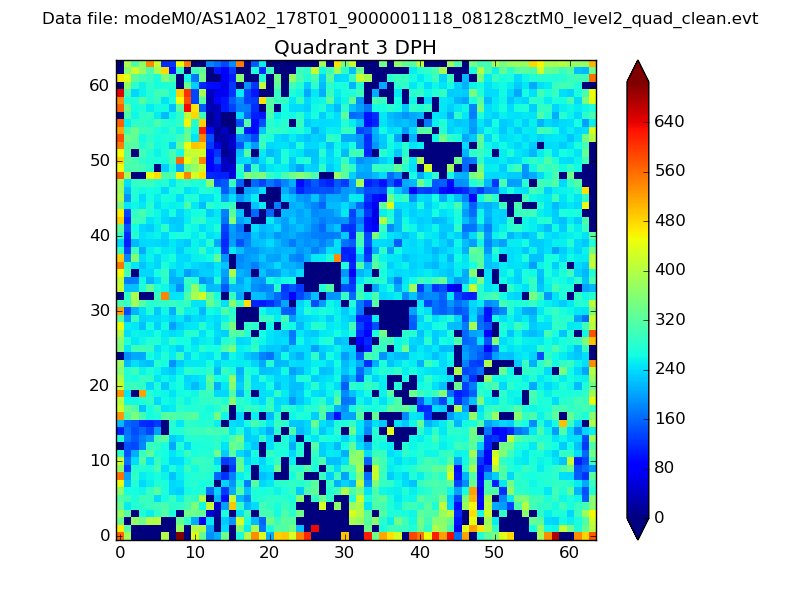 |
 |
Quadrant C |
| Plot type | Count rate plots | Images |
|---|---|---|
| Comparison with Poisson distribution Blue bars denote a histogram of data divided into 1 sec bins. Red curve is a Poisson curve with rate = median count rate of data. |
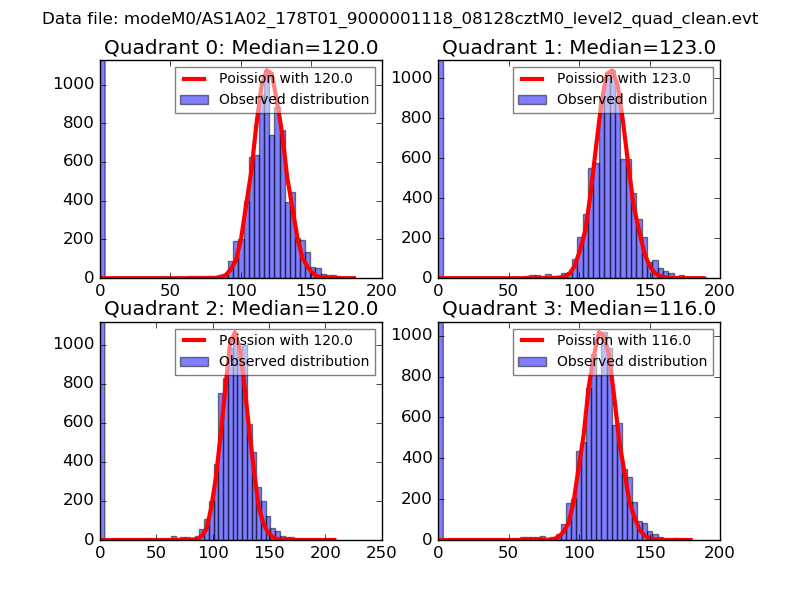 |
 |
| Quadrant-wise count rates Data is divided into 100 sec bins |
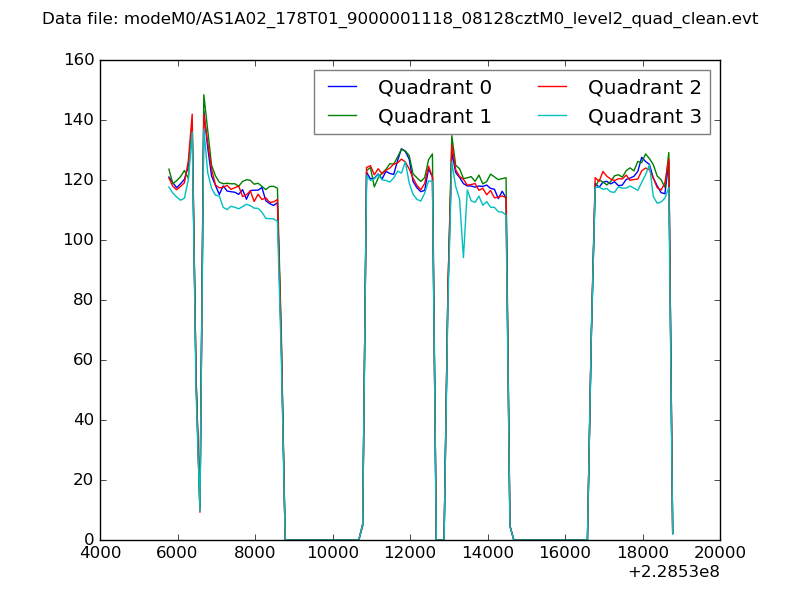 |
|
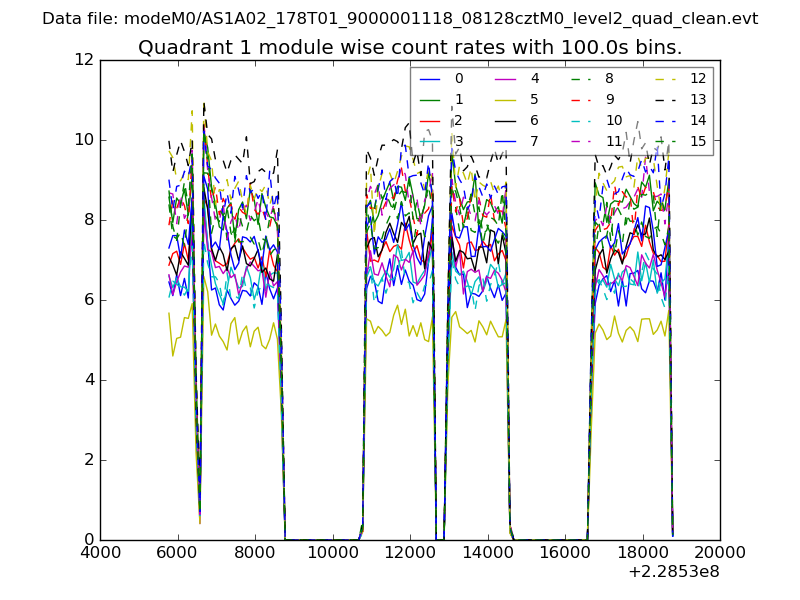
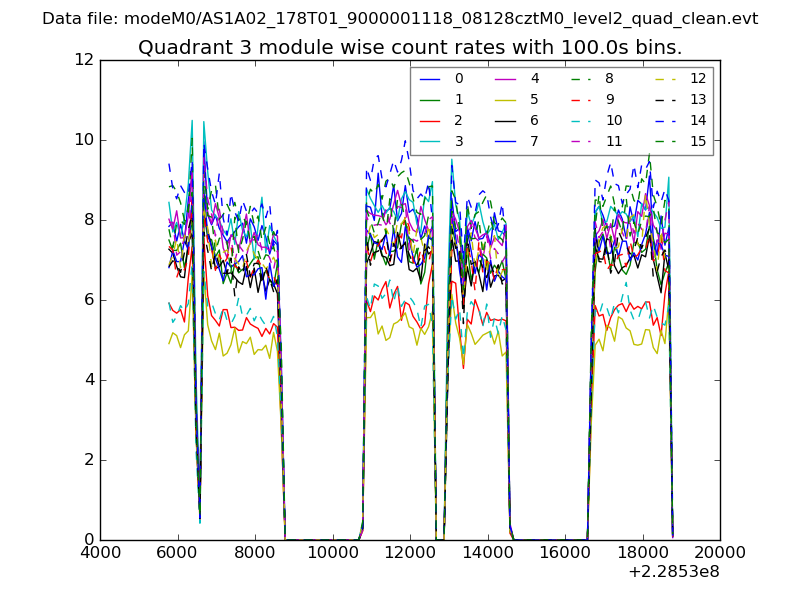
| Module-wise count rates for Quadrant A Data is divided into 100 sec bins |
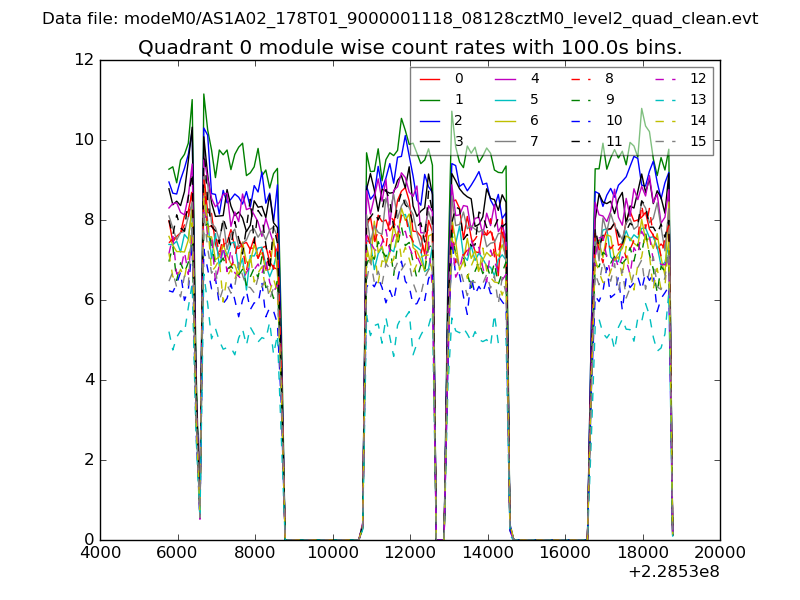 |
 |
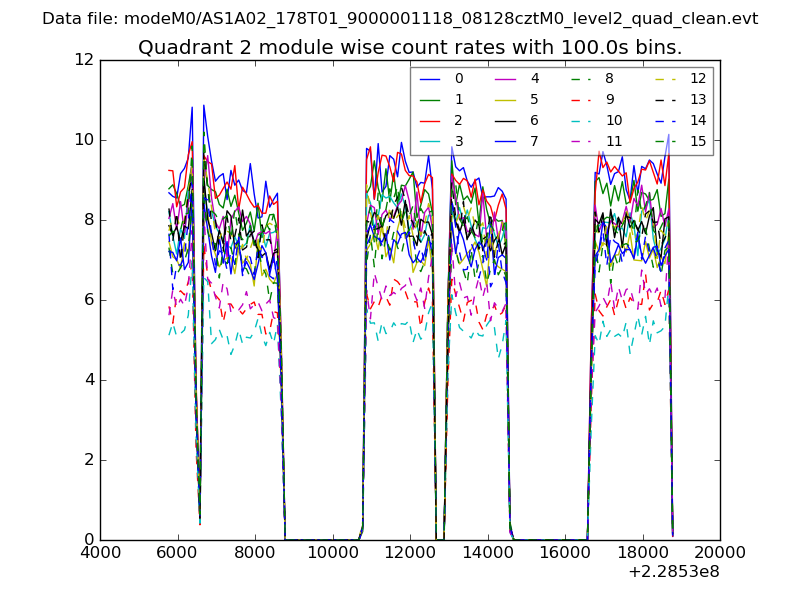
| Module-wise count rates for Quadrant B Data is divided into 100 sec bins |
 |
 |
| Module-wise count rates for Quadrant C Data is divided into 100 sec bins |
 |
 |
| Module-wise count rates for Quadrant D Data is divided into 100 sec bins |
 |
 |
| Parameter | Plot |
|---|---|
| CZT HV Monitor | 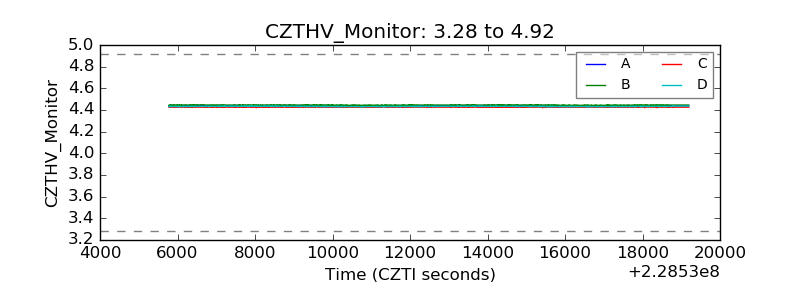 |
| D_VDD | 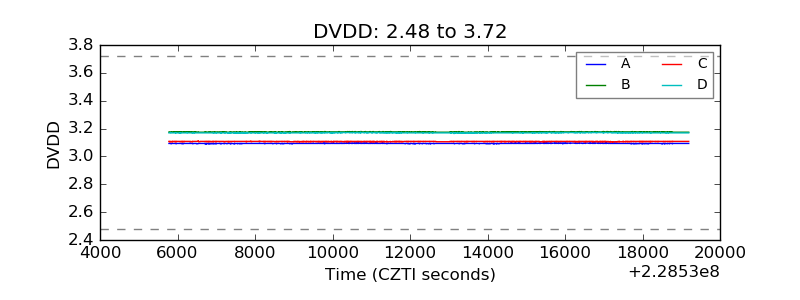 |
| Temperature 1 | 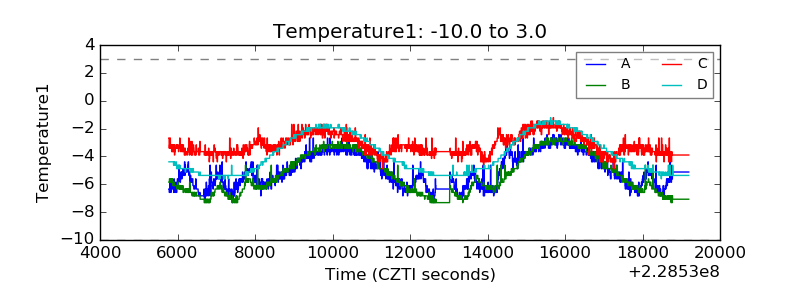 |
| Veto HV Monitor | 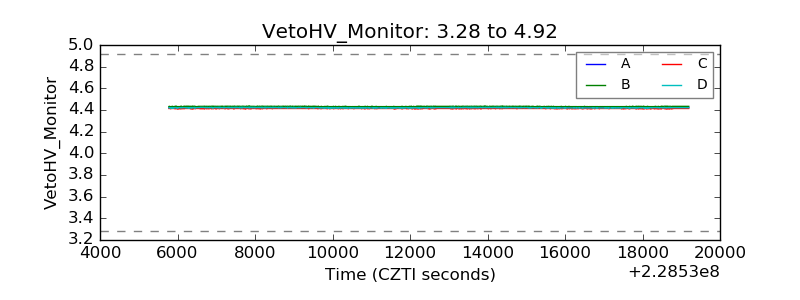 |
| Veto LLD | 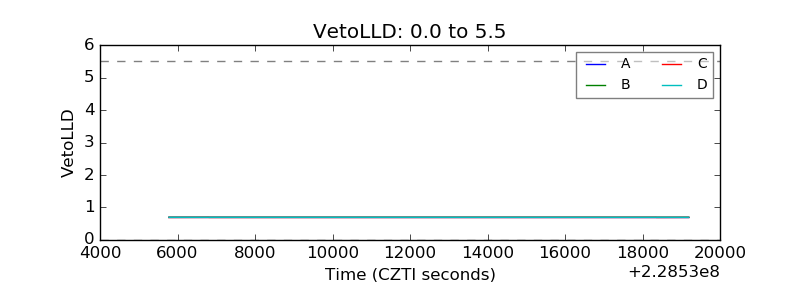 |
| Alpha Counter | 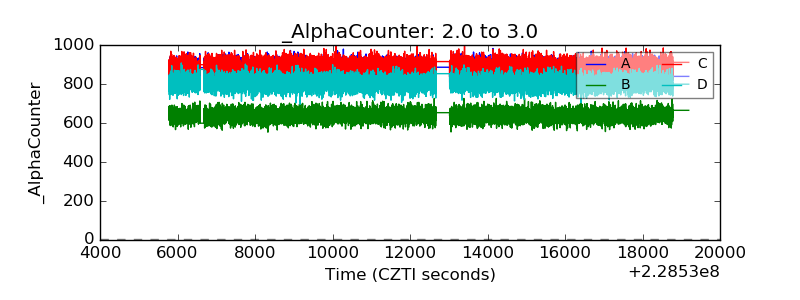 |
| _CPM_Rate | 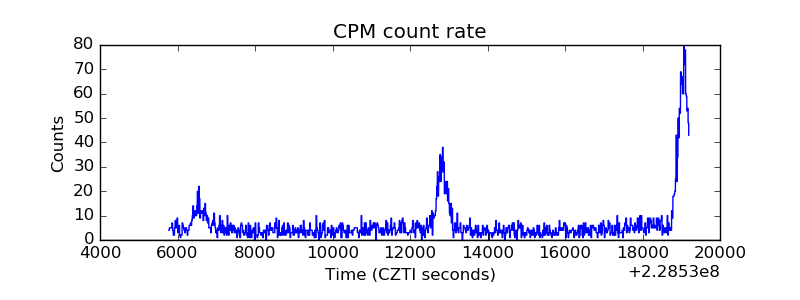 |
| CZT Counter | 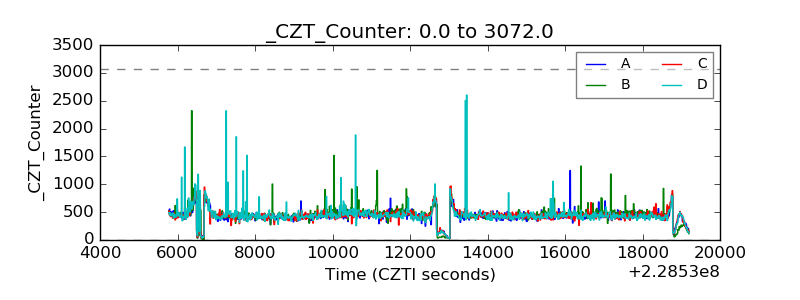 |
| +2.5 Volts monitor |  |
| +5 Volts monitor |  |
| _ROLL_ROT | 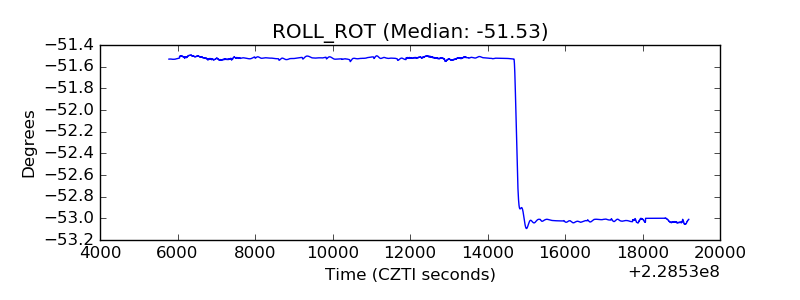 |
| _Roll_DEC | 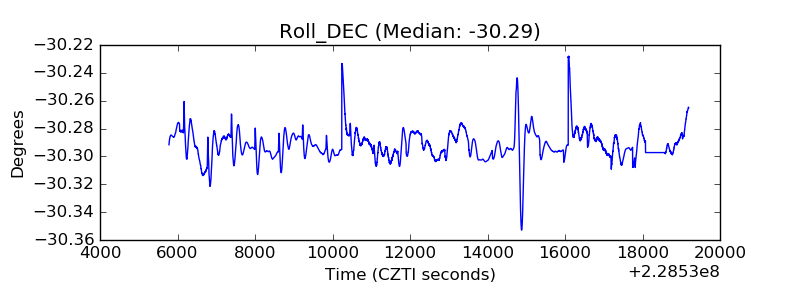 |
| _Roll_RA | 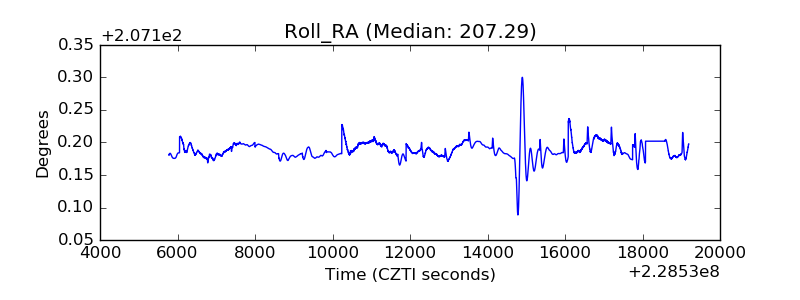 |
| Veto Counter | 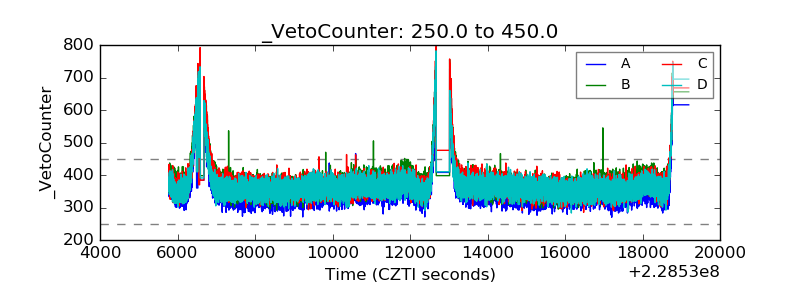 |