| Param | Original file | Final file |
|---|---|---|
| Filename | modeM0/AS1A02_178T01_9000001118_08129cztM0_level2.evt | modeM0/AS1A02_178T01_9000001118_08129cztM0_level2_quad_clean.evt |
| Size (bytes) | 885,545,280 | 162,887,040 |
| Size | 844.5 MB | 155.3 MB |
| Events in quadrant A | 6,337,595 | 997,983 |
| Events in quadrant B | 6,627,938 | 1,014,845 |
| Events in quadrant C | 6,326,893 | 1,000,856 |
| Events in quadrant D | 6,592,797 | 967,600 |
| Mode SS | |||
|---|---|---|---|
| Quadrant | BADHDUFLAG | Total packets | Discarded packets |
| A | 0 | 282 | 0 |
| B | 0 | 282 | 0 |
| C | 0 | 282 | 0 |
| D | 0 | 282 | 0 |
| Mode M0 | |||
|---|---|---|---|
| Quadrant | BADHDUFLAG | Total packets | Discarded packets |
| A | 0 | 28194 | 12 |
| B | 0 | 28702 | 3 |
| C | 0 | 28319 | 6 |
| D | 0 | 29308 | 3 |
| Mode M9 | |||
|---|---|---|---|
| Quadrant | BADHDUFLAG | Total packets | Discarded packets |
| A | 0 | 22 | 0 |
| B | 0 | 22 | 0 |
| C | 0 | 22 | 0 |
| D | 0 | 22 | 0 |
| Quadrant | Total seconds | Saturated seconds | Saturation percentage |
|---|---|---|---|
| A | 13773 | 187 | 1.357729% |
| B | 13777 | 225 | 1.633157% |
| C | 13776 | 160 | 1.161440% |
| D | 13777 | 189 | 1.371852% |
Noise dominated data is calculated using 1-second bins in cleaned event files. If a bin has >2000 counts, and if more than 50% of those come from <1% of pixels, then it is considered to be noise-dominated and hence unusable.
| Quadrant | # 1 sec bins | Bins with >0 counts | Bins with >2000 counts | High rate bins dominated by noise | Noise dominated (total time) | Noise dominated (detector-on time) | Marked lightcurve |
|---|---|---|---|---|---|---|---|
| A | 15987 | 13778 | 0 | 0 | 0.00% | 0.00% | 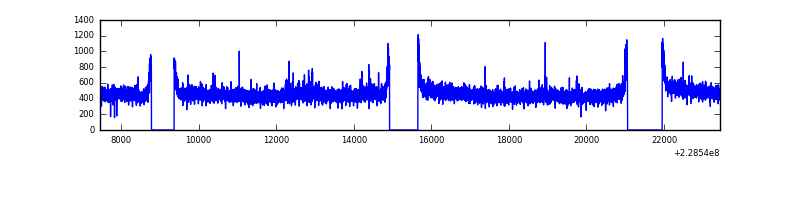 |
| B | 15987 | 13778 | 24 | 24 | 0.15% | 0.17% | 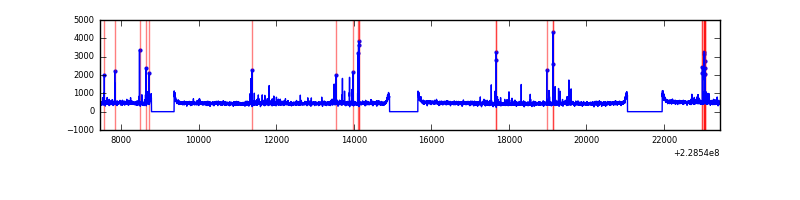 |
| C | 15987 | 13778 | 1 | 1 | 0.01% | 0.01% | 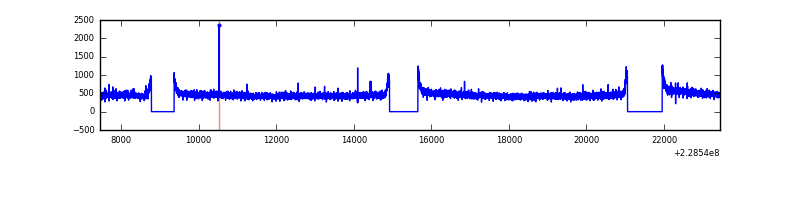 |
| D | 15987 | 13777 | 33 | 33 | 0.21% | 0.24% | 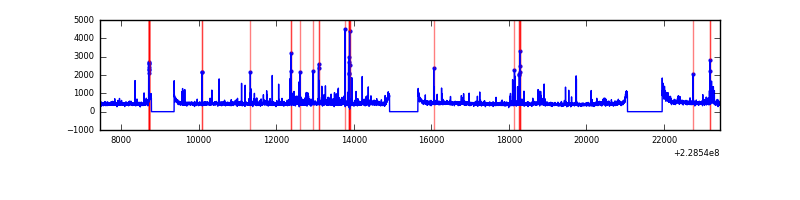 |
Top three noisy pixels from each quadrant. If the there are fewer than three noisy pixels in the level2.evt file, extra rows are filled as -1
| Pixel properties | Quadrant properties | ||||||
|---|---|---|---|---|---|---|---|
| Quadrant | DetID | PixID | Counts | Sigma | Mean | Median | Sigma |
| A | 8 | 15 | 60744 | 177.48 | 1630 | 1591 | 333.3 |
| A | 0 | 226 | 15008 | 40.26 | 1630 | 1591 | 333.3 |
| A | 12 | 194 | 14689 | 39.3 | 1630 | 1591 | 333.3 |
| B | 10 | 16 | 143611 | 452.34 | 1637 | 1592 | 314.0 |
| B | 0 | 214 | 83604 | 261.21 | 1637 | 1592 | 314.0 |
| B | 12 | 111 | 34706 | 105.47 | 1637 | 1592 | 314.0 |
| C | 1 | 16 | 85276 | 225.92 | 1598 | 1602 | 370.4 |
| C | 13 | 61 | 12077 | 28.28 | 1598 | 1602 | 370.4 |
| C | 8 | 222 | 9197 | 20.51 | 1598 | 1602 | 370.4 |
| D | 1 | 52 | 355378 | 896.49 | 1582 | 1538 | 394.7 |
| D | 13 | 122 | 77625 | 192.77 | 1582 | 1538 | 394.7 |
| D | 7 | 71 | 67273 | 166.55 | 1582 | 1538 | 394.7 |
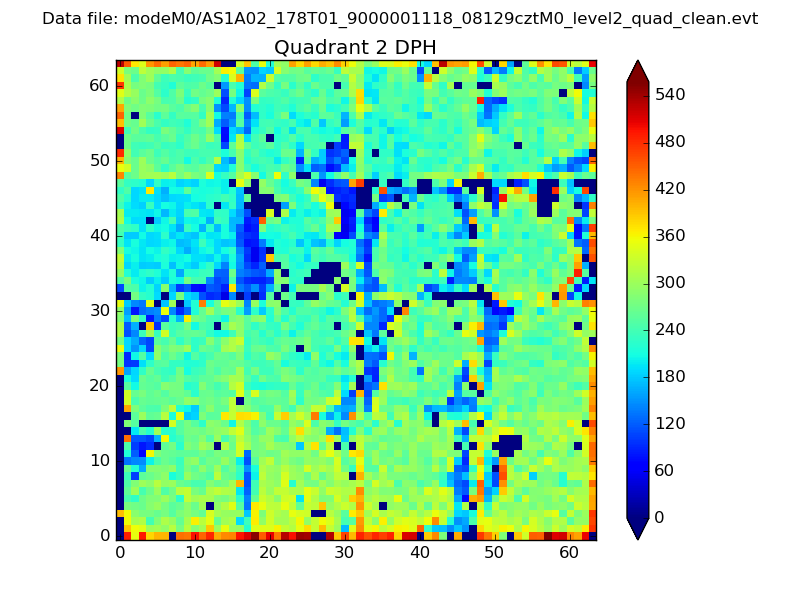
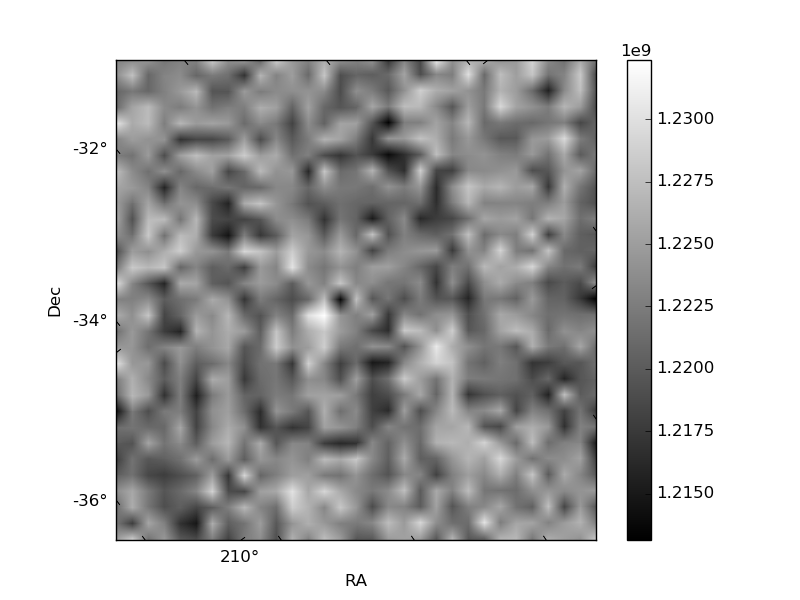
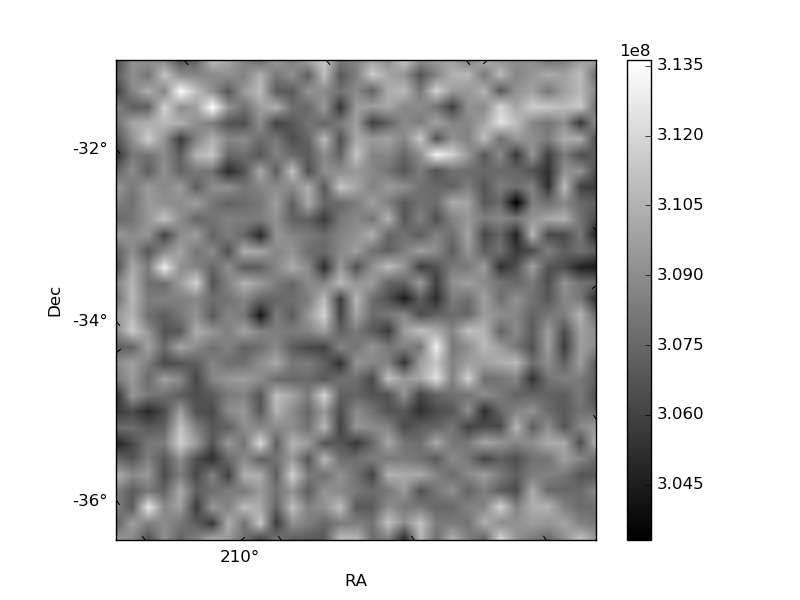
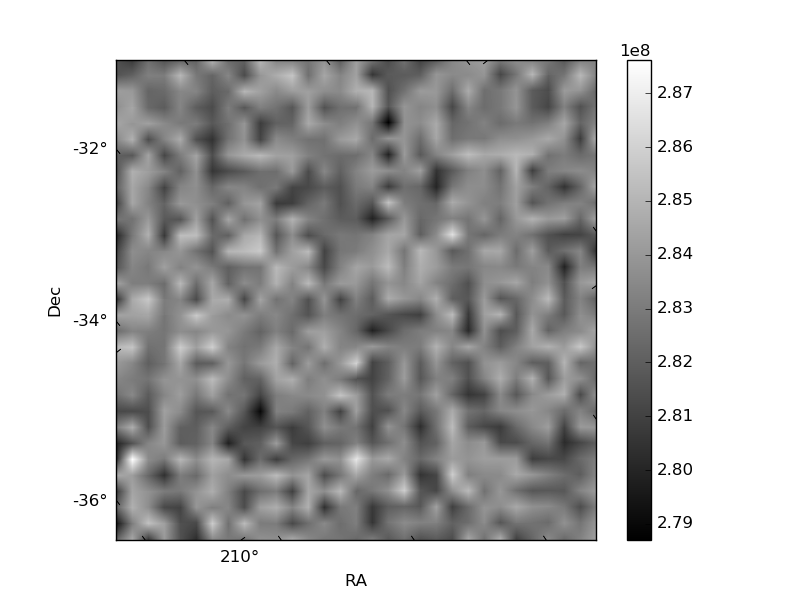
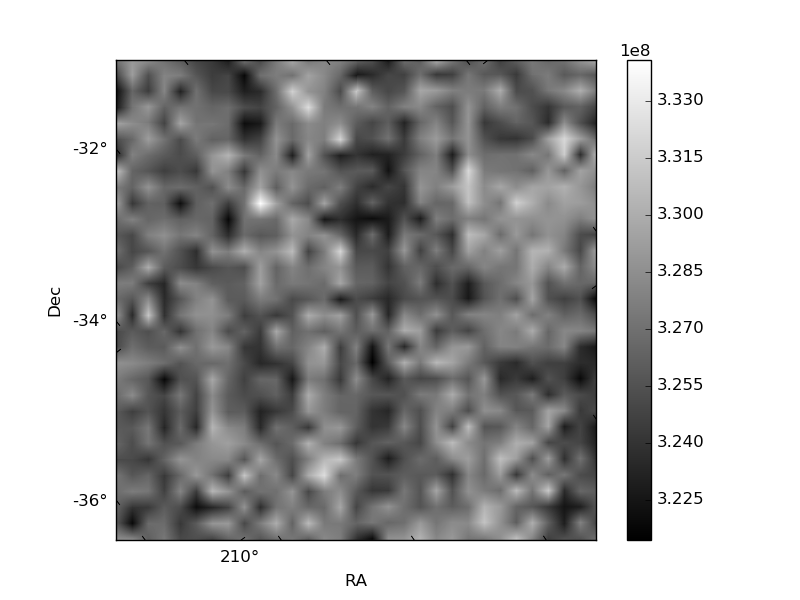
Histogram calculated using DETX and DETY for each event in the final _common_clean file
| Quadrant A | 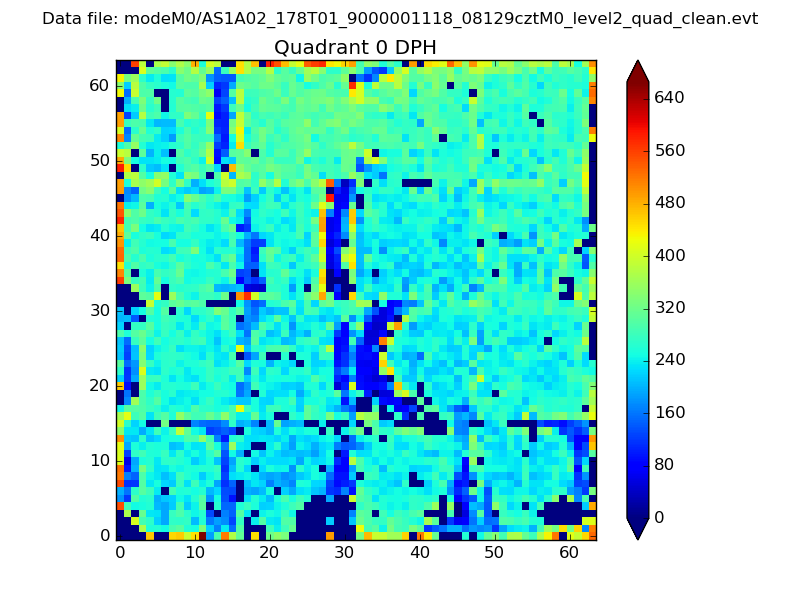 |
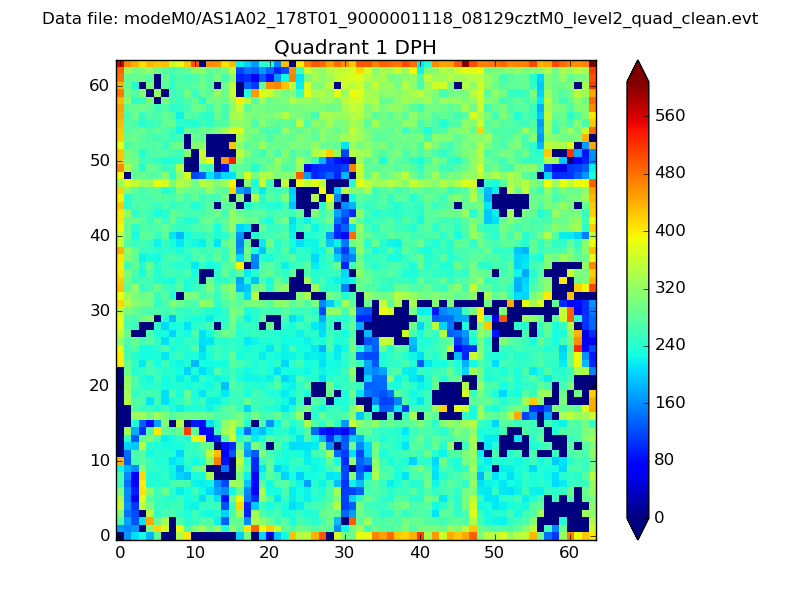 |
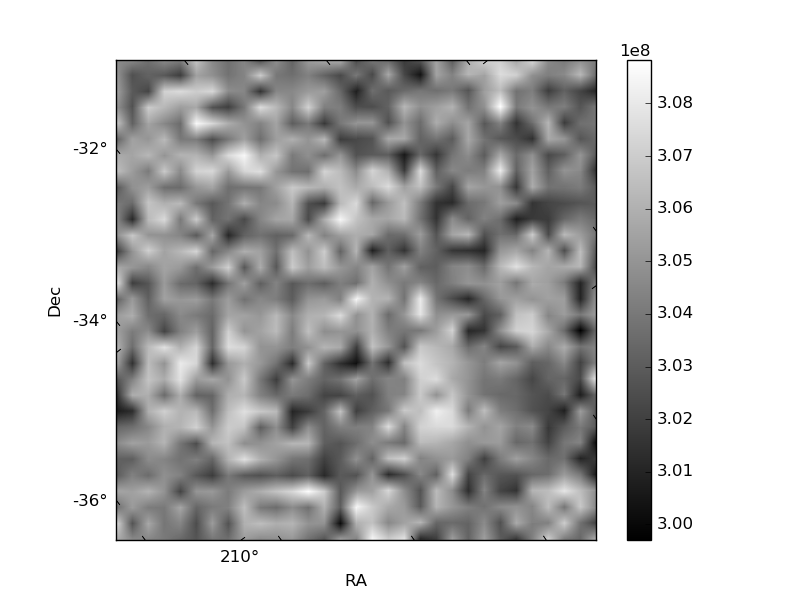
Quadrant B |
|---|---|---|---|
| Quadrant D | 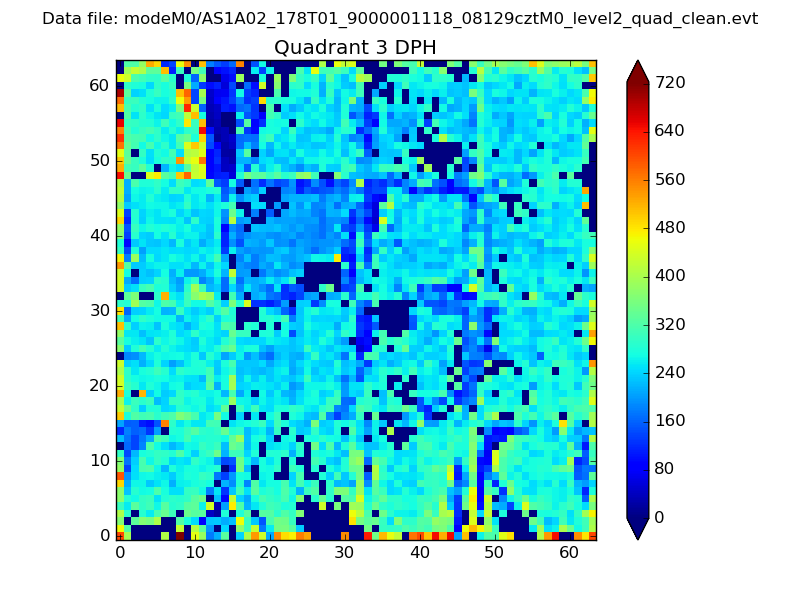 |
 |
Quadrant C |
| Plot type | Count rate plots | Images |
|---|---|---|
| Comparison with Poisson distribution Blue bars denote a histogram of data divided into 1 sec bins. Red curve is a Poisson curve with rate = median count rate of data. |
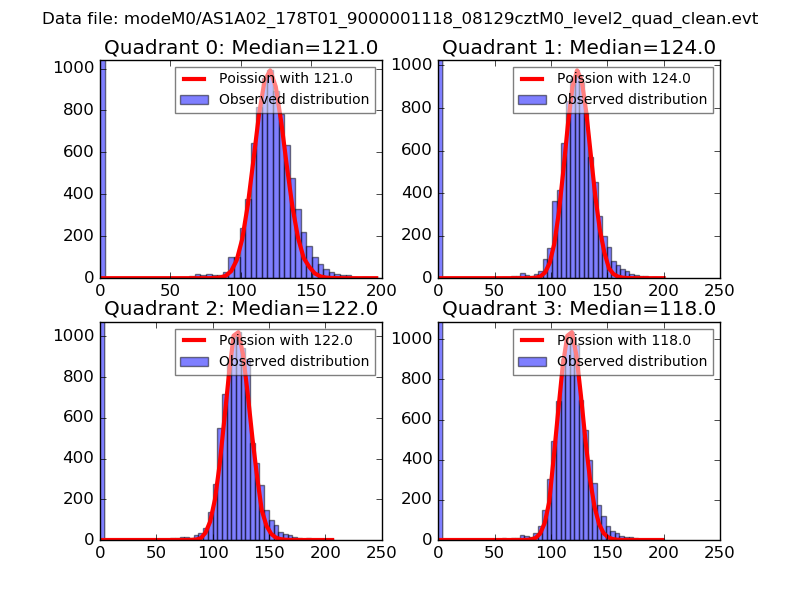 |
 |
| Quadrant-wise count rates Data is divided into 100 sec bins |
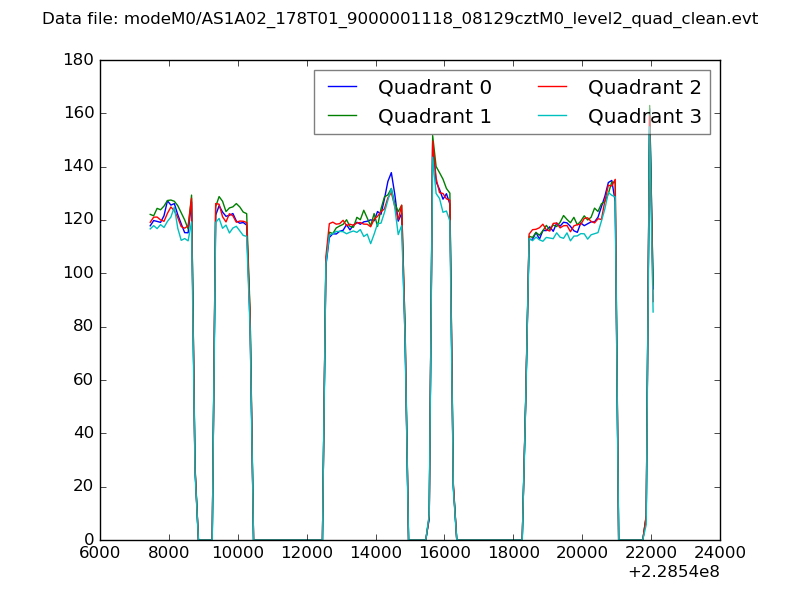 |
|
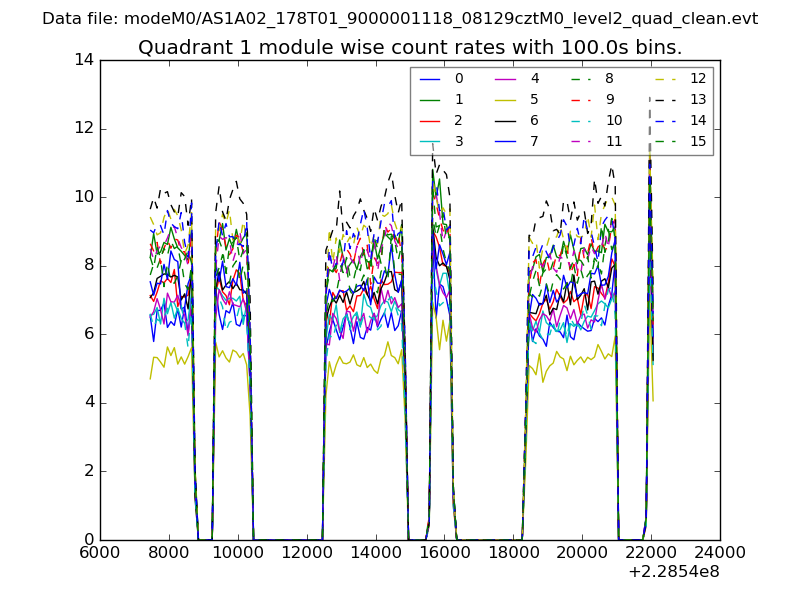
| Module-wise count rates for Quadrant A Data is divided into 100 sec bins |
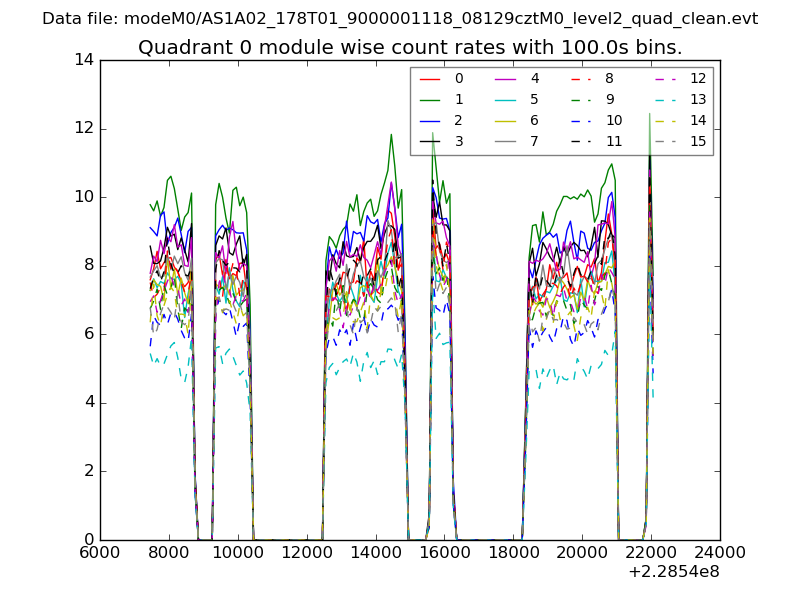 |
 |
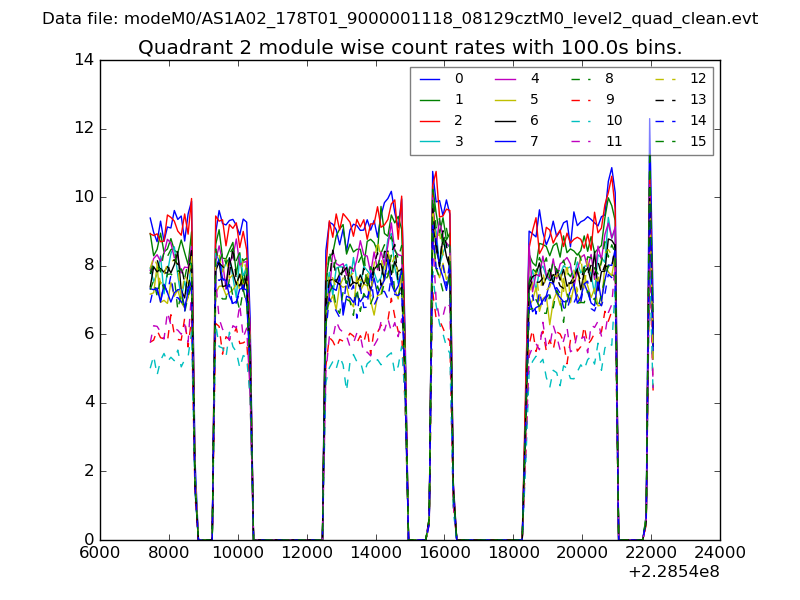
| Module-wise count rates for Quadrant B Data is divided into 100 sec bins |
 |
 |
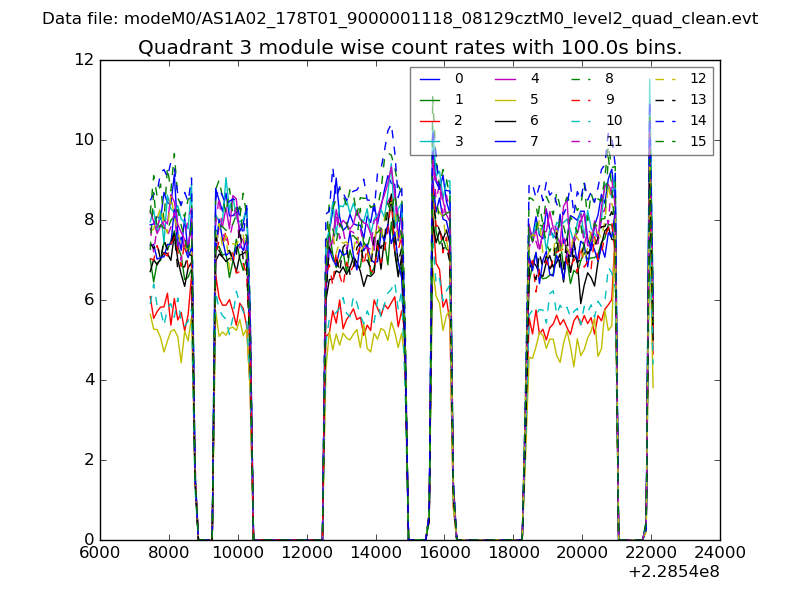
| Module-wise count rates for Quadrant C Data is divided into 100 sec bins |
 |
 |
| Module-wise count rates for Quadrant D Data is divided into 100 sec bins |
 |
 |
| Parameter | Plot |
|---|---|
| CZT HV Monitor | 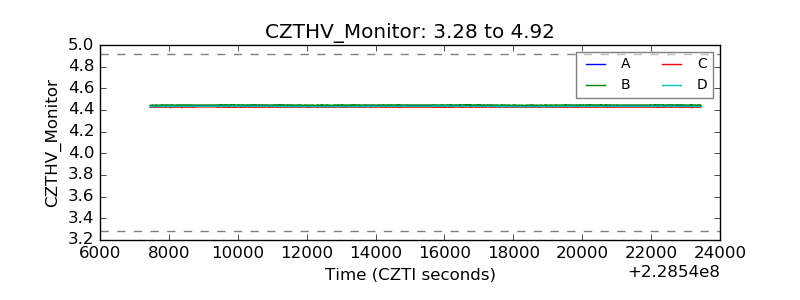 |
| D_VDD | 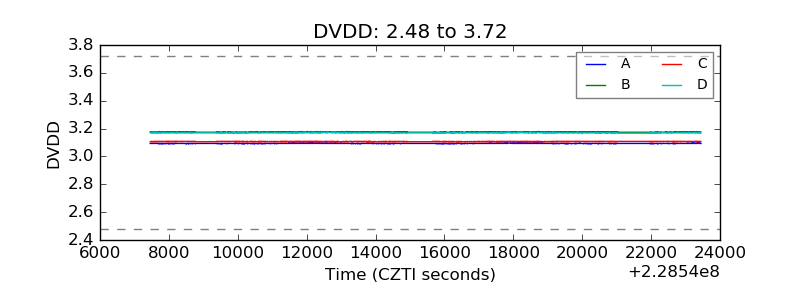 |
| Temperature 1 | 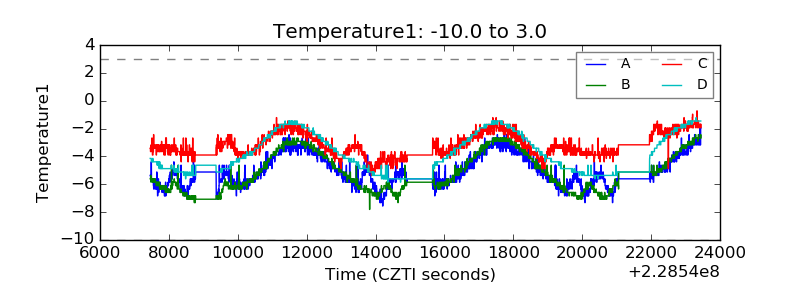 |
| Veto HV Monitor | 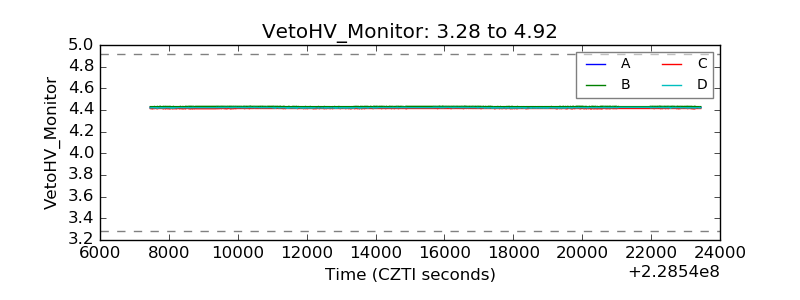 |
| Veto LLD | 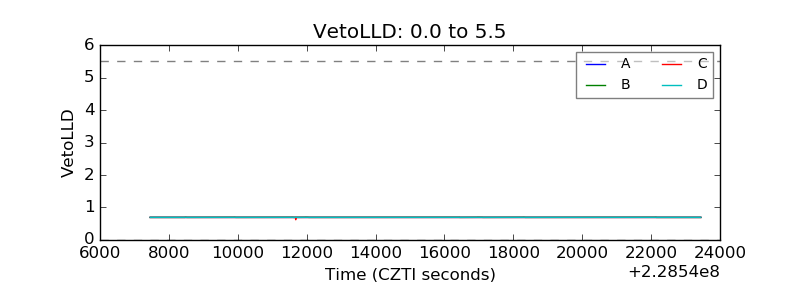 |
| Alpha Counter |  |
| _CPM_Rate | 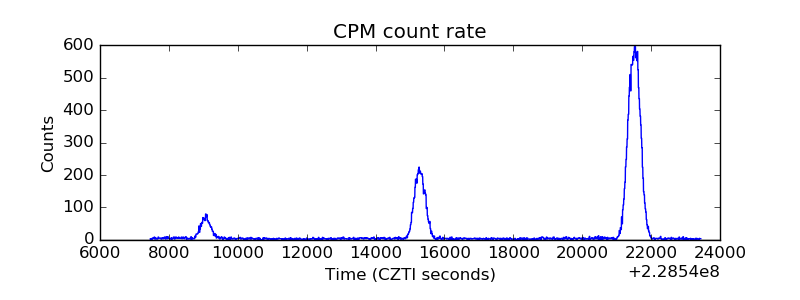 |
| CZT Counter |  |
| +2.5 Volts monitor |  |
| +5 Volts monitor |  |
| _ROLL_ROT | 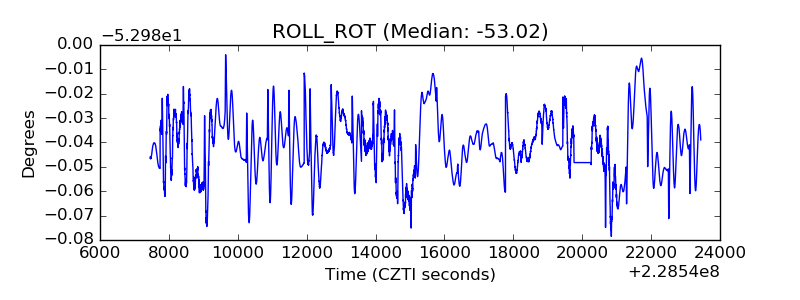 |
| _Roll_DEC | 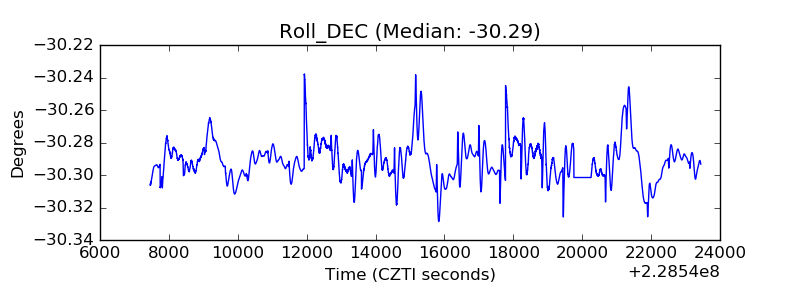 |
| _Roll_RA | 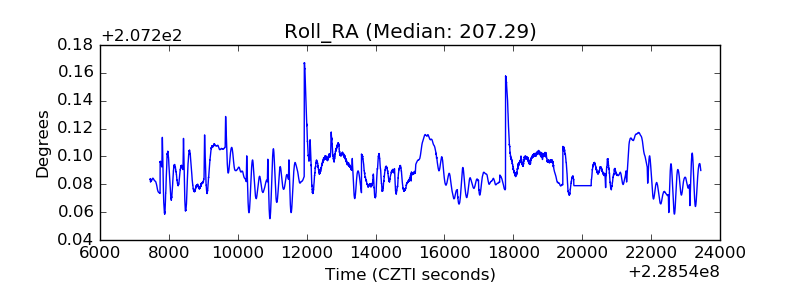 |
| Veto Counter | 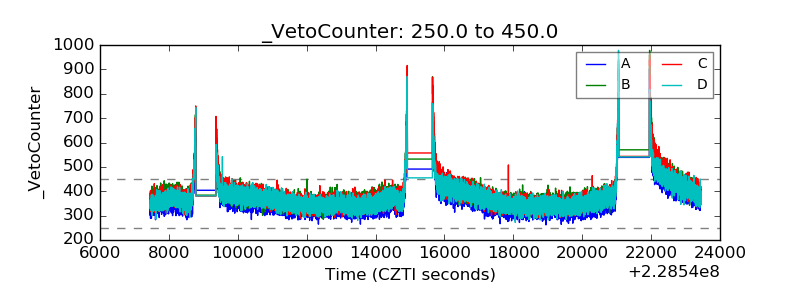 |