| Param | Original file | Final file |
|---|---|---|
| Filename | modeM0/AS1A02_178T01_9000001118_08132cztM0_level2.evt | modeM0/AS1A02_178T01_9000001118_08132cztM0_level2_quad_clean.evt |
| Size (bytes) | 582,399,360 | 79,084,800 |
| Size | 555.4 MB | 75.4 MB |
| Events in quadrant A | 5,985,188 | 461,671 |
| Events in quadrant B | 3,726,158 | 491,153 |
| Events in quadrant C | 3,523,817 | 485,135 |
| Events in quadrant D | 3,920,457 | 461,736 |
| Mode SS | |||
|---|---|---|---|
| Quadrant | BADHDUFLAG | Total packets | Discarded packets |
| A | 0 | 146 | 0 |
| B | 0 | 146 | 0 |
| C | 0 | 146 | 0 |
| D | 0 | 146 | 0 |
| Mode M0 | |||
|---|---|---|---|
| Quadrant | BADHDUFLAG | Total packets | Discarded packets |
| A | 0 | 22647 | 3 |
| B | 0 | 15772 | 2 |
| C | 0 | 15264 | 2 |
| D | 0 | 16520 | 2 |
| Mode M9 | |||
|---|---|---|---|
| Quadrant | BADHDUFLAG | Total packets | Discarded packets |
| A | 0 | 22 | 0 |
| B | 0 | 22 | 0 |
| C | 0 | 22 | 0 |
| D | 0 | 22 | 0 |
| Quadrant | Total seconds | Saturated seconds | Saturation percentage |
|---|---|---|---|
| A | 7107 | 1263 | 17.771211% |
| B | 7107 | 195 | 2.743774% |
| C | 7107 | 151 | 2.124666% |
| D | 7107 | 257 | 3.616153% |
Noise dominated data is calculated using 1-second bins in cleaned event files. If a bin has >2000 counts, and if more than 50% of those come from <1% of pixels, then it is considered to be noise-dominated and hence unusable.
| Quadrant | # 1 sec bins | Bins with >0 counts | Bins with >2000 counts | High rate bins dominated by noise | Noise dominated (total time) | Noise dominated (detector-on time) | Marked lightcurve |
|---|---|---|---|---|---|---|---|
| A | 9291 | 7106 | 1067 | 1067 | 11.48% | 15.02% | 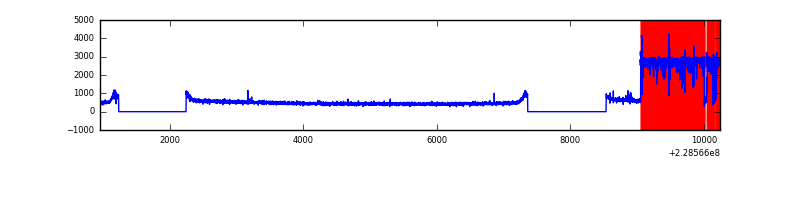 |
| B | 9292 | 7107 | 21 | 21 | 0.23% | 0.30% | 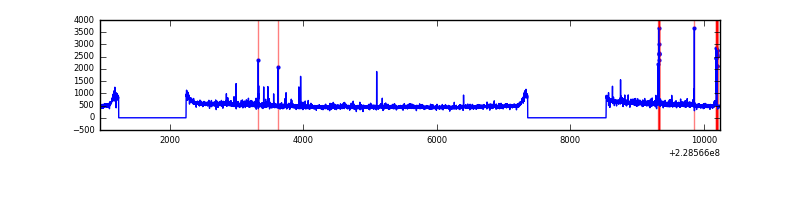 |
| C | 9292 | 7108 | 0 | 0 | 0.00% | 0.00% | 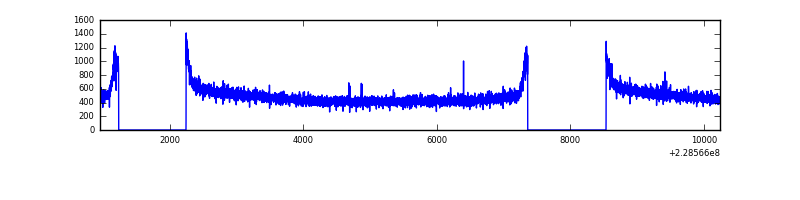 |
| D | 9292 | 7107 | 72 | 72 | 0.77% | 1.01% | 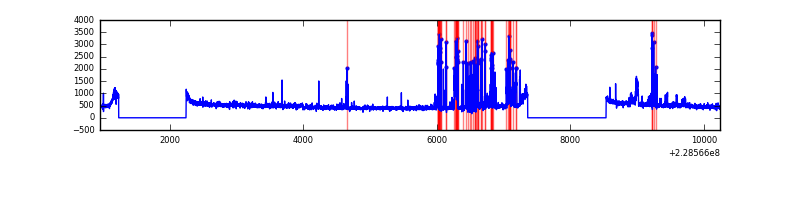 |
Top three noisy pixels from each quadrant. If the there are fewer than three noisy pixels in the level2.evt file, extra rows are filled as -1
| Pixel properties | Quadrant properties | ||||||
|---|---|---|---|---|---|---|---|
| Quadrant | DetID | PixID | Counts | Sigma | Mean | Median | Sigma |
| A | 13 | 170 | 2845569 | 17260.39 | 808 | 791 | 164.8 |
| A | 8 | 15 | 22272 | 130.33 | 808 | 791 | 164.8 |
| A | 0 | 226 | 7689 | 41.85 | 808 | 791 | 164.8 |
| B | 10 | 16 | 91318 | 521.75 | 913 | 890 | 173.3 |
| B | 0 | 214 | 73610 | 419.58 | 913 | 890 | 173.3 |
| B | 12 | 111 | 18205 | 99.9 | 913 | 890 | 173.3 |
| C | 1 | 16 | 64266 | 309.5 | 886 | 893 | 204.8 |
| C | 13 | 61 | 6685 | 28.29 | 886 | 893 | 204.8 |
| C | 8 | 222 | 4422 | 17.23 | 886 | 893 | 204.8 |
| D | 13 | 122 | 431217 | 1812.28 | 873 | 857 | 237.5 |
| D | 1 | 52 | 78285 | 326.06 | 873 | 857 | 237.5 |
| D | 10 | 102 | 42196 | 174.08 | 873 | 857 | 237.5 |
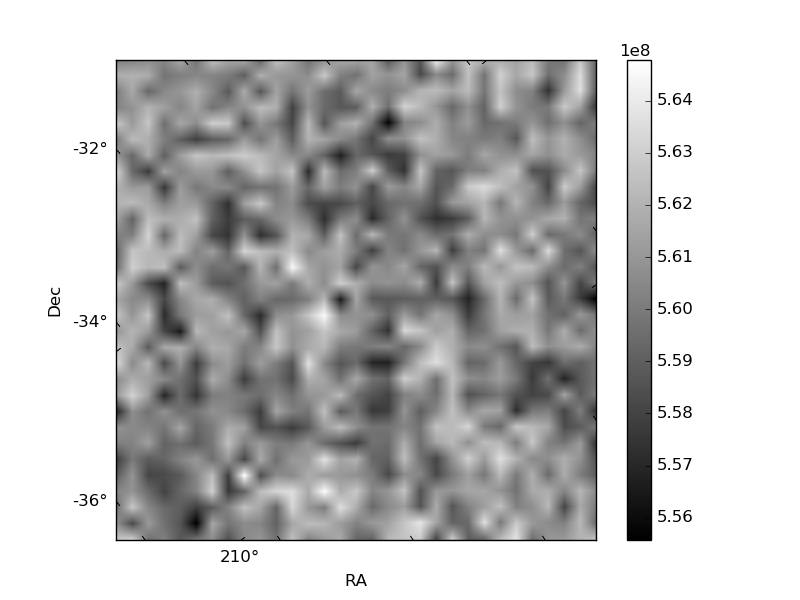
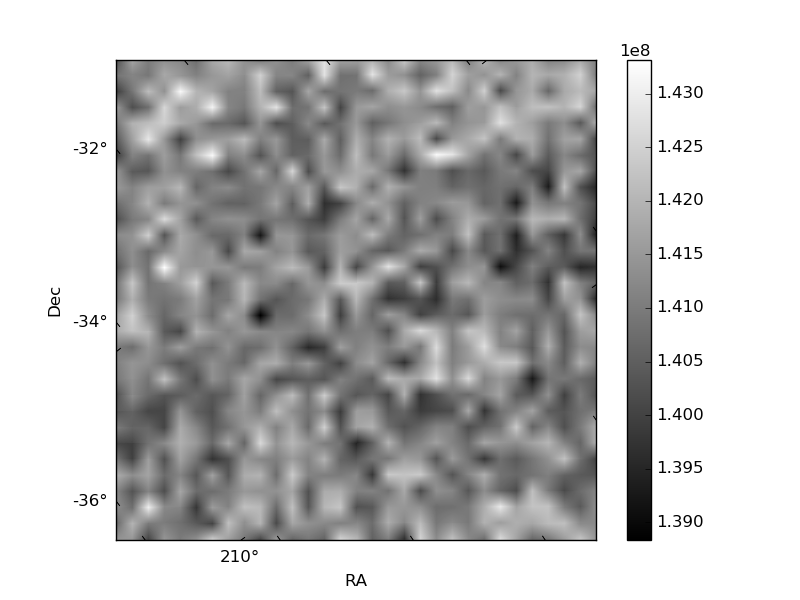
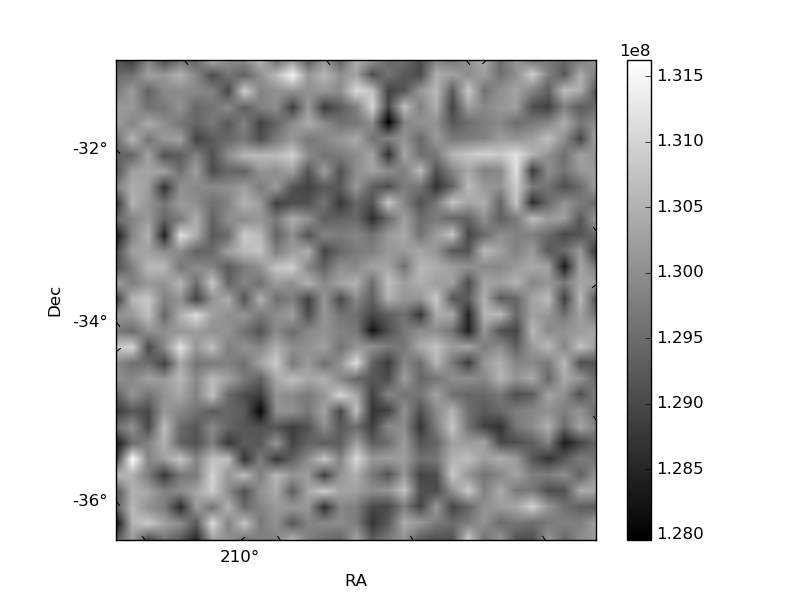
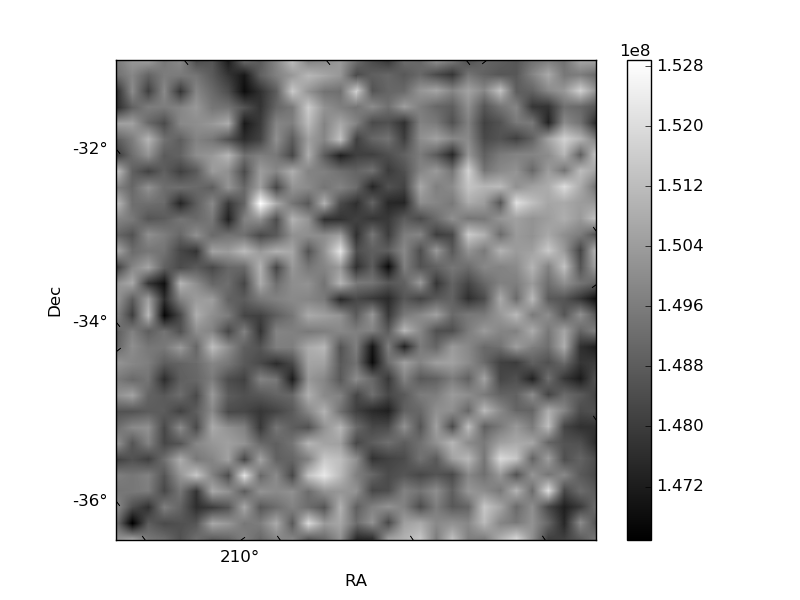
Histogram calculated using DETX and DETY for each event in the final _common_clean file
| Quadrant A | 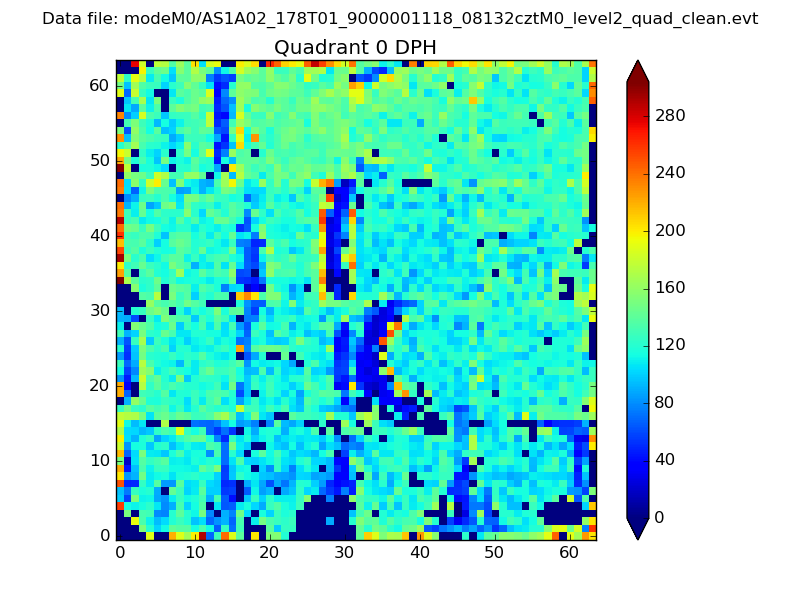 |
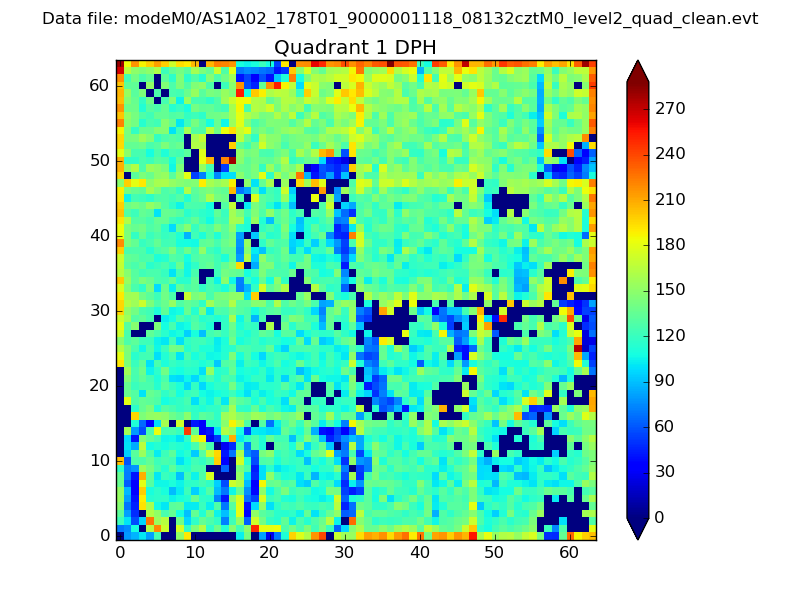 |
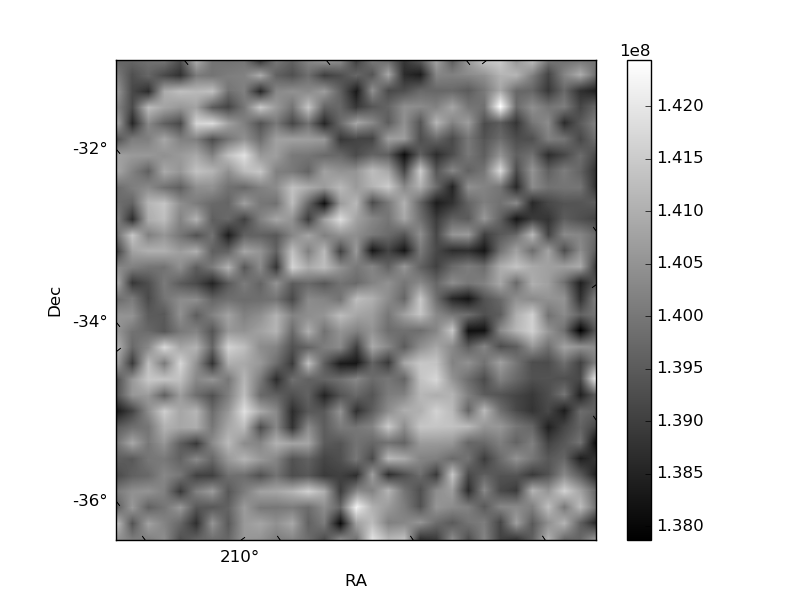
Quadrant B |
|---|---|---|---|
| Quadrant D | 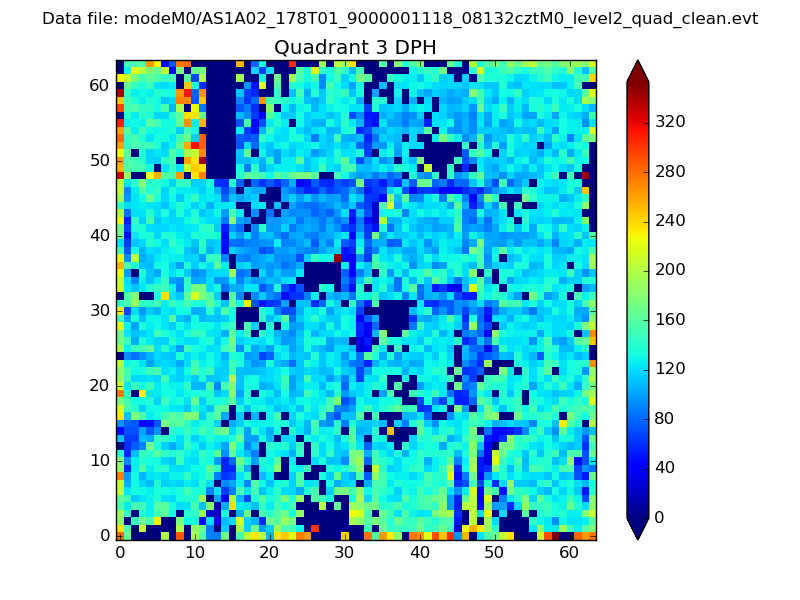 |
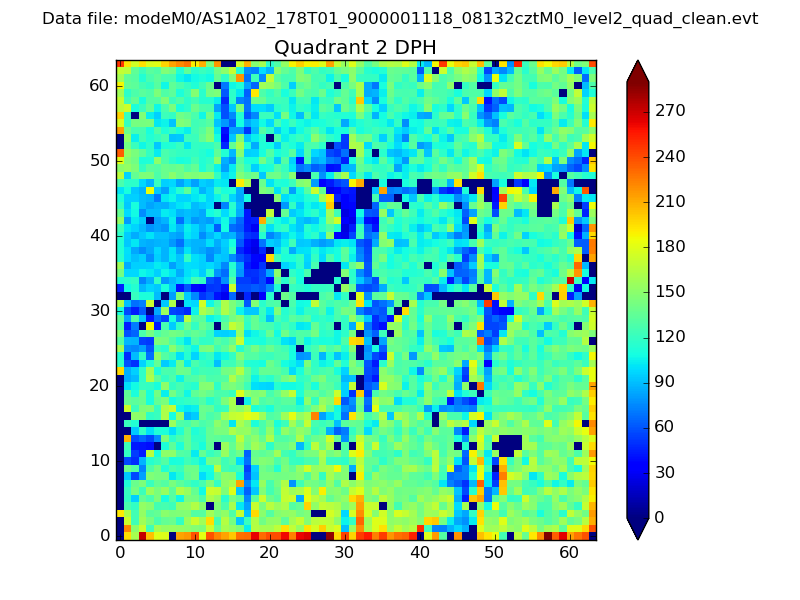 |
Quadrant C |
| Plot type | Count rate plots | Images |
|---|---|---|
| Comparison with Poisson distribution Blue bars denote a histogram of data divided into 1 sec bins. Red curve is a Poisson curve with rate = median count rate of data. |
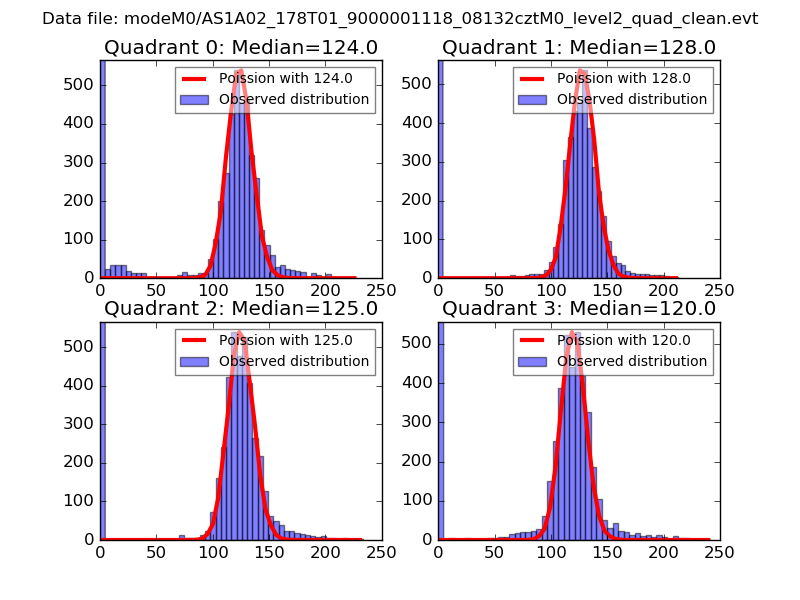 |
 |
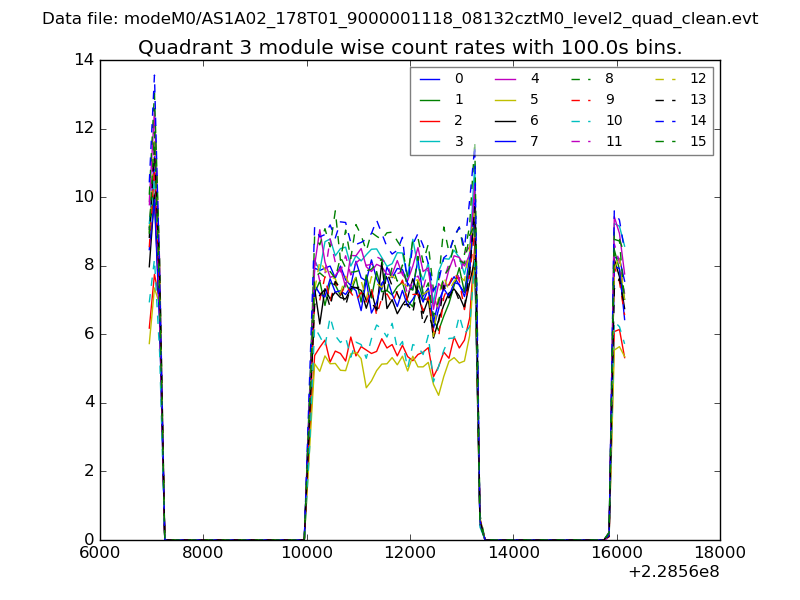
| Quadrant-wise count rates Data is divided into 100 sec bins |
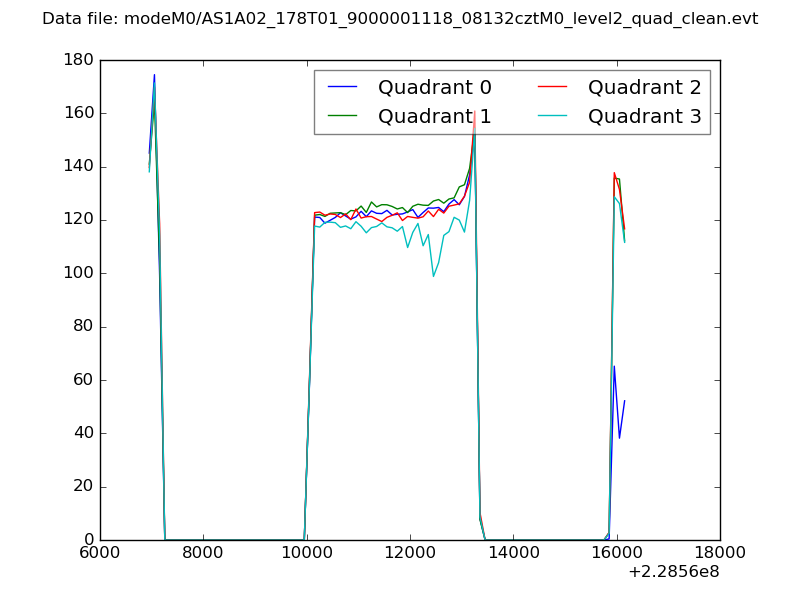 |
|
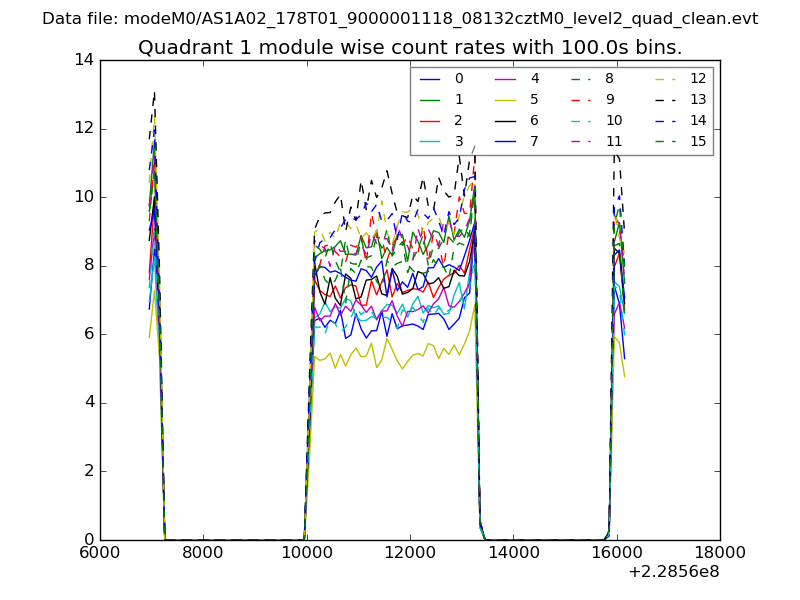
| Module-wise count rates for Quadrant A Data is divided into 100 sec bins |
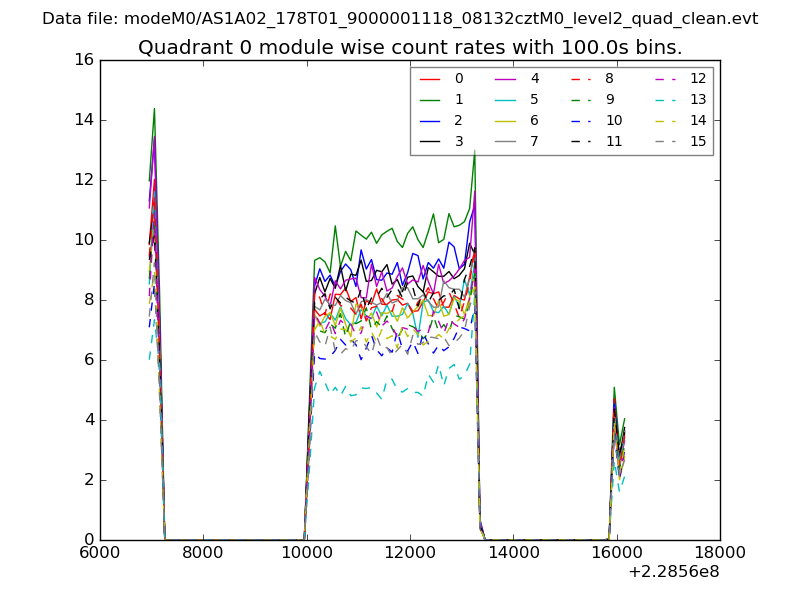 |
 |
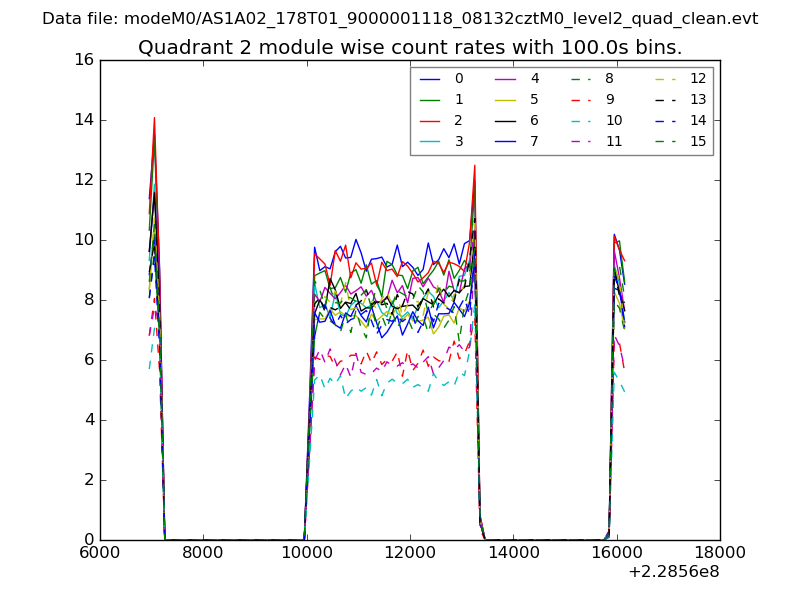
| Module-wise count rates for Quadrant B Data is divided into 100 sec bins |
 |
 |
| Module-wise count rates for Quadrant C Data is divided into 100 sec bins |
 |
 |
| Module-wise count rates for Quadrant D Data is divided into 100 sec bins |
 |
 |
| Parameter | Plot |
|---|---|
| CZT HV Monitor | 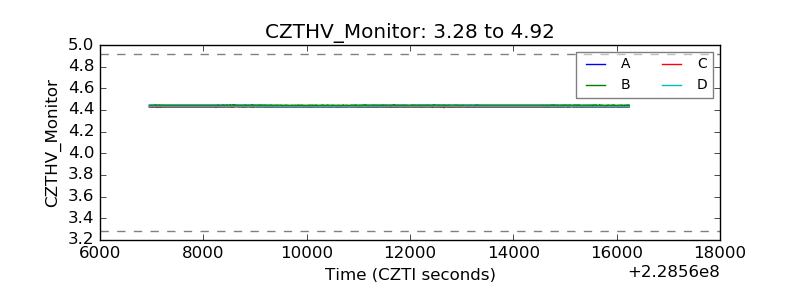 |
| D_VDD | 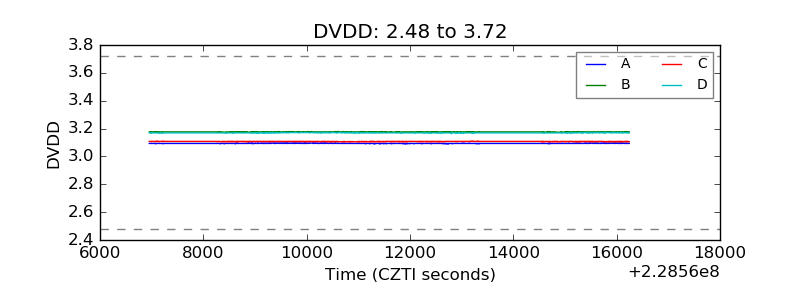 |
| Temperature 1 | 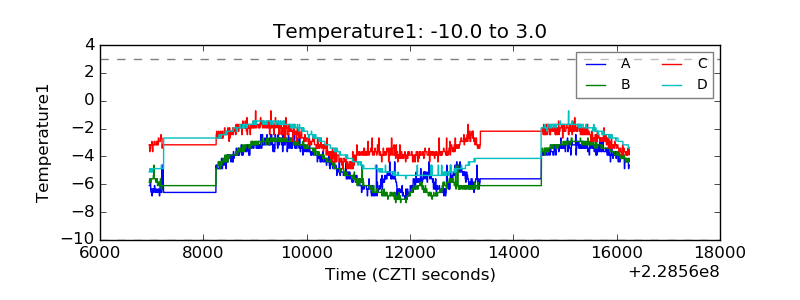 |
| Veto HV Monitor | 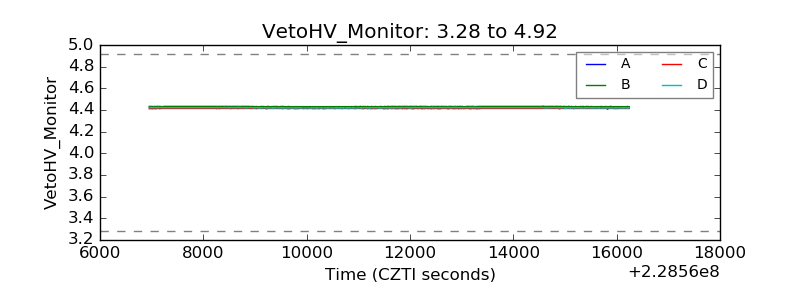 |
| Veto LLD | 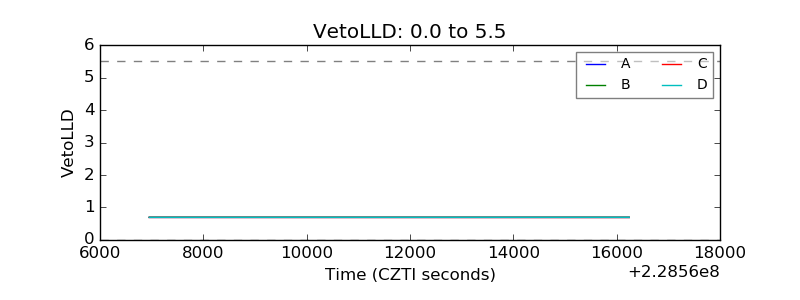 |
| Alpha Counter | 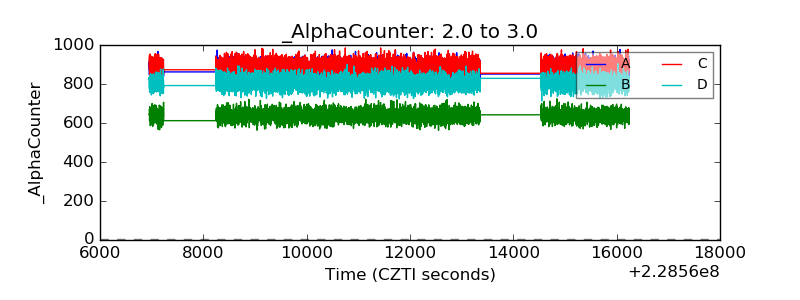 |
| _CPM_Rate | 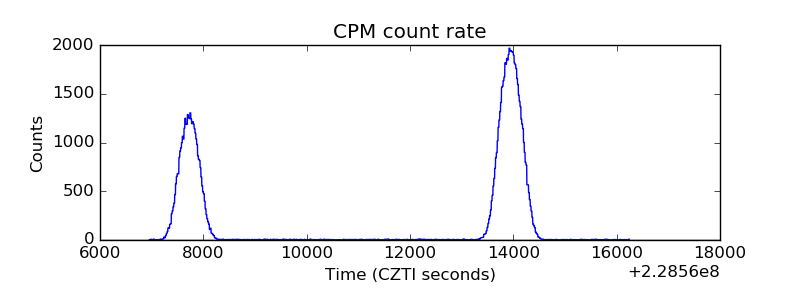 |
| CZT Counter | 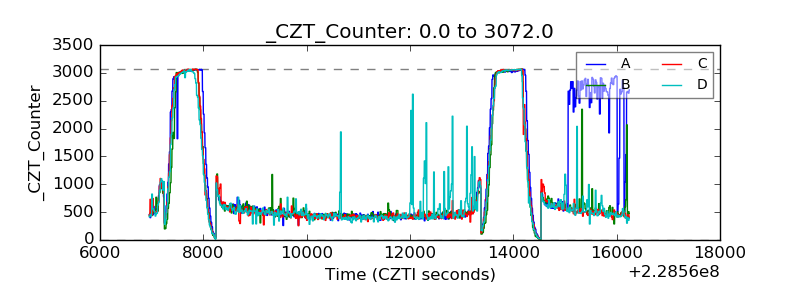 |
| +2.5 Volts monitor |  |
| +5 Volts monitor |  |
| _ROLL_ROT | 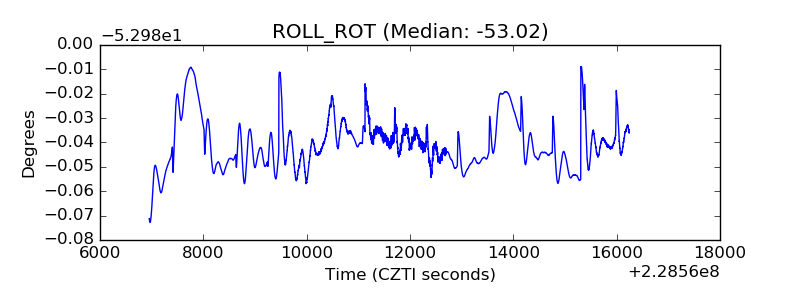 |
| _Roll_DEC | 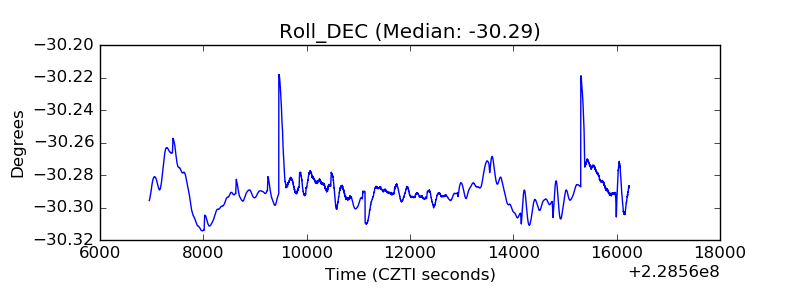 |
| _Roll_RA | 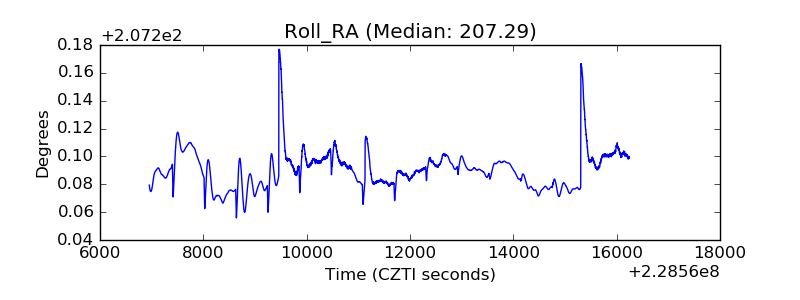 |
| Veto Counter | 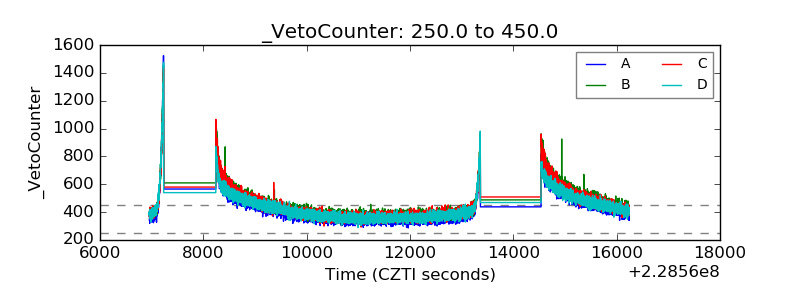 |