| Param | Original file | Final file |
|---|---|---|
| Filename | modeM0/AS1A02_178T01_9000001118_08133cztM0_level2.evt | modeM0/AS1A02_178T01_9000001118_08133cztM0_level2_quad_clean.evt |
| Size (bytes) | 604,114,560 | 83,056,320 |
| Size | 576.1 MB | 79.2 MB |
| Events in quadrant A | 7,482,944 | 465,895 |
| Events in quadrant B | 3,427,422 | 548,585 |
| Events in quadrant C | 3,260,822 | 532,905 |
| Events in quadrant D | 3,680,796 | 511,018 |
| Mode SS | |||
|---|---|---|---|
| Quadrant | BADHDUFLAG | Total packets | Discarded packets |
| A | 0 | 134 | 0 |
| B | 0 | 134 | 0 |
| C | 0 | 134 | 0 |
| D | 0 | 134 | 0 |
| Mode M0 | |||
|---|---|---|---|
| Quadrant | BADHDUFLAG | Total packets | Discarded packets |
| A | 0 | 26710 | 3 |
| B | 0 | 14479 | 2 |
| C | 0 | 14010 | 2 |
| D | 0 | 15428 | 2 |
| Mode M9 | |||
|---|---|---|---|
| Quadrant | BADHDUFLAG | Total packets | Discarded packets |
| A | 0 | 13 | 0 |
| B | 0 | 13 | 0 |
| C | 0 | 13 | 0 |
| D | 0 | 14 | 0 |
| Quadrant | Total seconds | Saturated seconds | Saturation percentage |
|---|---|---|---|
| A | 6539 | 1765 | 26.991895% |
| B | 6539 | 84 | 1.284600% |
| C | 6539 | 43 | 0.657593% |
| D | 6539 | 145 | 2.217464% |
Noise dominated data is calculated using 1-second bins in cleaned event files. If a bin has >2000 counts, and if more than 50% of those come from <1% of pixels, then it is considered to be noise-dominated and hence unusable.
| Quadrant | # 1 sec bins | Bins with >0 counts | Bins with >2000 counts | High rate bins dominated by noise | Noise dominated (total time) | Noise dominated (detector-on time) | Marked lightcurve |
|---|---|---|---|---|---|---|---|
| A | 7813 | 6539 | 1594 | 1594 | 20.40% | 24.38% | 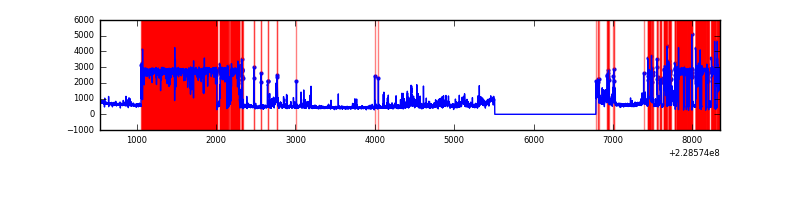 |
| B | 7814 | 6540 | 24 | 24 | 0.31% | 0.37% | 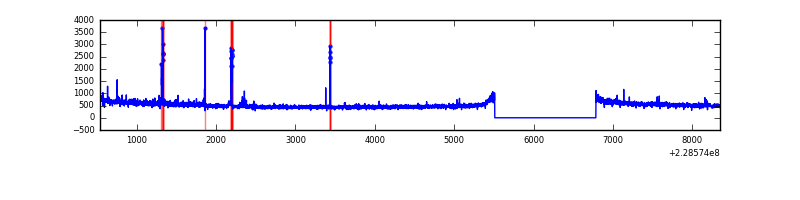 |
| C | 7814 | 6540 | 0 | 0 | 0.00% | 0.00% | 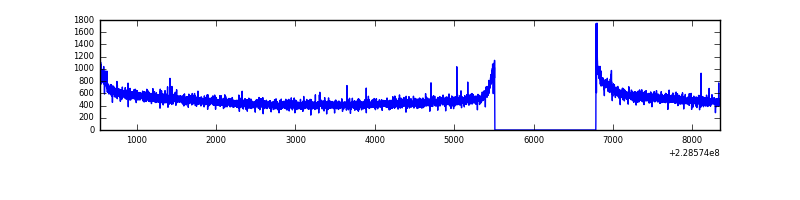 |
| D | 7814 | 6540 | 97 | 97 | 1.24% | 1.48% | 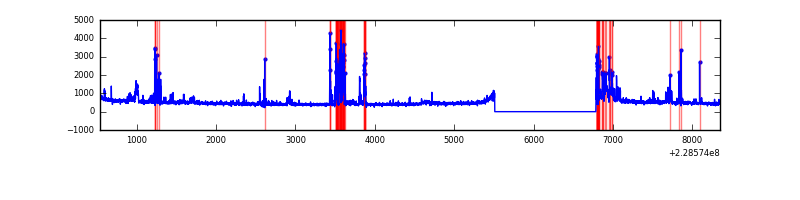 |
Top three noisy pixels from each quadrant. If the there are fewer than three noisy pixels in the level2.evt file, extra rows are filled as -1
| Pixel properties | Quadrant properties | ||||||
|---|---|---|---|---|---|---|---|
| Quadrant | DetID | PixID | Counts | Sigma | Mean | Median | Sigma |
| A | 13 | 170 | 4780025 | 34226.34 | 693 | 680 | 139.6 |
| A | 14 | 111 | 17724 | 122.06 | 693 | 680 | 139.6 |
| A | 8 | 15 | 12751 | 86.44 | 693 | 680 | 139.6 |
| B | 10 | 16 | 72421 | 450.9 | 845 | 827 | 158.8 |
| B | 0 | 214 | 63995 | 397.83 | 845 | 827 | 158.8 |
| B | 12 | 111 | 16636 | 99.57 | 845 | 827 | 158.8 |
| C | 1 | 16 | 88882 | 473.03 | 809 | 814 | 186.2 |
| C | 13 | 61 | 6138 | 28.6 | 809 | 814 | 186.2 |
| C | 8 | 128 | 5870 | 27.16 | 809 | 814 | 186.2 |
| D | 1 | 52 | 262335 | 1235.25 | 793 | 777 | 211.7 |
| D | 12 | 233 | 191426 | 900.37 | 793 | 777 | 211.7 |
| D | 13 | 122 | 68639 | 320.49 | 793 | 777 | 211.7 |
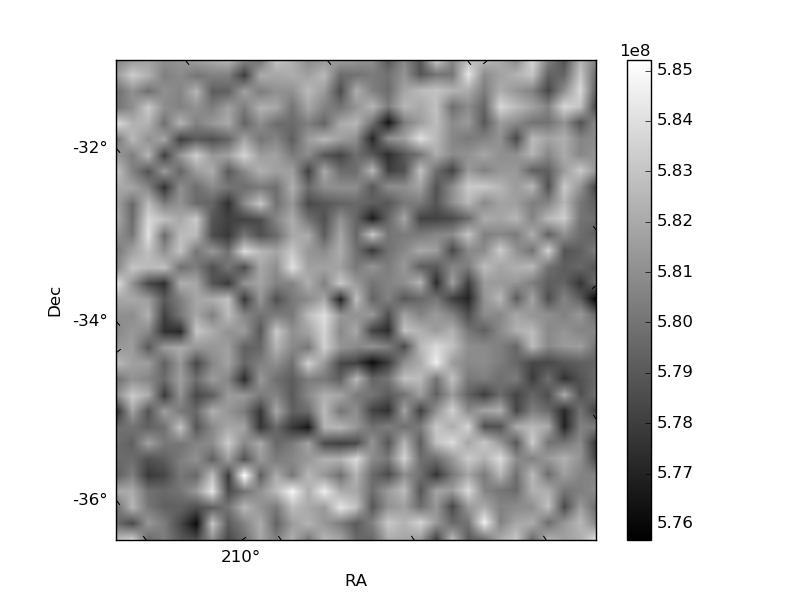
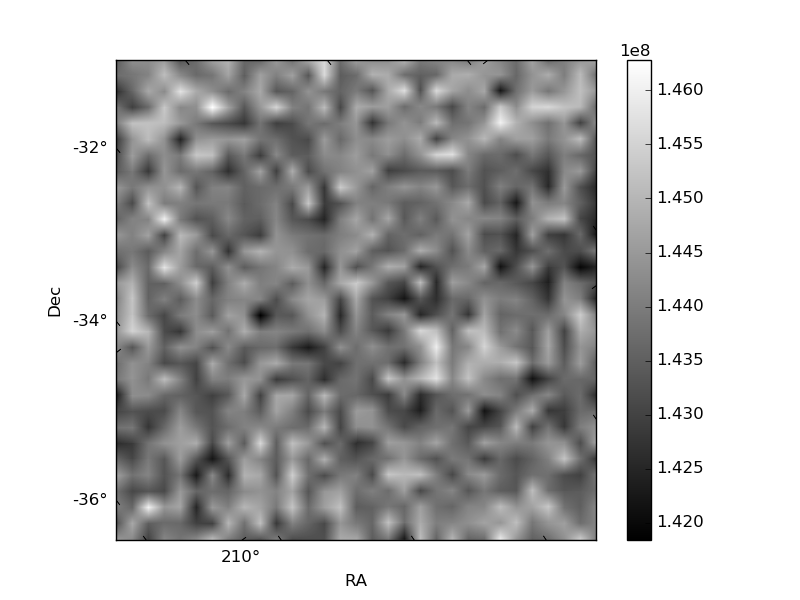
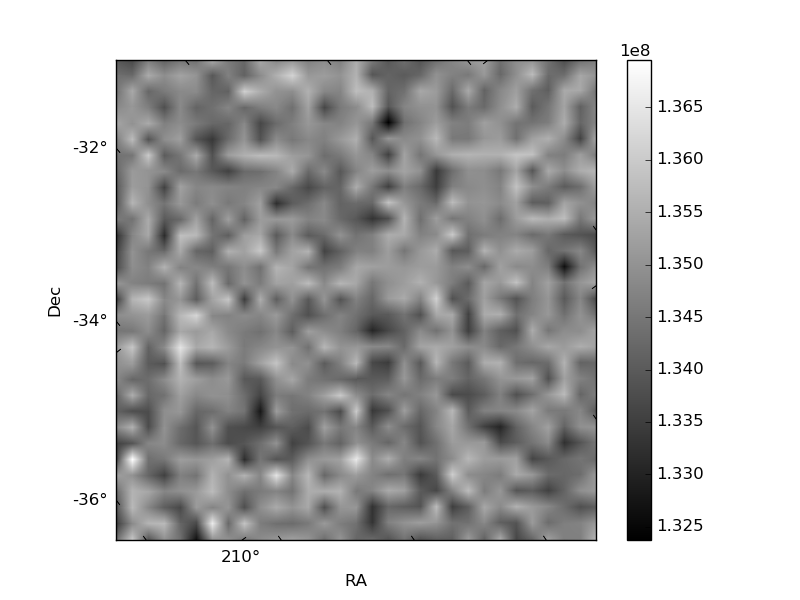
Histogram calculated using DETX and DETY for each event in the final _common_clean file
| Quadrant A | 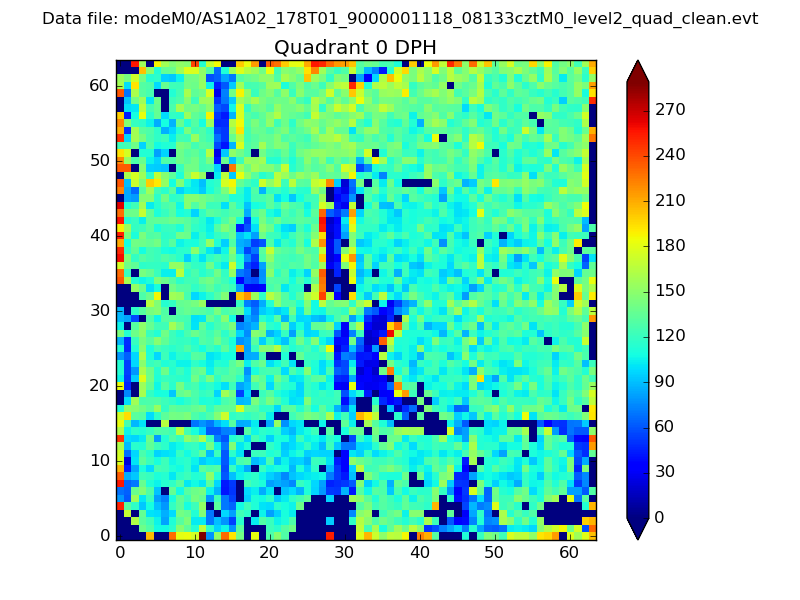 |
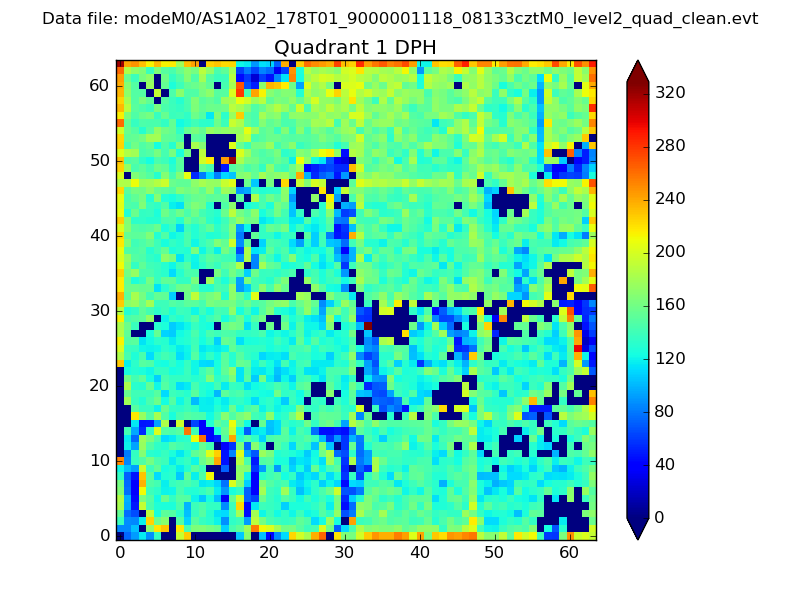 |
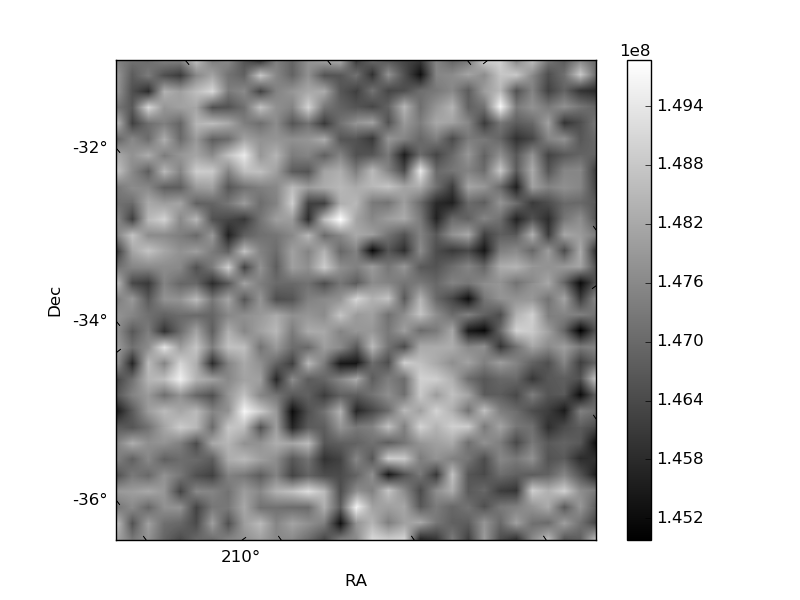
Quadrant B |
|---|---|---|---|
| Quadrant D | 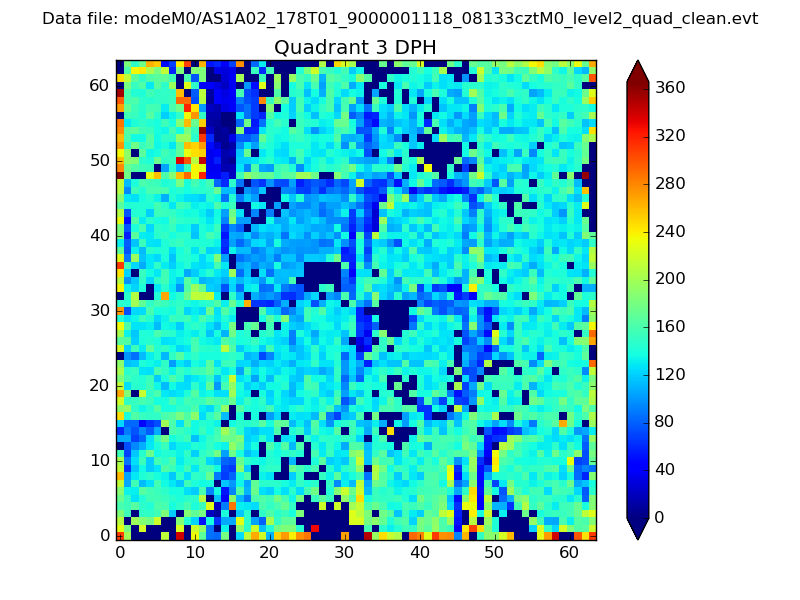 |
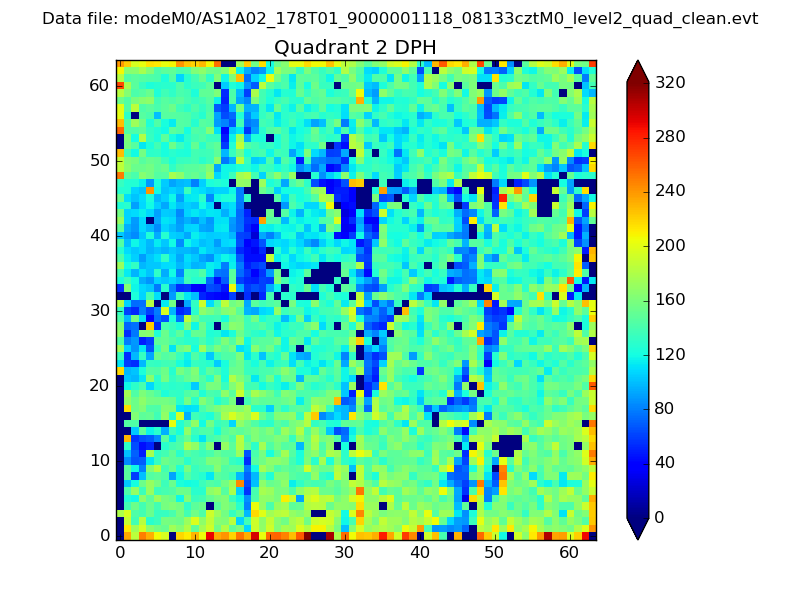 |
Quadrant C |
| Plot type | Count rate plots | Images |
|---|---|---|
| Comparison with Poisson distribution Blue bars denote a histogram of data divided into 1 sec bins. Red curve is a Poisson curve with rate = median count rate of data. |
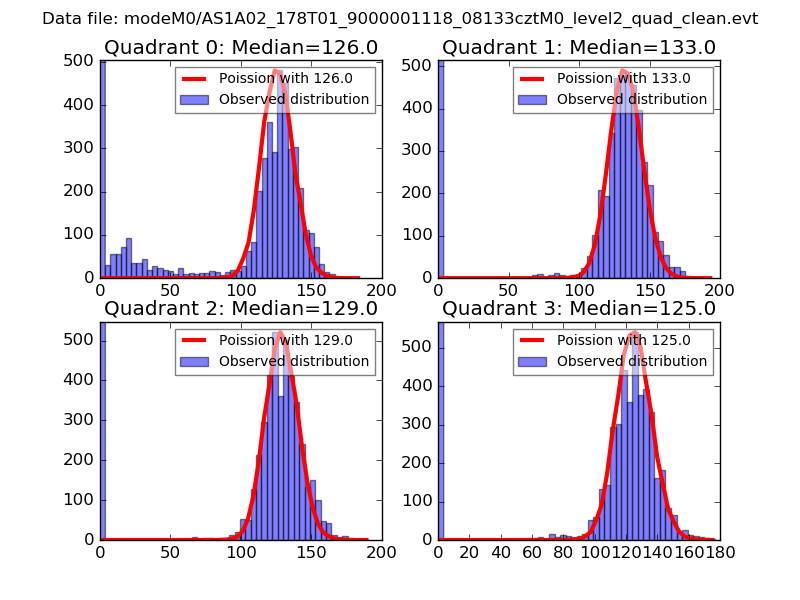 |
 |
| Quadrant-wise count rates Data is divided into 100 sec bins |
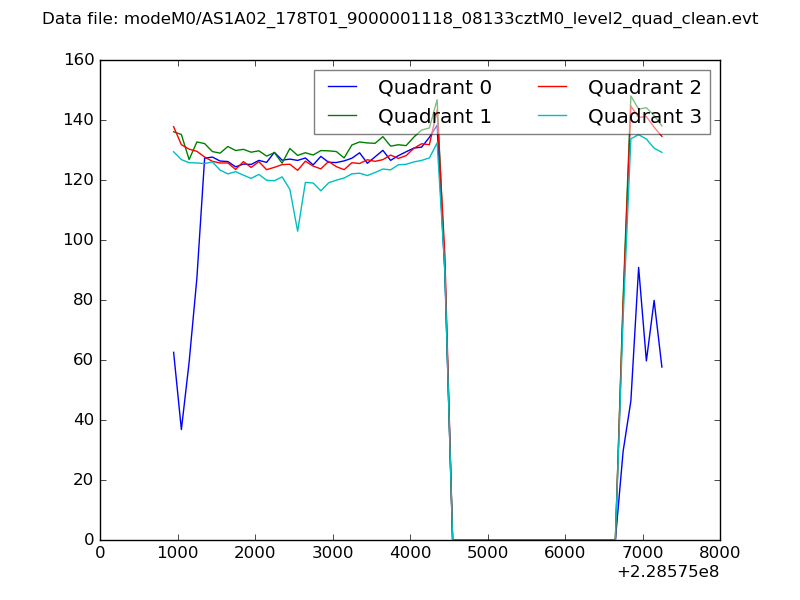 |
|
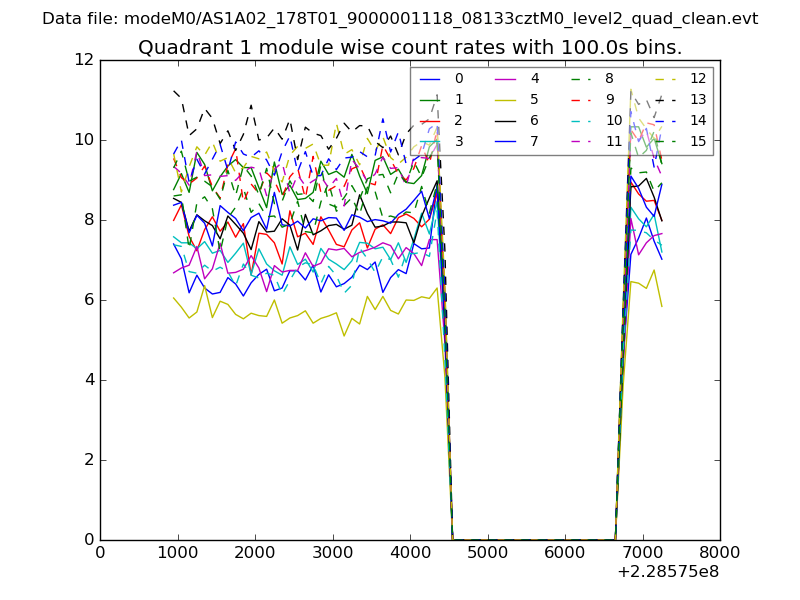
| Module-wise count rates for Quadrant A Data is divided into 100 sec bins |
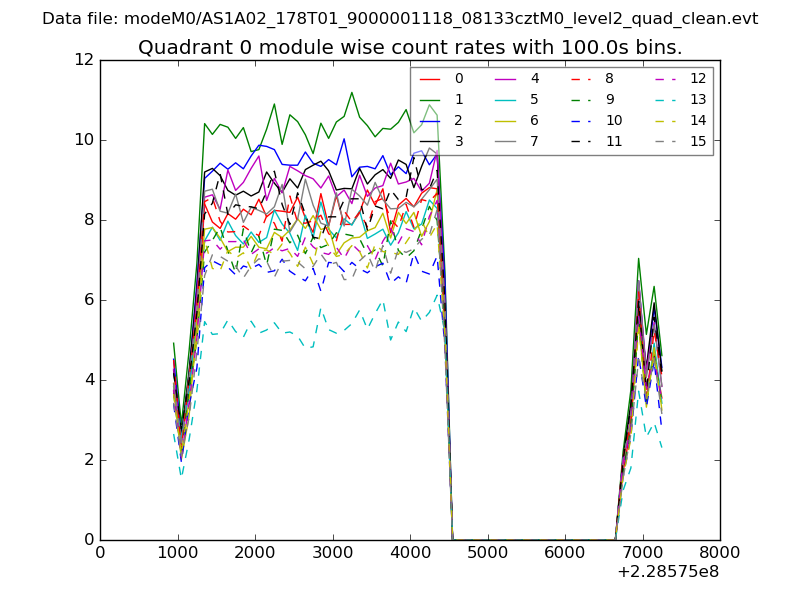 |
 |
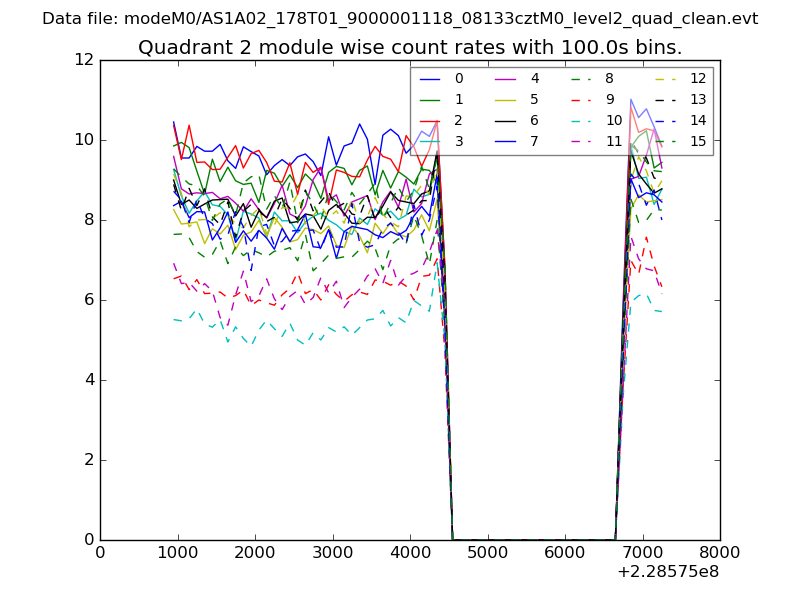
| Module-wise count rates for Quadrant B Data is divided into 100 sec bins |
 |
 |
| Module-wise count rates for Quadrant C Data is divided into 100 sec bins |
 |
 |
| Module-wise count rates for Quadrant D Data is divided into 100 sec bins |
 |
 |
| Parameter | Plot |
|---|---|
| CZT HV Monitor | 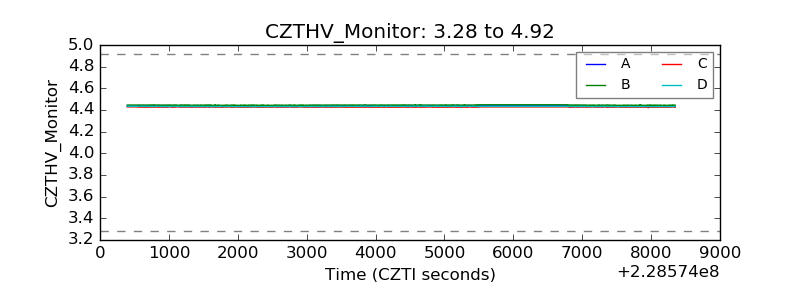 |
| D_VDD | 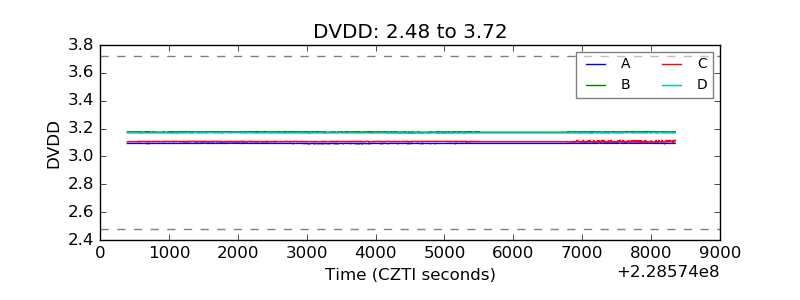 |
| Temperature 1 | 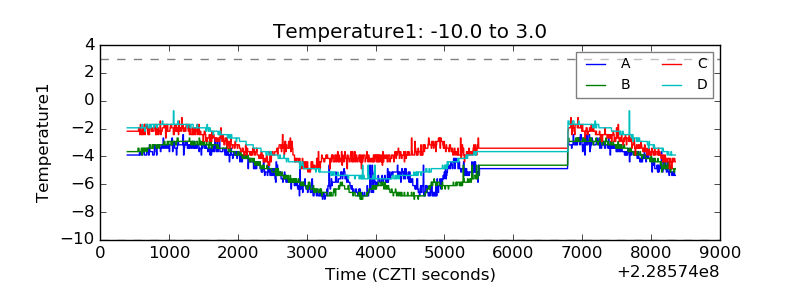 |
| Veto HV Monitor | 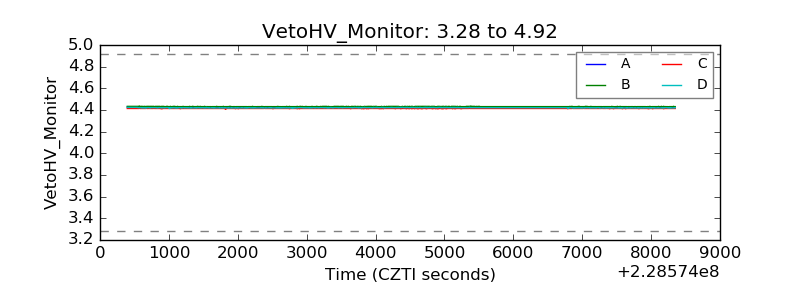 |
| Veto LLD | 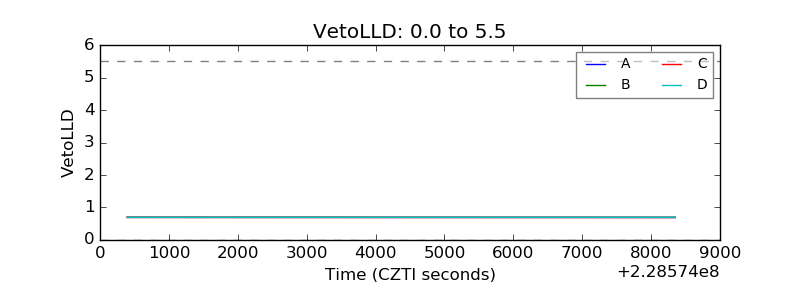 |
| Alpha Counter | 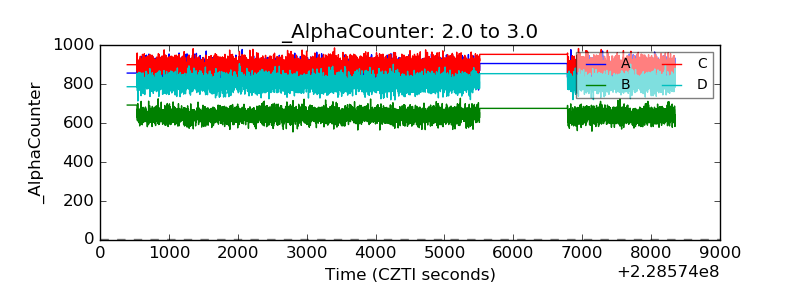 |
| _CPM_Rate | 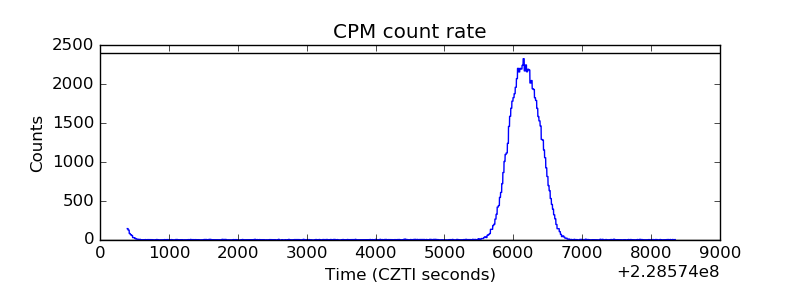 |
| CZT Counter | 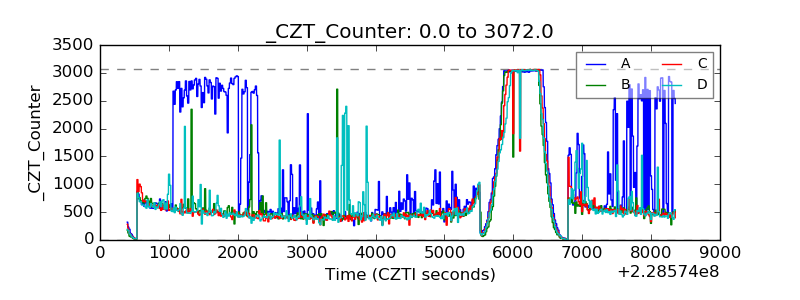 |
| +2.5 Volts monitor |  |
| +5 Volts monitor |  |
| _ROLL_ROT |  |
| _Roll_DEC | 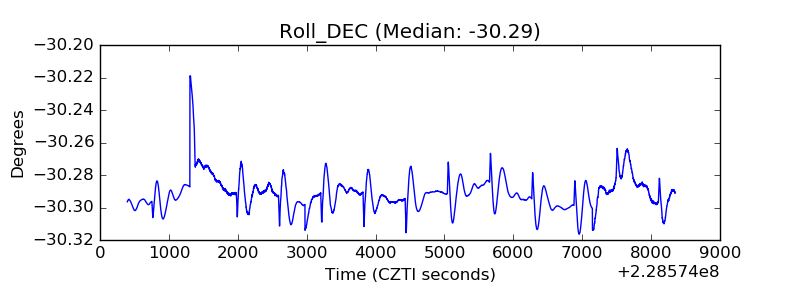 |
| _Roll_RA | 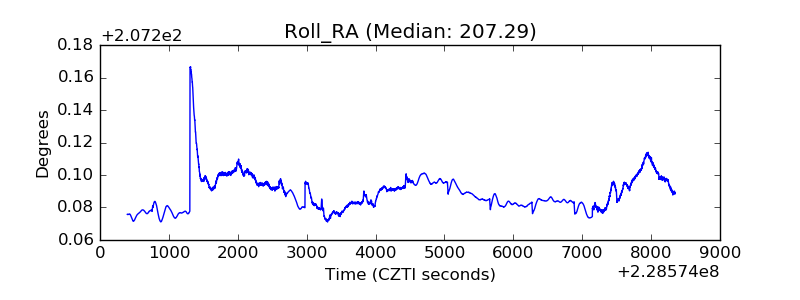 |
| Veto Counter | 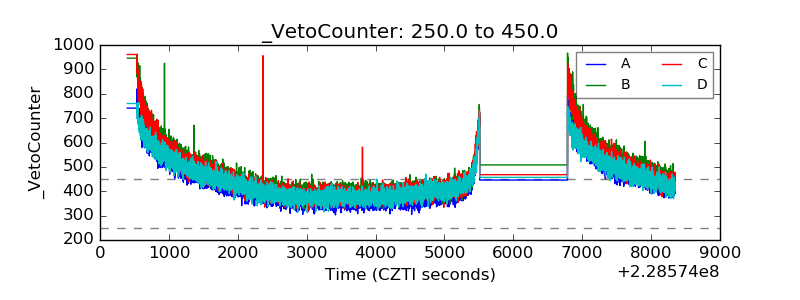 |