| Param | Original file | Final file |
|---|---|---|
| Filename | modeM0/AS1A02_178T01_9000001118_08134cztM0_level2.evt | modeM0/AS1A02_178T01_9000001118_08134cztM0_level2_quad_clean.evt |
| Size (bytes) | 621,178,560 | 86,734,080 |
| Size | 592.4 MB | 82.7 MB |
| Events in quadrant A | 8,754,925 | 437,342 |
| Events in quadrant B | 3,233,633 | 606,041 |
| Events in quadrant C | 3,157,061 | 584,854 |
| Events in quadrant D | 3,241,180 | 559,211 |
| Mode SS | |||
|---|---|---|---|
| Quadrant | BADHDUFLAG | Total packets | Discarded packets |
| A | 0 | 128 | 0 |
| B | 0 | 128 | 0 |
| C | 0 | 128 | 0 |
| D | 0 | 128 | 0 |
| Mode M0 | |||
|---|---|---|---|
| Quadrant | BADHDUFLAG | Total packets | Discarded packets |
| A | 0 | 30341 | 3 |
| B | 0 | 13509 | 2 |
| C | 0 | 13466 | 2 |
| D | 0 | 13934 | 2 |
| Mode M9 | |||
|---|---|---|---|
| Quadrant | BADHDUFLAG | Total packets | Discarded packets |
| A | 0 | 23 | 0 |
| B | 0 | 23 | 0 |
| C | 0 | 23 | 0 |
| D | 0 | 24 | 0 |
| Quadrant | Total seconds | Saturated seconds | Saturation percentage |
|---|---|---|---|
| A | 6278 | 2278 | 36.285441% |
| B | 6278 | 78 | 1.242434% |
| C | 6278 | 55 | 0.876075% |
| D | 6278 | 100 | 1.592864% |
Noise dominated data is calculated using 1-second bins in cleaned event files. If a bin has >2000 counts, and if more than 50% of those come from <1% of pixels, then it is considered to be noise-dominated and hence unusable.
| Quadrant | # 1 sec bins | Bins with >0 counts | Bins with >2000 counts | High rate bins dominated by noise | Noise dominated (total time) | Noise dominated (detector-on time) | Marked lightcurve |
|---|---|---|---|---|---|---|---|
| A | 7593 | 6279 | 1938 | 1938 | 25.52% | 30.86% | 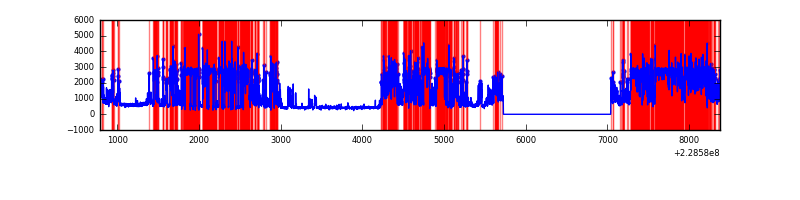 |
| B | 7593 | 6279 | 1 | 1 | 0.01% | 0.02% | 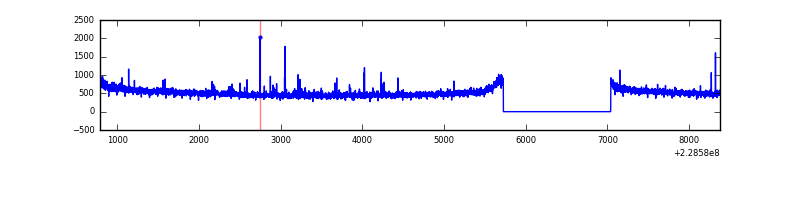 |
| C | 7593 | 6279 | 0 | 0 | 0.00% | 0.00% | 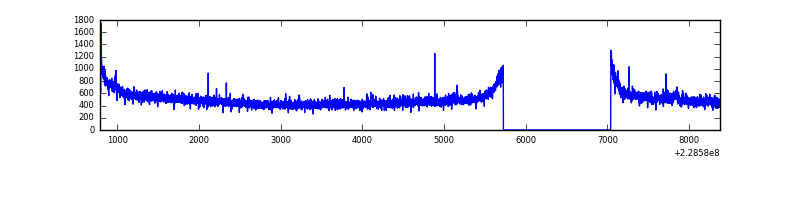 |
| D | 7593 | 6279 | 43 | 43 | 0.57% | 0.68% | 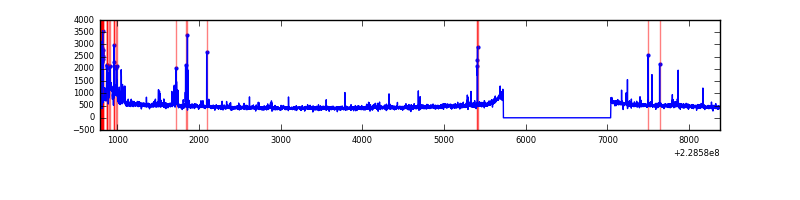 |
Top three noisy pixels from each quadrant. If the there are fewer than three noisy pixels in the level2.evt file, extra rows are filled as -1
| Pixel properties | Quadrant properties | ||||||
|---|---|---|---|---|---|---|---|
| Quadrant | DetID | PixID | Counts | Sigma | Mean | Median | Sigma |
| A | 13 | 170 | 6233507 | 47285.71 | 652 | 641 | 131.8 |
| A | 14 | 111 | 7251 | 50.15 | 652 | 641 | 131.8 |
| A | 0 | 226 | 6169 | 41.94 | 652 | 641 | 131.8 |
| B | 0 | 219 | 25615 | 163.44 | 813 | 797 | 151.8 |
| B | 4 | 173 | 18984 | 119.77 | 813 | 797 | 151.8 |
| B | 10 | 16 | 18700 | 117.9 | 813 | 797 | 151.8 |
| C | 1 | 16 | 101890 | 567.31 | 777 | 782 | 178.2 |
| C | 8 | 128 | 13342 | 70.47 | 777 | 782 | 178.2 |
| C | 8 | 112 | 6323 | 31.09 | 777 | 782 | 178.2 |
| D | 1 | 52 | 218622 | 1057.87 | 761 | 745 | 206.0 |
| D | 13 | 169 | 44289 | 211.42 | 761 | 745 | 206.0 |
| D | 13 | 122 | 31872 | 151.13 | 761 | 745 | 206.0 |
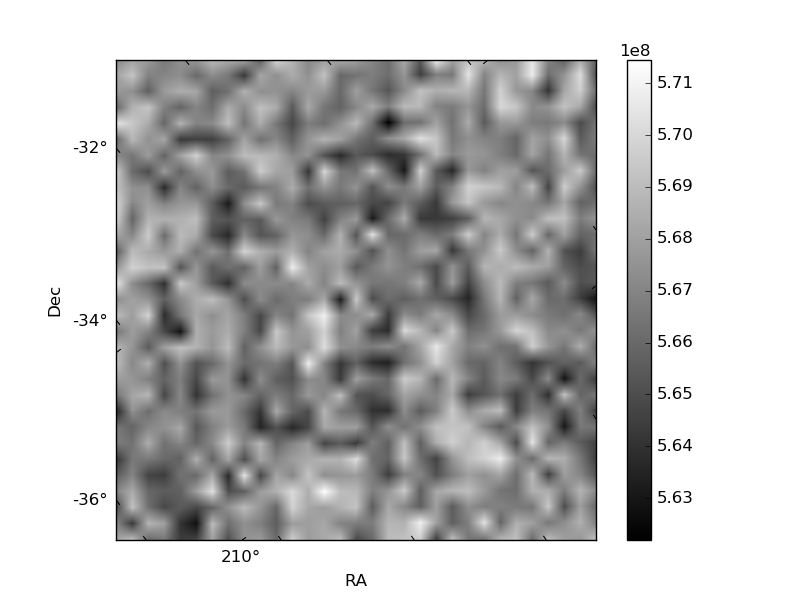
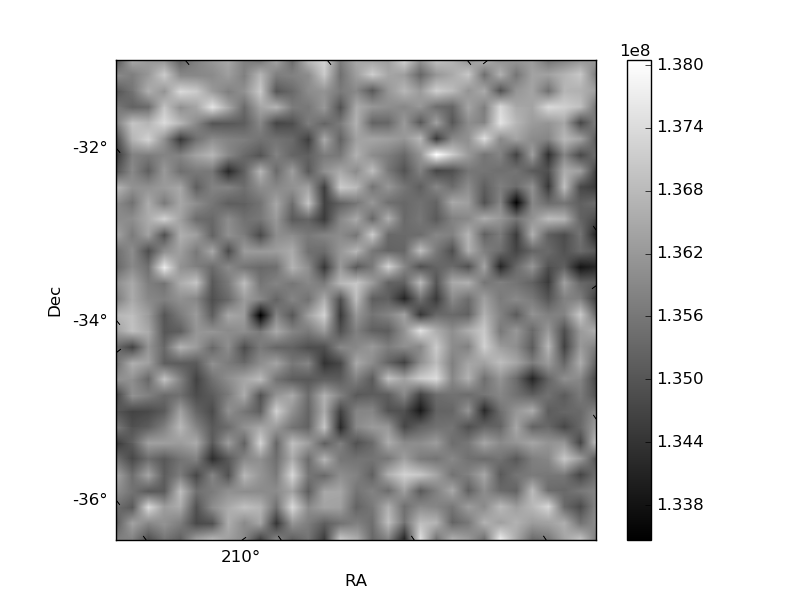
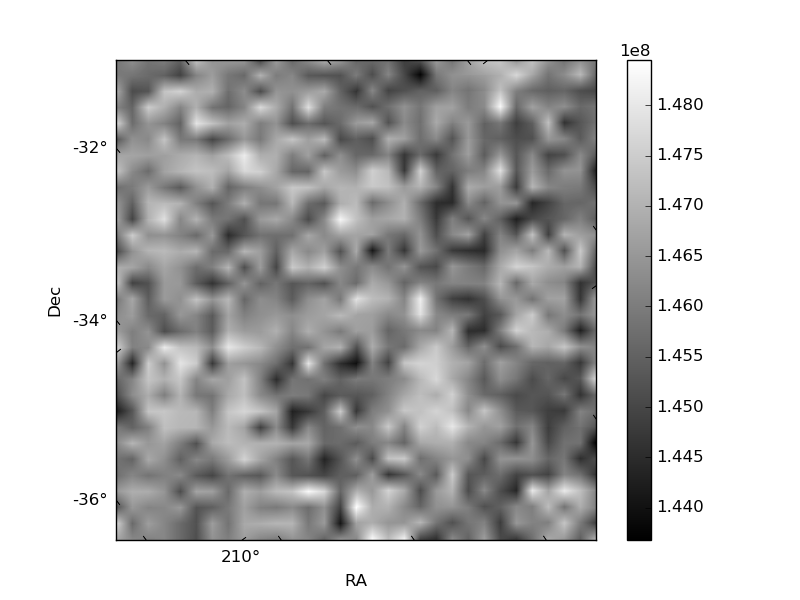
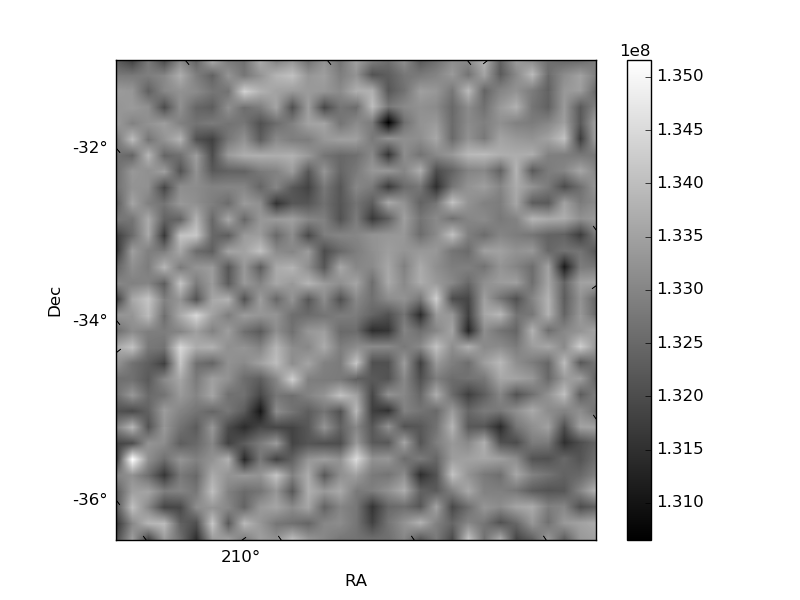
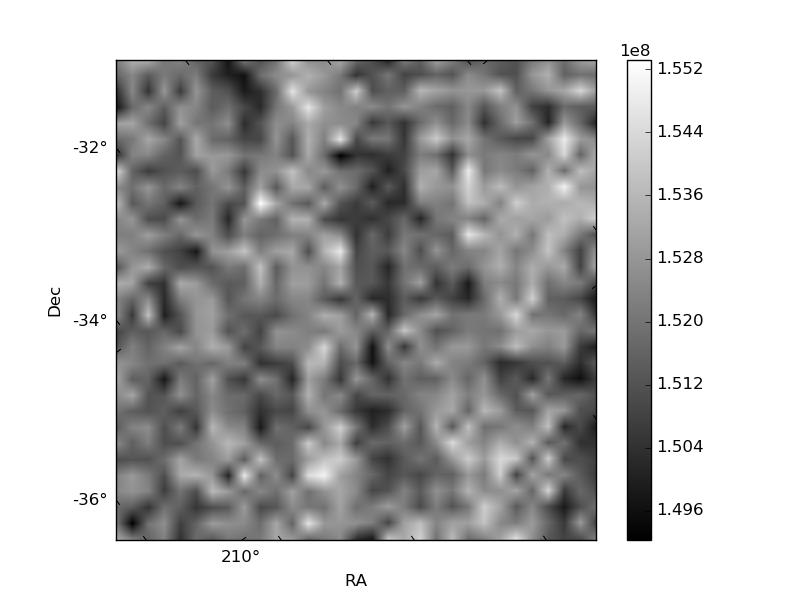
Histogram calculated using DETX and DETY for each event in the final _common_clean file
| Quadrant A | 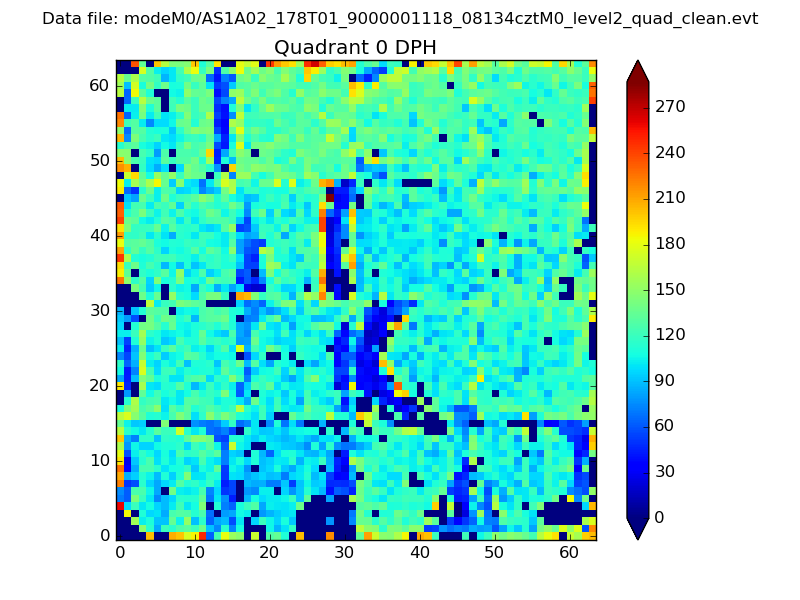 |
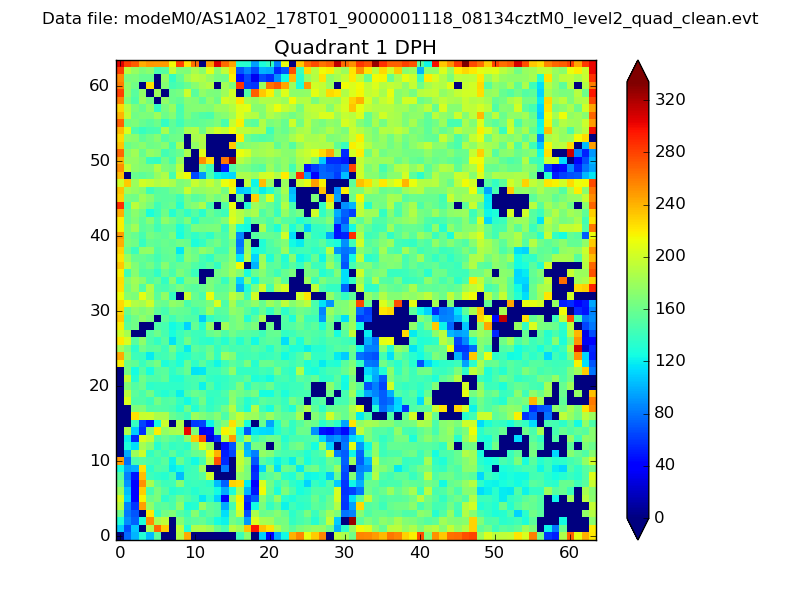 |
Quadrant B |
|---|---|---|---|
| Quadrant D | 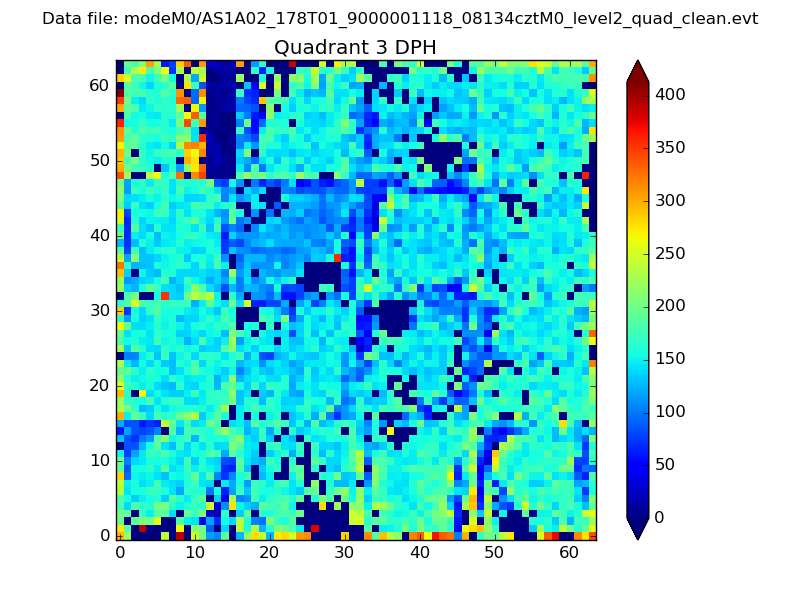 |
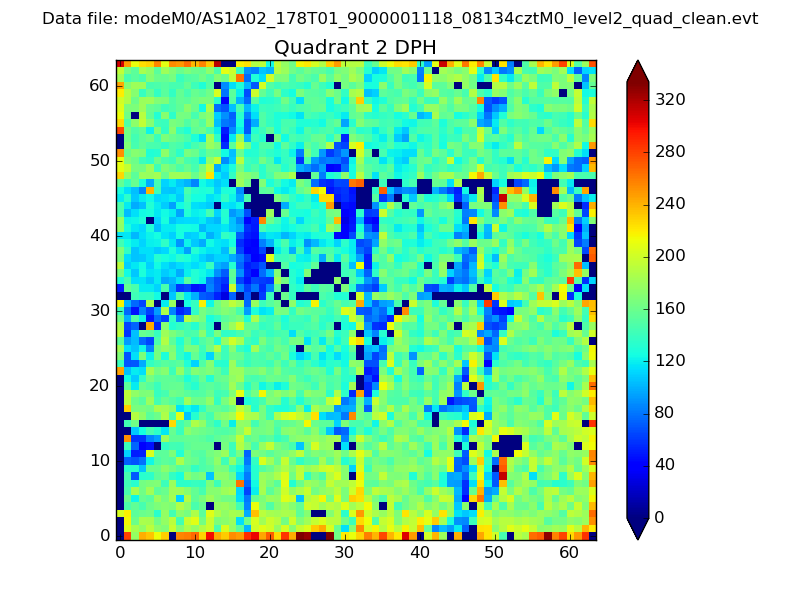 |
Quadrant C |
| Plot type | Count rate plots | Images |
|---|---|---|
| Comparison with Poisson distribution Blue bars denote a histogram of data divided into 1 sec bins. Red curve is a Poisson curve with rate = median count rate of data. |
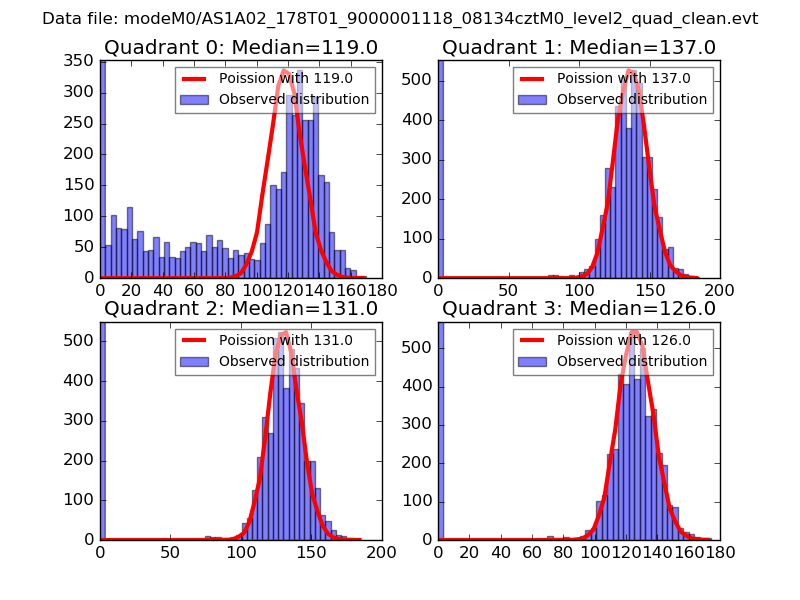 |
 |
| Quadrant-wise count rates Data is divided into 100 sec bins |
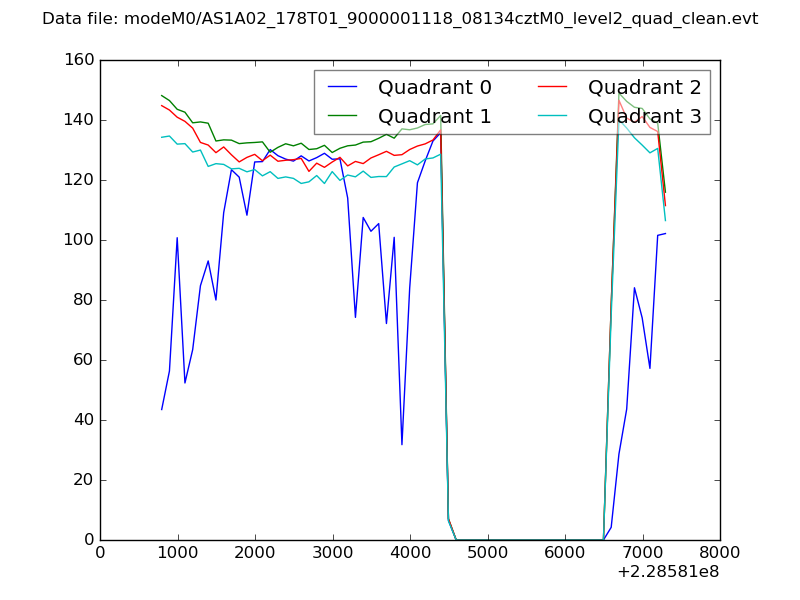 |
|
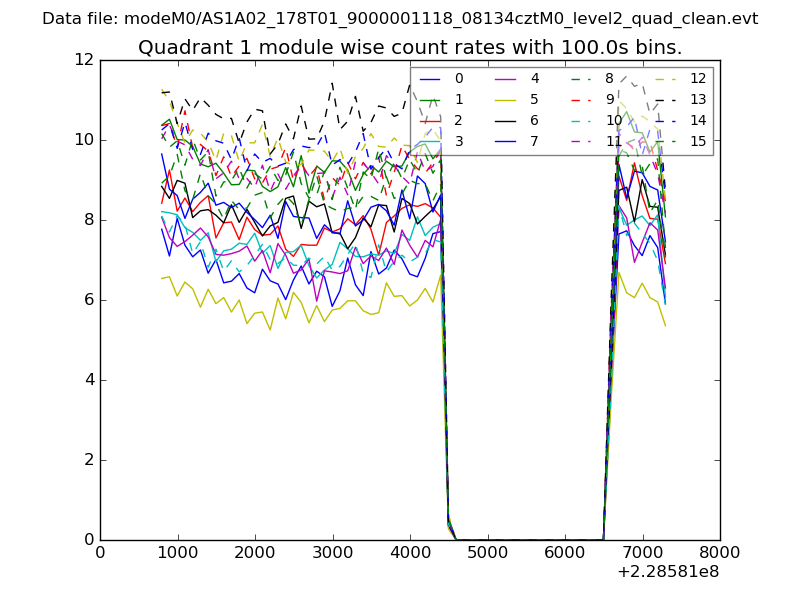
| Module-wise count rates for Quadrant A Data is divided into 100 sec bins |
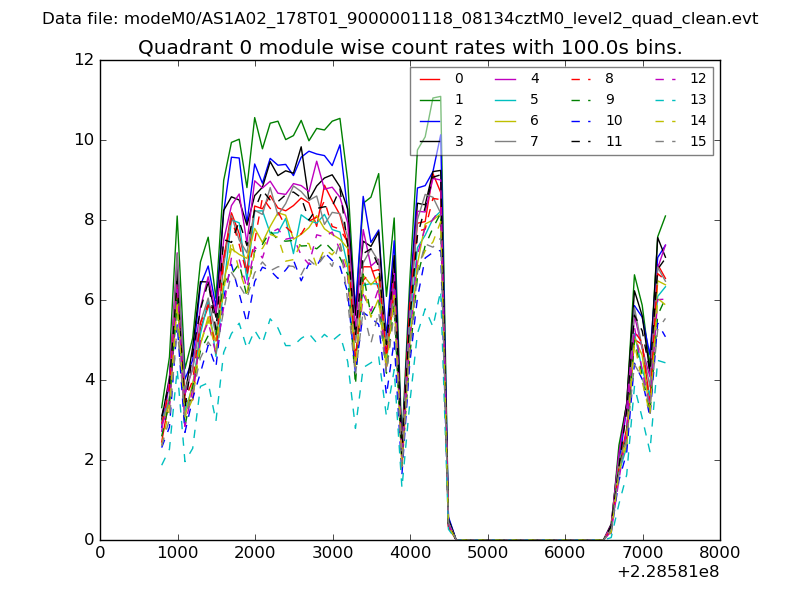 |
 |
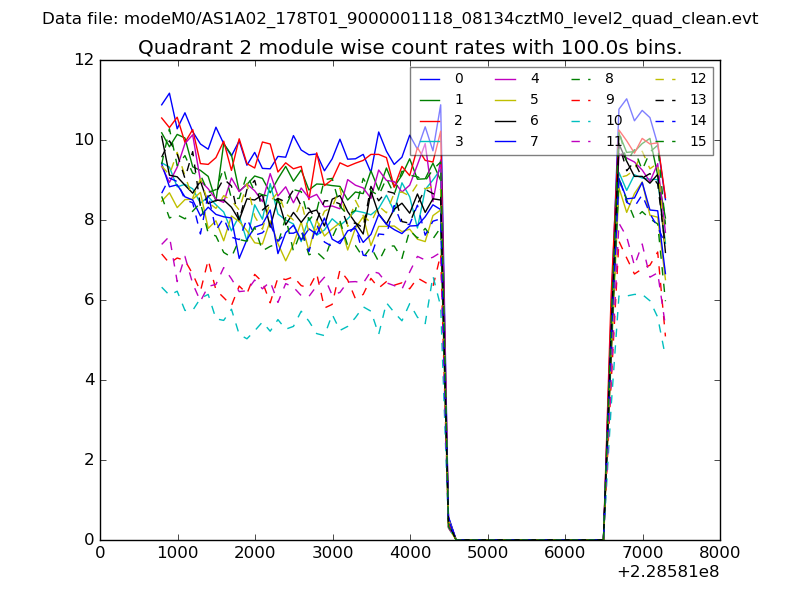
| Module-wise count rates for Quadrant B Data is divided into 100 sec bins |
 |
 |
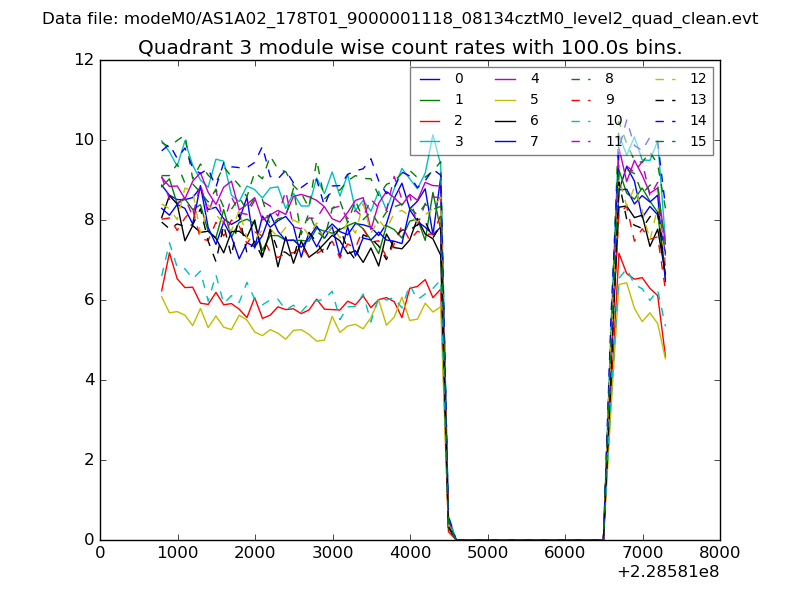
| Module-wise count rates for Quadrant C Data is divided into 100 sec bins |
 |
 |
| Module-wise count rates for Quadrant D Data is divided into 100 sec bins |
 |
 |
| Parameter | Plot |
|---|---|
| CZT HV Monitor | 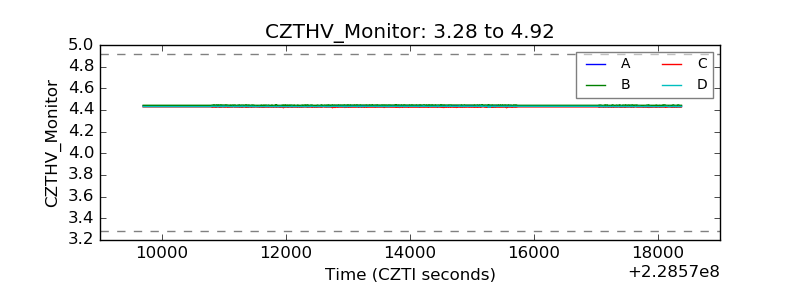 |
| D_VDD | 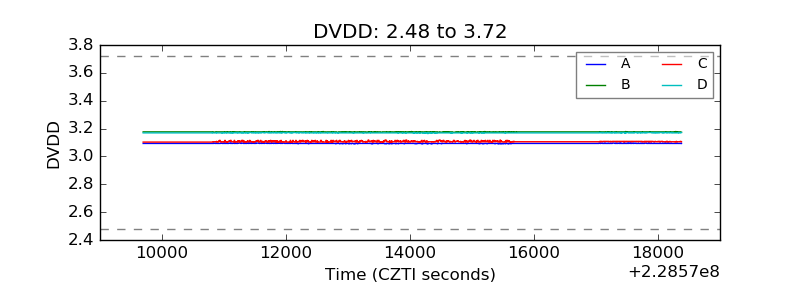 |
| Temperature 1 | 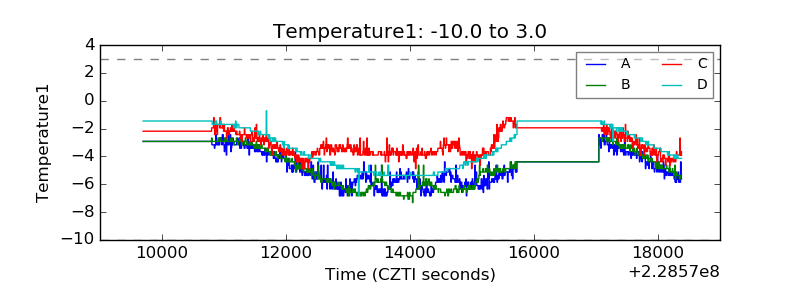 |
| Veto HV Monitor | 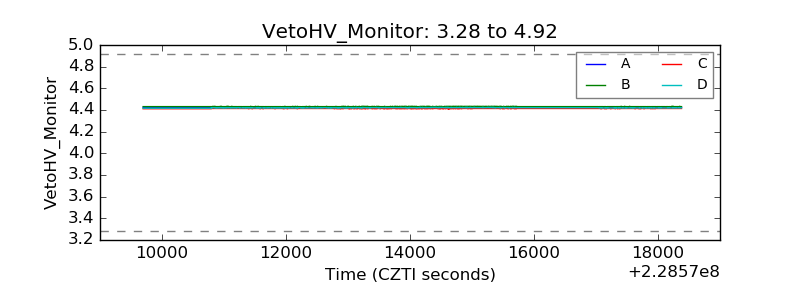 |
| Veto LLD |  |
| Alpha Counter | 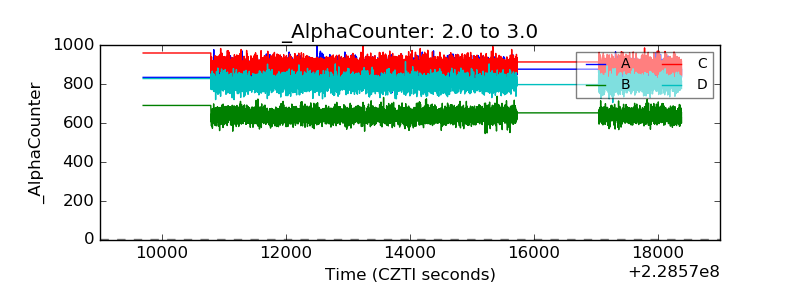 |
| _CPM_Rate | 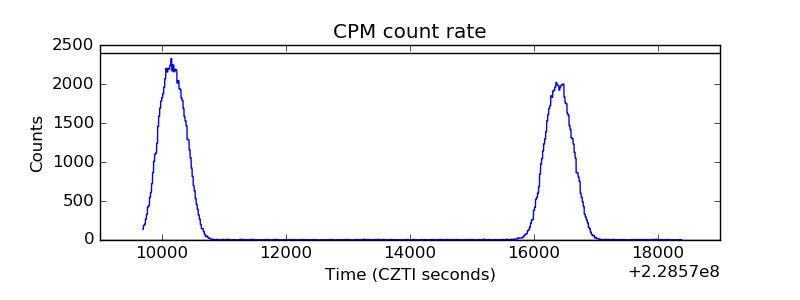 |
| CZT Counter | 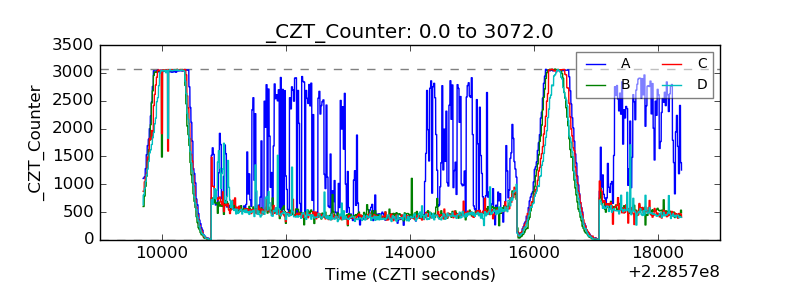 |
| +2.5 Volts monitor |  |
| +5 Volts monitor |  |
| _ROLL_ROT | 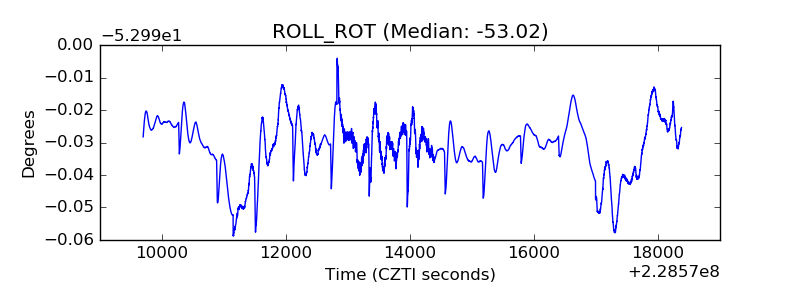 |
| _Roll_DEC | 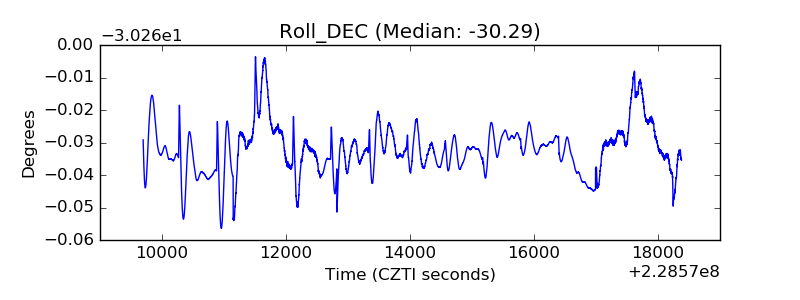 |
| _Roll_RA | 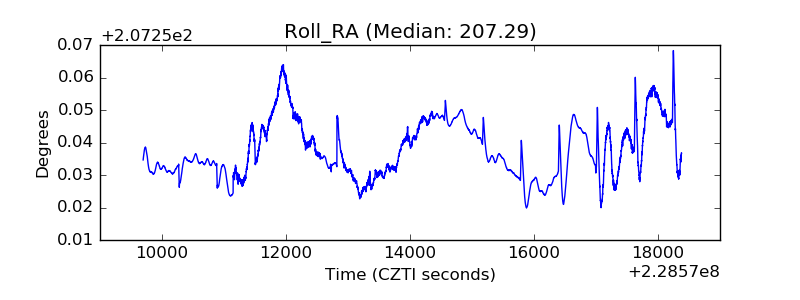 |
| Veto Counter | 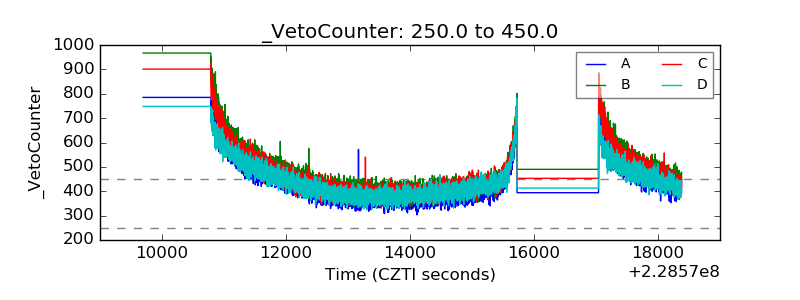 |