| Param | Original file | Final file |
|---|---|---|
| Filename | modeM0/AS1A02_178T01_9000001118_08136cztM0_level2.evt | modeM0/AS1A02_178T01_9000001118_08136cztM0_level2_quad_clean.evt |
| Size (bytes) | 811,022,400 | 81,613,440 |
| Size | 773.5 MB | 77.8 MB |
| Events in quadrant A | 14,359,931 | 302,079 |
| Events in quadrant B | 3,193,135 | 598,037 |
| Events in quadrant C | 3,032,957 | 579,176 |
| Events in quadrant D | 3,542,682 | 543,916 |
| Mode SS | |||
|---|---|---|---|
| Quadrant | BADHDUFLAG | Total packets | Discarded packets |
| A | 0 | 134 | 0 |
| B | 0 | 134 | 0 |
| C | 0 | 134 | 0 |
| D | 0 | 134 | 0 |
| Mode M0 | |||
|---|---|---|---|
| Quadrant | BADHDUFLAG | Total packets | Discarded packets |
| A | 0 | 46909 | 2 |
| B | 0 | 13741 | 2 |
| C | 0 | 13394 | 2 |
| D | 0 | 15147 | 2 |
| Mode M9 | |||
|---|---|---|---|
| Quadrant | BADHDUFLAG | Total packets | Discarded packets |
| A | 0 | 23 | 0 |
| B | 0 | 23 | 0 |
| C | 0 | 23 | 0 |
| D | 0 | 23 | 0 |
| Quadrant | Total seconds | Saturated seconds | Saturation percentage |
|---|---|---|---|
| A | 6394 | 4980 | 77.885518% |
| B | 6394 | 109 | 1.704723% |
| C | 6394 | 41 | 0.641226% |
| D | 6394 | 170 | 2.658743% |
Noise dominated data is calculated using 1-second bins in cleaned event files. If a bin has >2000 counts, and if more than 50% of those come from <1% of pixels, then it is considered to be noise-dominated and hence unusable.
| Quadrant | # 1 sec bins | Bins with >0 counts | Bins with >2000 counts | High rate bins dominated by noise | Noise dominated (total time) | Noise dominated (detector-on time) | Marked lightcurve |
|---|---|---|---|---|---|---|---|
| A | 8779 | 6395 | 4575 | 4575 | 52.11% | 71.54% | 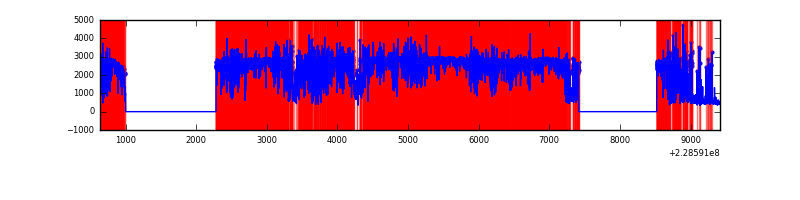 |
| B | 8779 | 6396 | 2 | 2 | 0.02% | 0.03% | 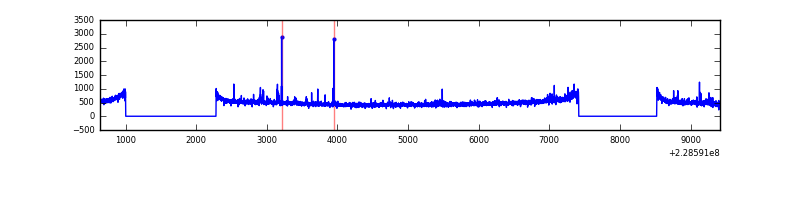 |
| C | 8779 | 6396 | 0 | 0 | 0.00% | 0.00% | 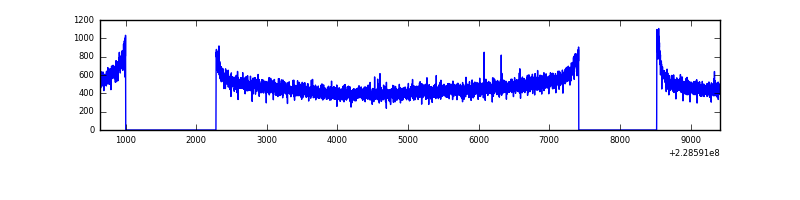 |
| D | 8779 | 6396 | 129 | 129 | 1.47% | 2.02% | 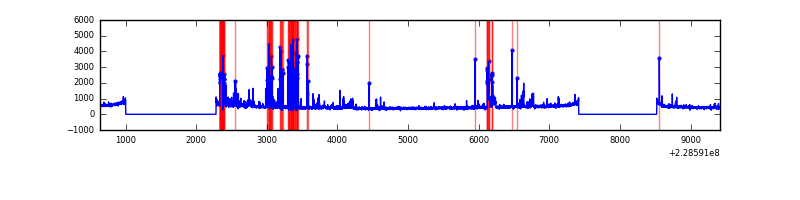 |
Top three noisy pixels from each quadrant. If the there are fewer than three noisy pixels in the level2.evt file, extra rows are filled as -1
| Pixel properties | Quadrant properties | ||||||
|---|---|---|---|---|---|---|---|
| Quadrant | DetID | PixID | Counts | Sigma | Mean | Median | Sigma |
| A | 13 | 170 | 12620904 | 139887.11 | 442 | 432 | 90.2 |
| A | 13 | 248 | 34282 | 375.2 | 442 | 432 | 90.2 |
| A | 0 | 226 | 4038 | 39.97 | 442 | 432 | 90.2 |
| B | 0 | 214 | 29667 | 189.36 | 798 | 778 | 152.6 |
| B | 10 | 16 | 26791 | 170.5 | 798 | 778 | 152.6 |
| B | 0 | 219 | 20648 | 130.24 | 798 | 778 | 152.6 |
| C | 1 | 16 | 30854 | 168.95 | 769 | 774 | 178.0 |
| C | 13 | 61 | 5873 | 28.64 | 769 | 774 | 178.0 |
| C | 8 | 222 | 3800 | 17.0 | 769 | 774 | 178.0 |
| D | 1 | 52 | 420492 | 2301.78 | 749 | 727 | 182.4 |
| D | 13 | 122 | 270101 | 1477.11 | 749 | 727 | 182.4 |
| D | 2 | 234 | 21009 | 111.22 | 749 | 727 | 182.4 |
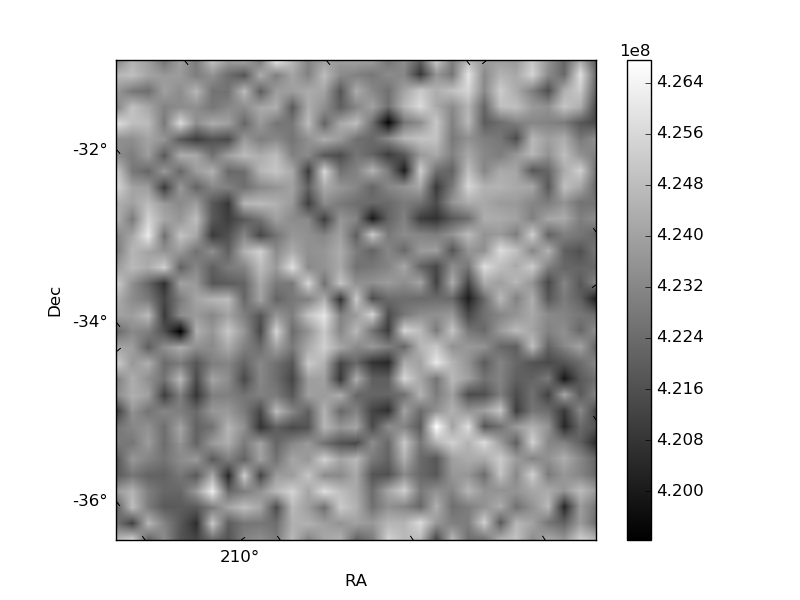
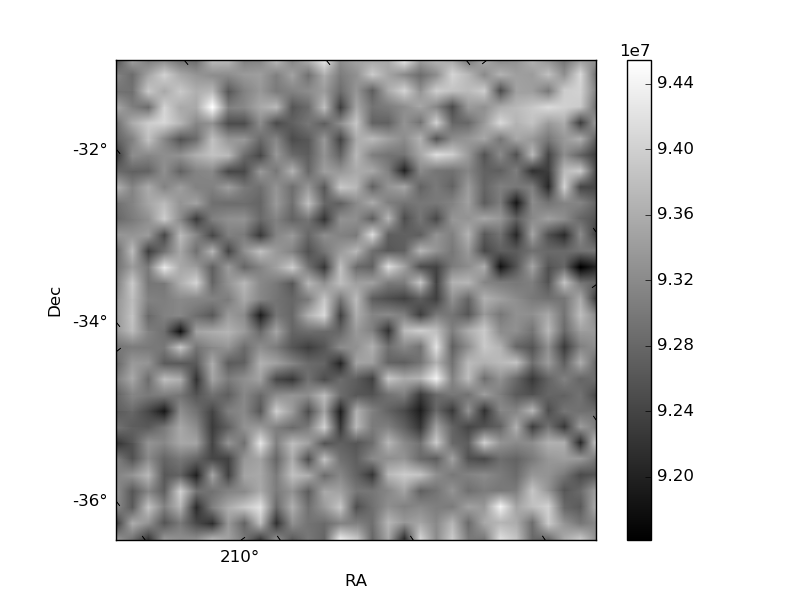
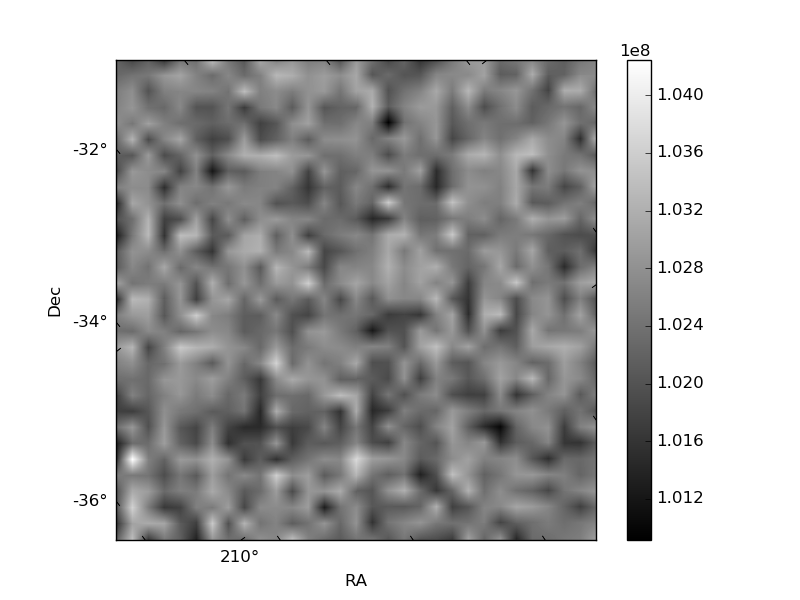
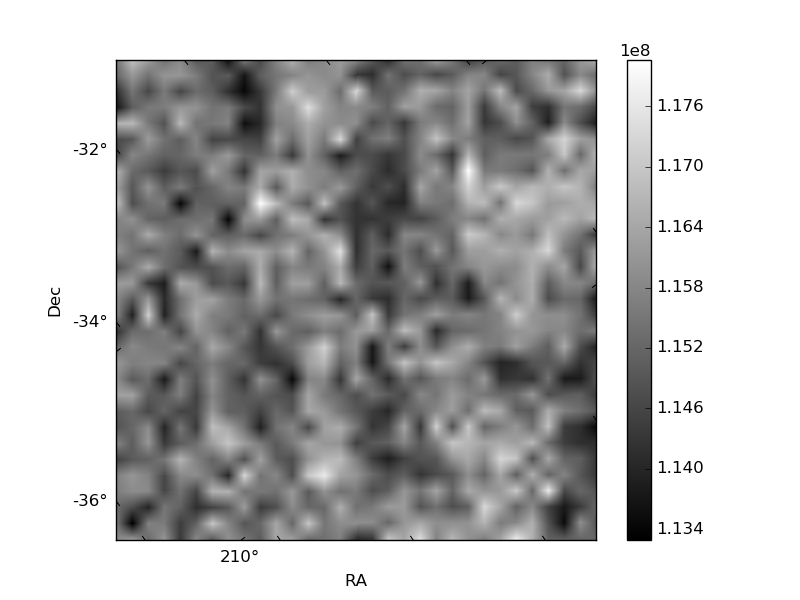
Histogram calculated using DETX and DETY for each event in the final _common_clean file
| Quadrant A | 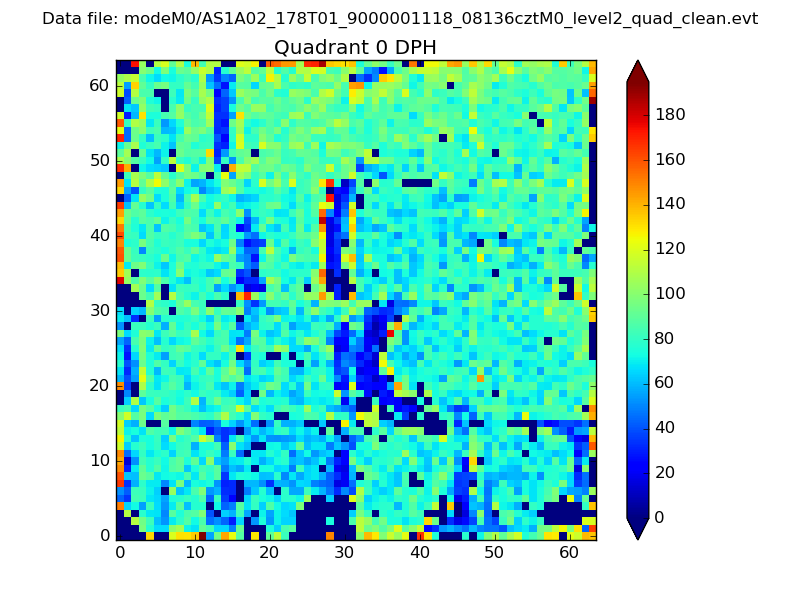 |
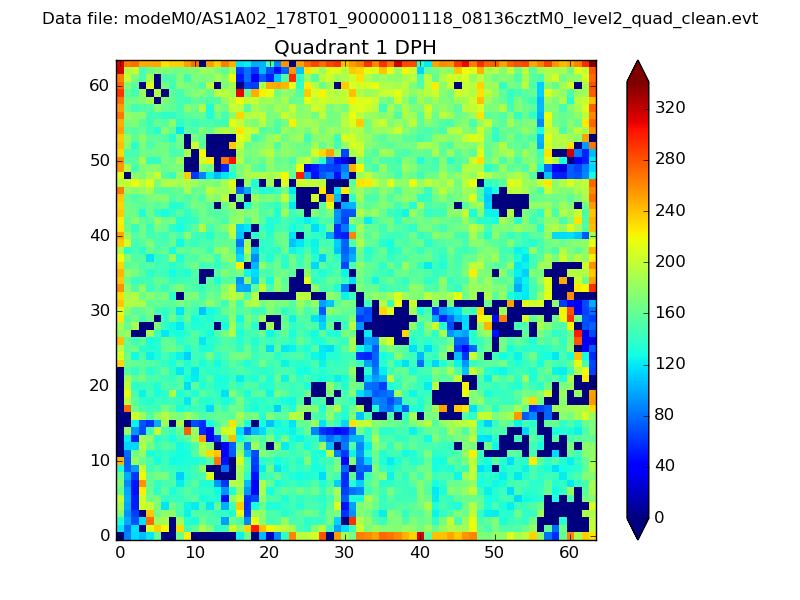 |
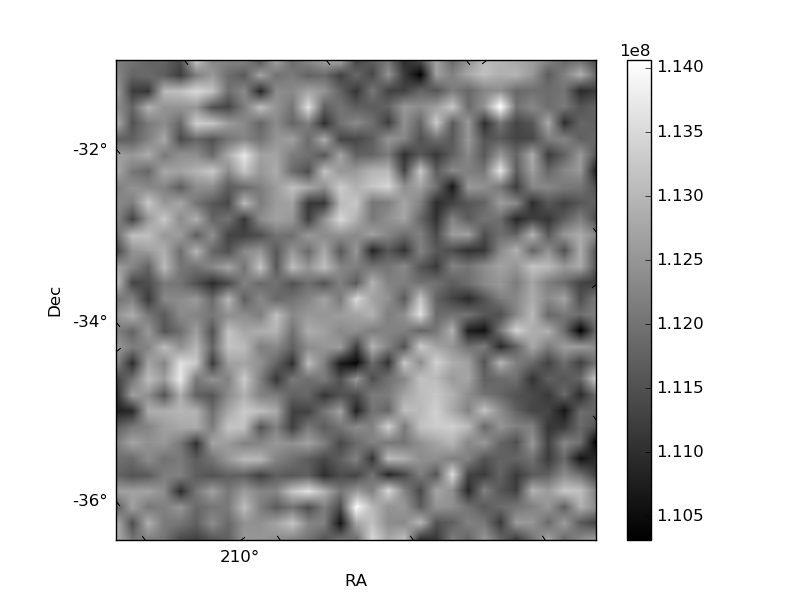
Quadrant B |
|---|---|---|---|
| Quadrant D | 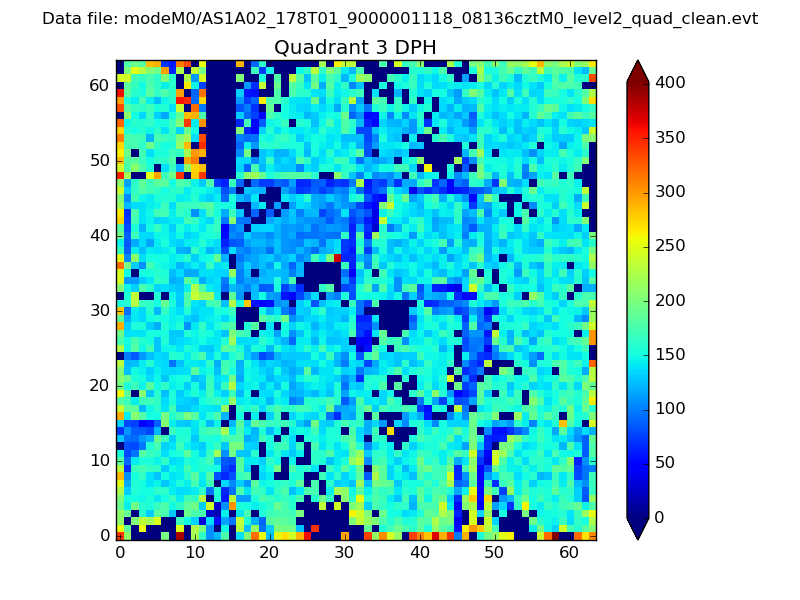 |
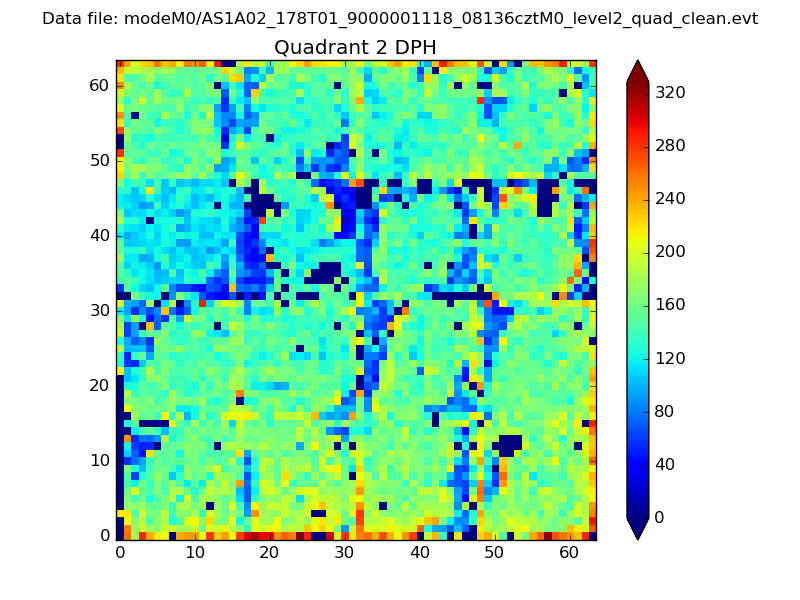 |
Quadrant C |
| Plot type | Count rate plots | Images |
|---|---|---|
| Comparison with Poisson distribution Blue bars denote a histogram of data divided into 1 sec bins. Red curve is a Poisson curve with rate = median count rate of data. |
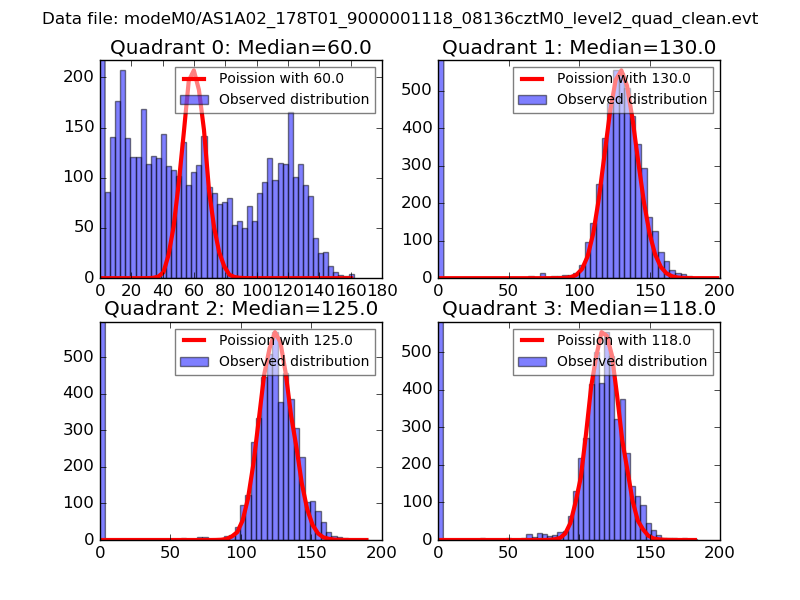 |
 |
| Quadrant-wise count rates Data is divided into 100 sec bins |
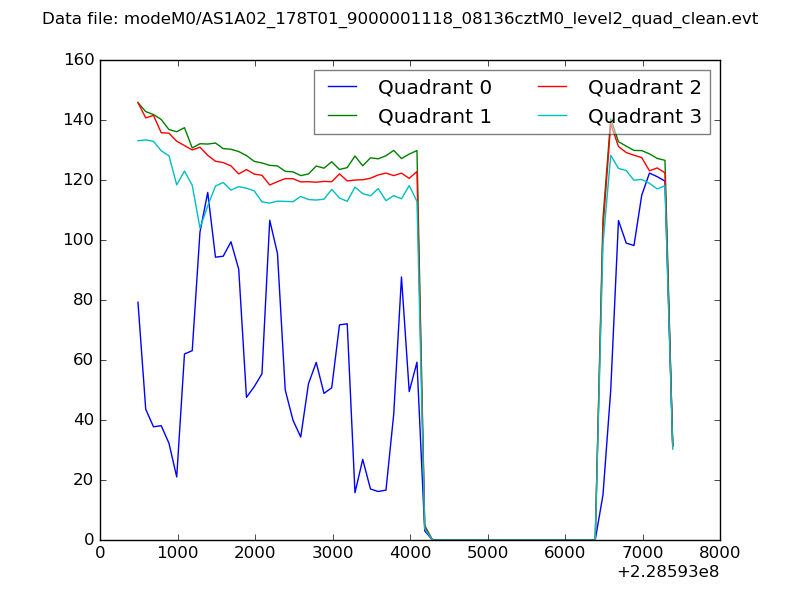 |
|
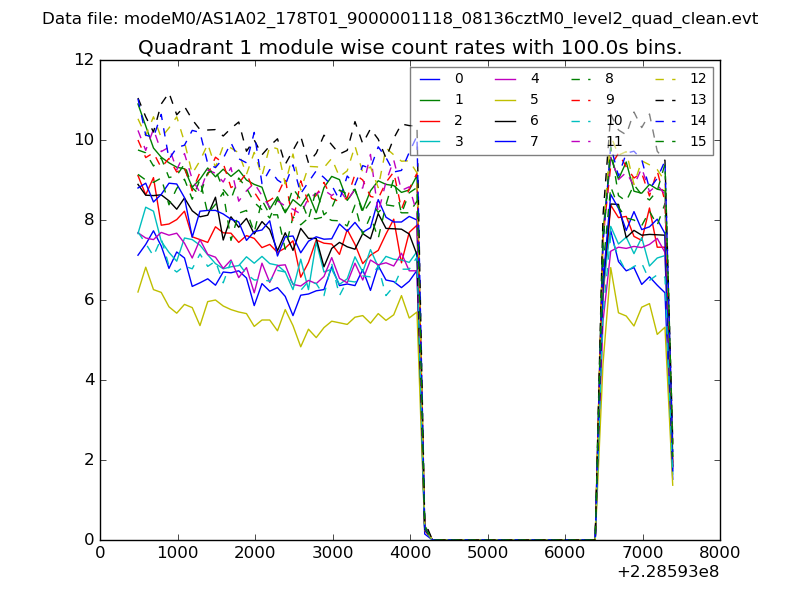
| Module-wise count rates for Quadrant A Data is divided into 100 sec bins |
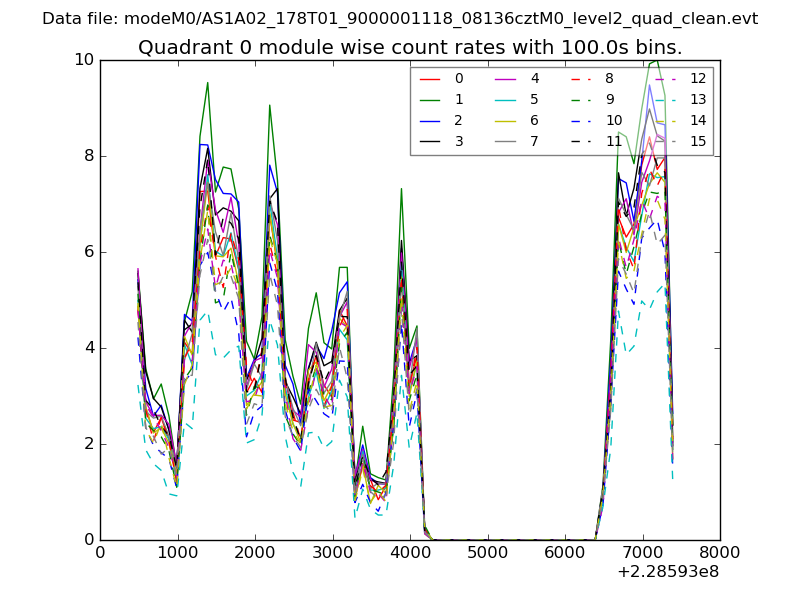 |
 |
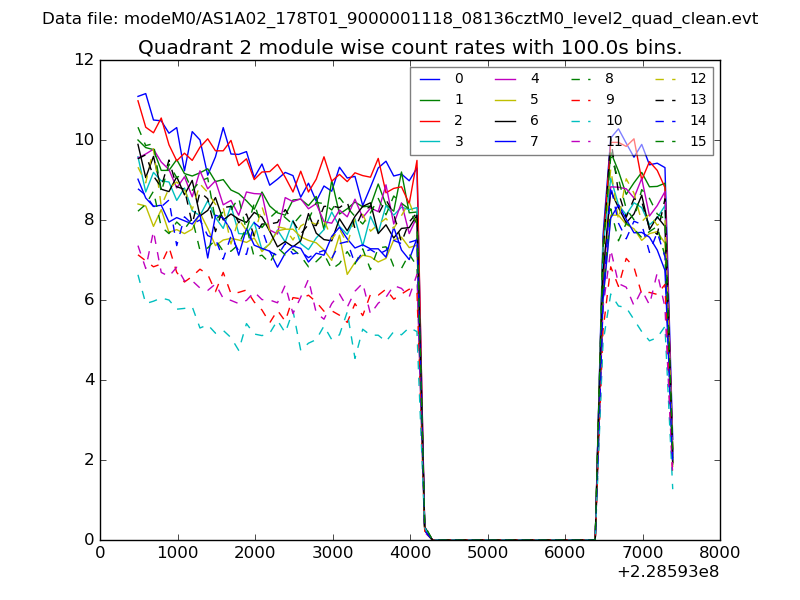
| Module-wise count rates for Quadrant B Data is divided into 100 sec bins |
 |
 |
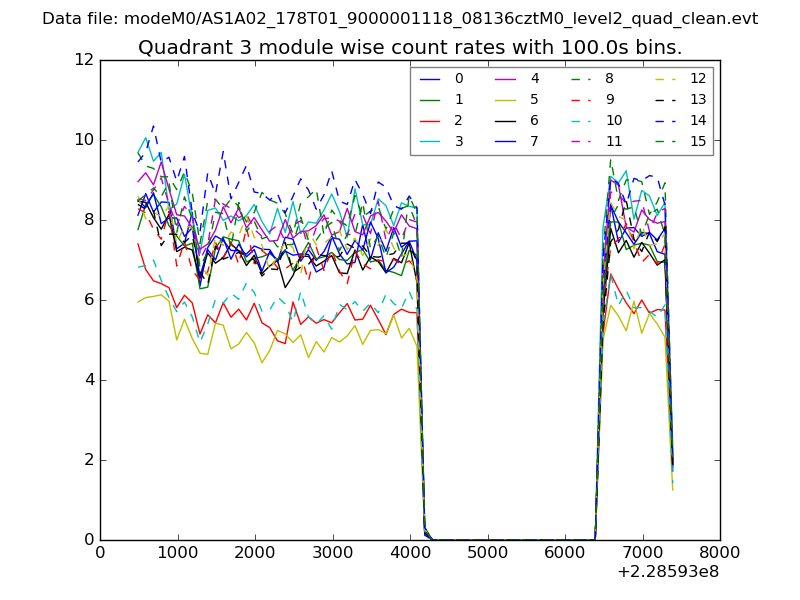
| Module-wise count rates for Quadrant C Data is divided into 100 sec bins |
 |
 |
| Module-wise count rates for Quadrant D Data is divided into 100 sec bins |
 |
 |
| Parameter | Plot |
|---|---|
| CZT HV Monitor | 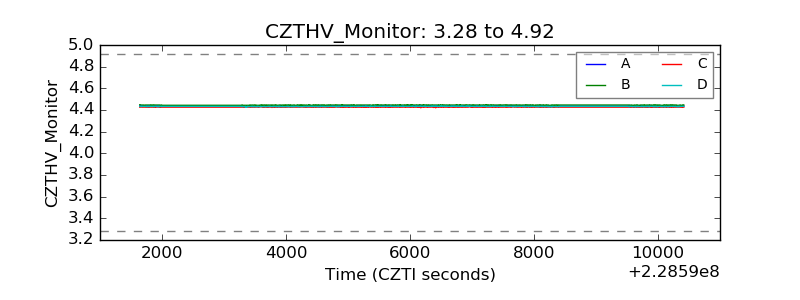 |
| D_VDD | 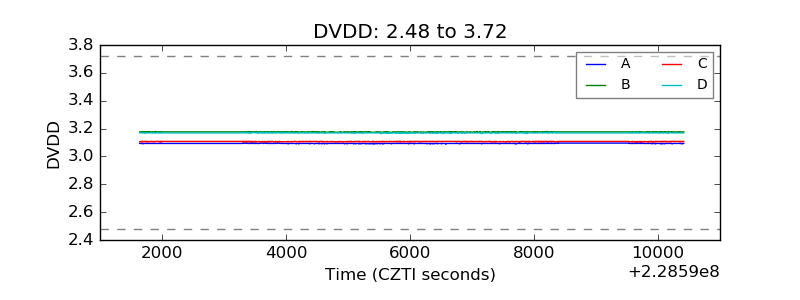 |
| Temperature 1 | 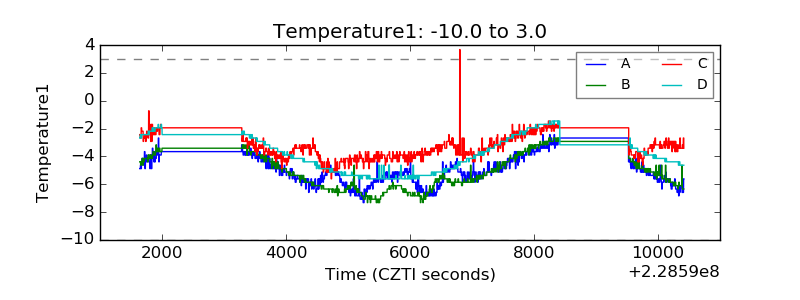 |
| Veto HV Monitor | 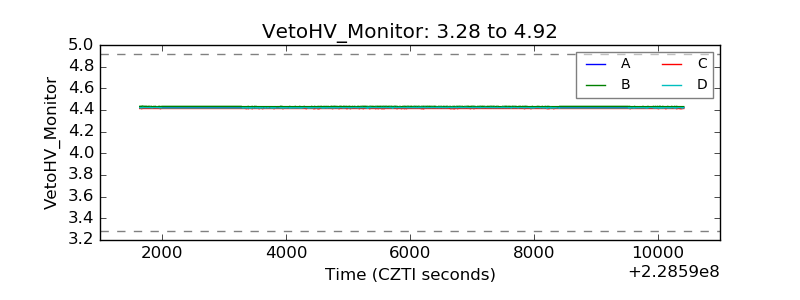 |
| Veto LLD | 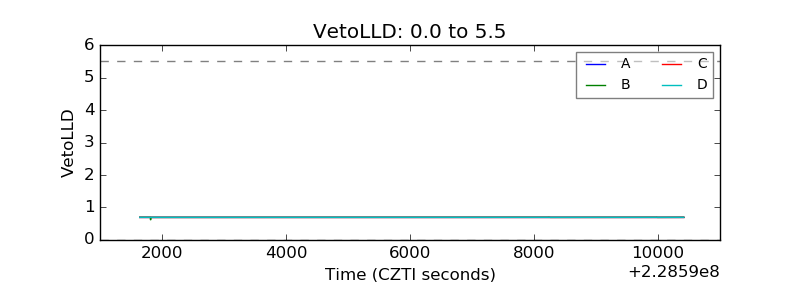 |
| Alpha Counter | 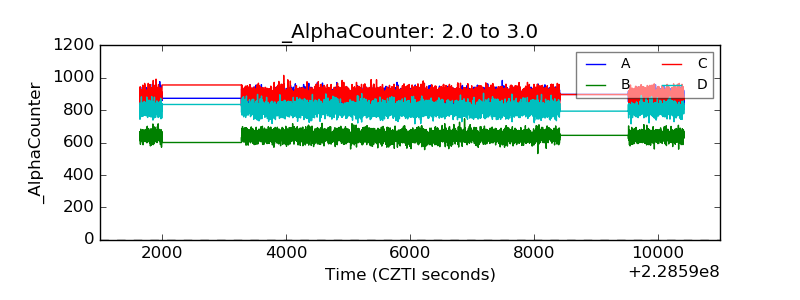 |
| _CPM_Rate | 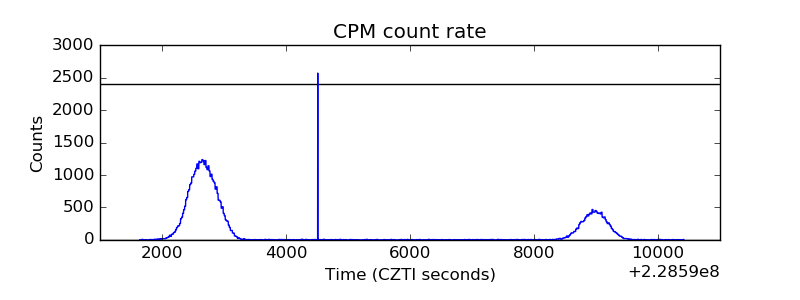 |
| CZT Counter | 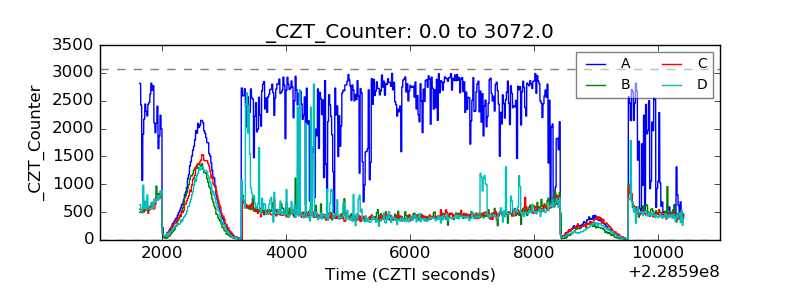 |
| +2.5 Volts monitor |  |
| +5 Volts monitor |  |
| _ROLL_ROT | 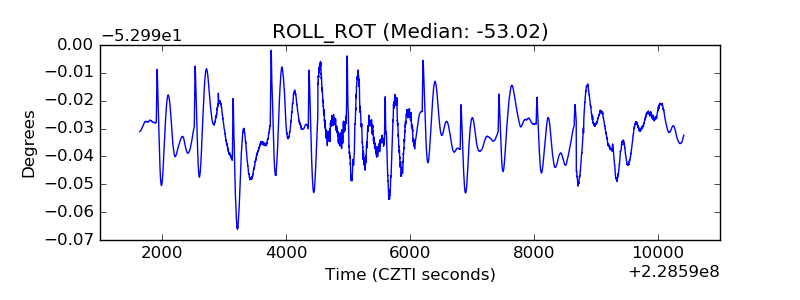 |
| _Roll_DEC | 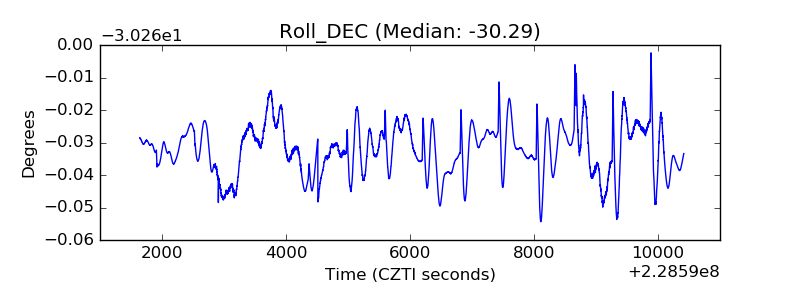 |
| _Roll_RA | 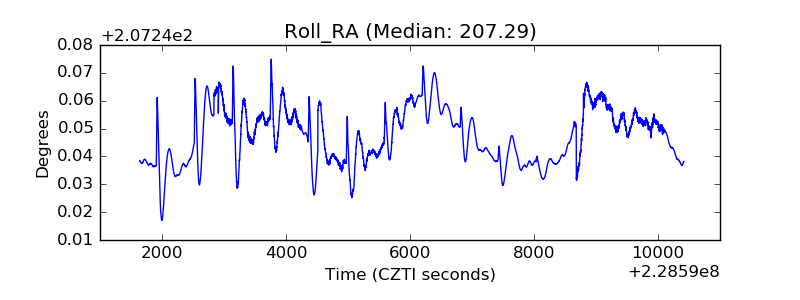 |
| Veto Counter | 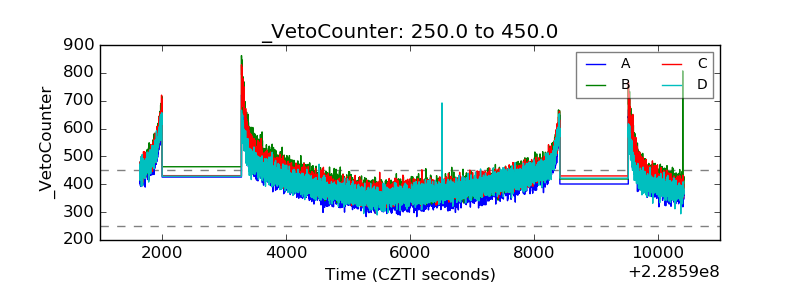 |