| Param | Original file | Final file |
|---|---|---|
| Filename | modeM0/AS1A02_178T01_9000001118_08137cztM0_level2.evt | modeM0/AS1A02_178T01_9000001118_08137cztM0_level2_quad_clean.evt |
| Size (bytes) | 137,499,840 | 17,475,840 |
| Size | 131.1 MB | 16.7 MB |
| Events in quadrant A | 1,992,055 | 87,684 |
| Events in quadrant B | 732,435 | 118,730 |
| Events in quadrant C | 682,714 | 115,905 |
| Events in quadrant D | 666,673 | 109,413 |
| Mode SS | |||
|---|---|---|---|
| Quadrant | BADHDUFLAG | Total packets | Discarded packets |
| A | 0 | 28 | 0 |
| B | 0 | 28 | 0 |
| C | 0 | 28 | 0 |
| D | 0 | 28 | 0 |
| Mode M0 | |||
|---|---|---|---|
| Quadrant | BADHDUFLAG | Total packets | Discarded packets |
| A | 0 | 6798 | 1 |
| B | 0 | 3015 | 1 |
| C | 0 | 2860 | 1 |
| D | 0 | 2842 | 1 |
| Mode M9 | |||
|---|---|---|---|
| Quadrant | BADHDUFLAG | Total packets | Discarded packets |
| A | 0 | 11 | 0 |
| B | 0 | 11 | 0 |
| C | 0 | 11 | 0 |
| D | 0 | 11 | 0 |
| Quadrant | Total seconds | Saturated seconds | Saturation percentage |
|---|---|---|---|
| A | 1288 | 607 | 47.127329% |
| B | 1288 | 45 | 3.493789% |
| C | 1288 | 13 | 1.009317% |
| D | 1288 | 9 | 0.698758% |
Noise dominated data is calculated using 1-second bins in cleaned event files. If a bin has >2000 counts, and if more than 50% of those come from <1% of pixels, then it is considered to be noise-dominated and hence unusable.
| Quadrant | # 1 sec bins | Bins with >0 counts | Bins with >2000 counts | High rate bins dominated by noise | Noise dominated (total time) | Noise dominated (detector-on time) | Marked lightcurve |
|---|---|---|---|---|---|---|---|
| A | 2393 | 1288 | 504 | 504 | 21.06% | 39.13% | 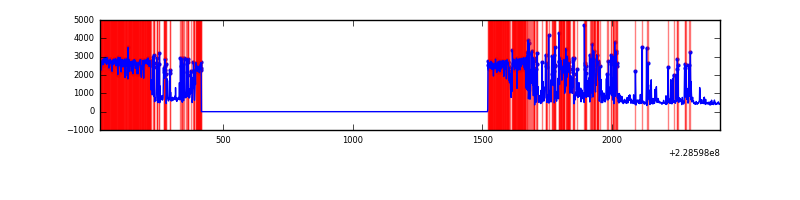 |
| B | 2393 | 1289 | 0 | 0 | 0.00% | 0.00% | 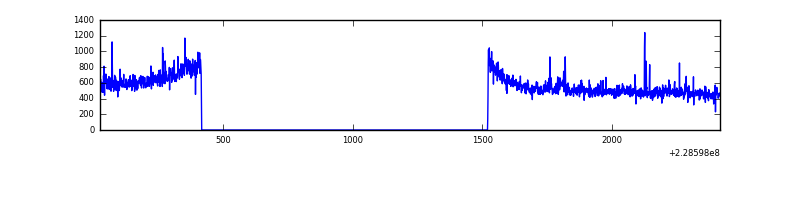 |
| C | 2393 | 1289 | 0 | 0 | 0.00% | 0.00% | 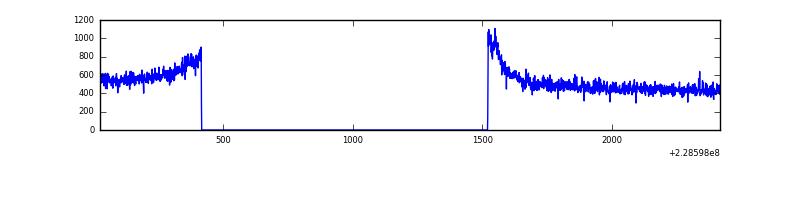 |
| D | 2393 | 1289 | 1 | 1 | 0.04% | 0.08% | 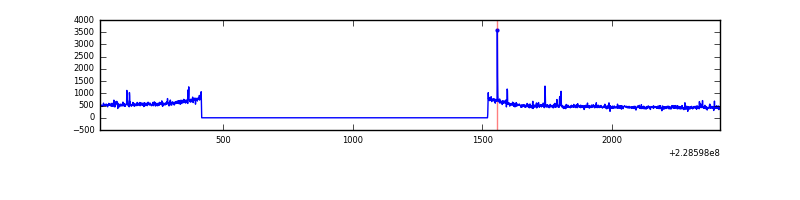 |
Top three noisy pixels from each quadrant. If the there are fewer than three noisy pixels in the level2.evt file, extra rows are filled as -1
| Pixel properties | Quadrant properties | ||||||
|---|---|---|---|---|---|---|---|
| Quadrant | DetID | PixID | Counts | Sigma | Mean | Median | Sigma |
| A | 13 | 170 | 1483109 | 53479.62 | 123 | 120 | 27.7 |
| A | 13 | 248 | 33979 | 1221.02 | 123 | 120 | 27.7 |
| A | 0 | 226 | 1135 | 36.6 | 123 | 120 | 27.7 |
| B | 0 | 214 | 21164 | 577.89 | 177 | 172 | 36.3 |
| B | 0 | 197 | 7088 | 190.39 | 177 | 172 | 36.3 |
| B | 0 | 219 | 6821 | 183.04 | 177 | 172 | 36.3 |
| C | 1 | 16 | 18639 | 440.04 | 170 | 170 | 42.0 |
| C | 13 | 61 | 1314 | 27.26 | 170 | 170 | 42.0 |
| C | 14 | 67 | 549 | 9.03 | 170 | 170 | 42.0 |
| D | 1 | 52 | 20440 | 471.93 | 168 | 162 | 43.0 |
| D | 12 | 233 | 7051 | 160.33 | 168 | 162 | 43.0 |
| D | 2 | 234 | 3997 | 89.25 | 168 | 162 | 43.0 |
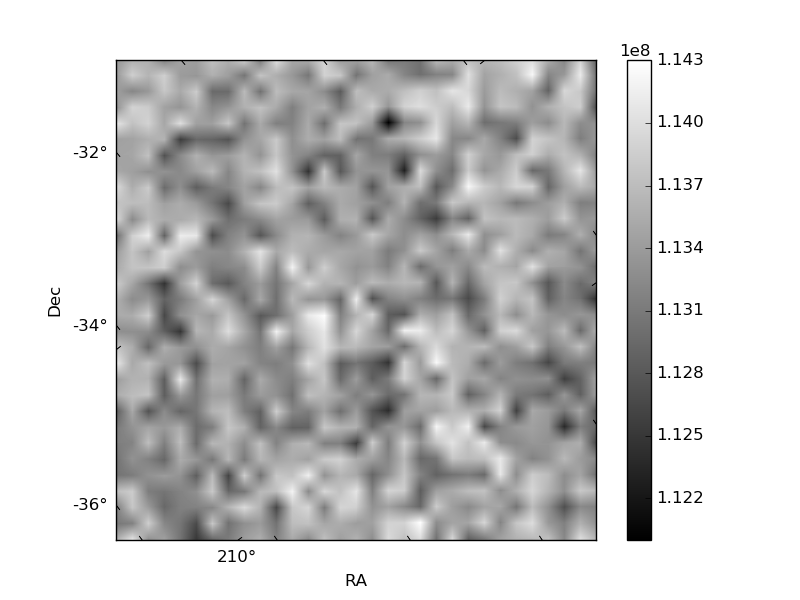
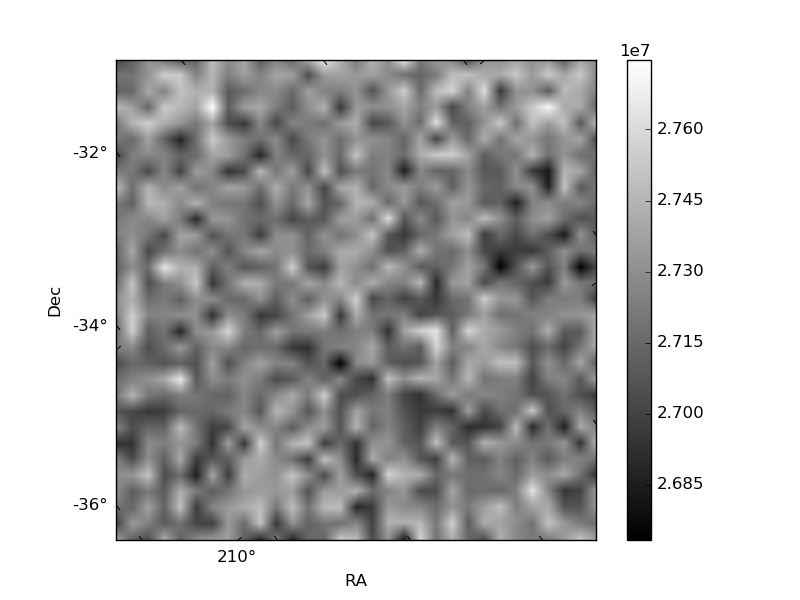
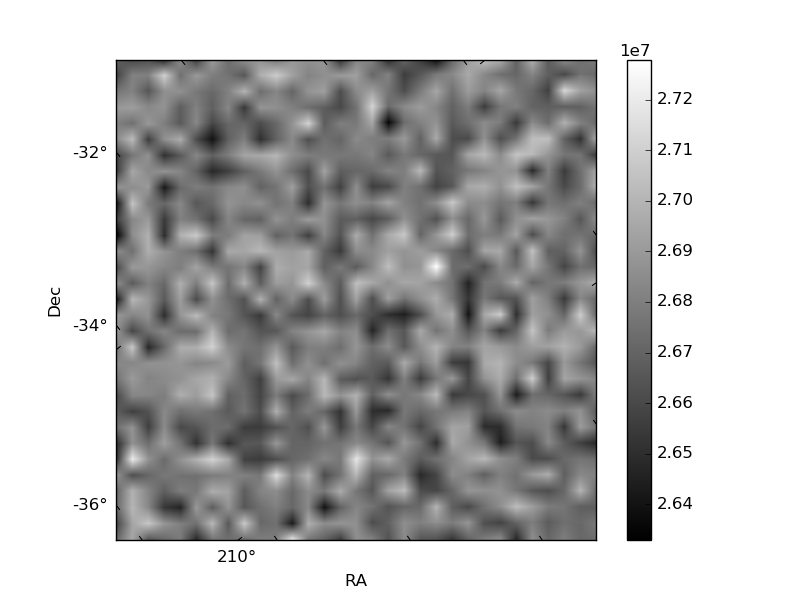
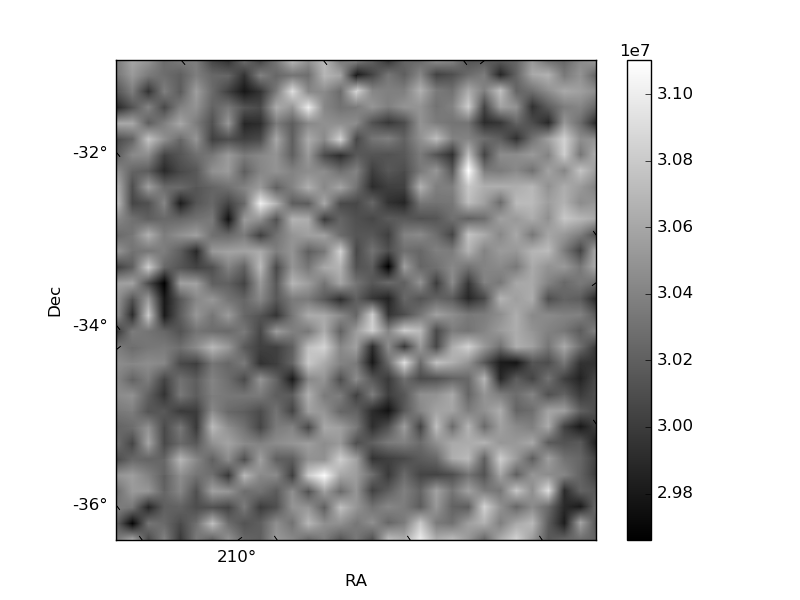
Histogram calculated using DETX and DETY for each event in the final _common_clean file
| Quadrant A | 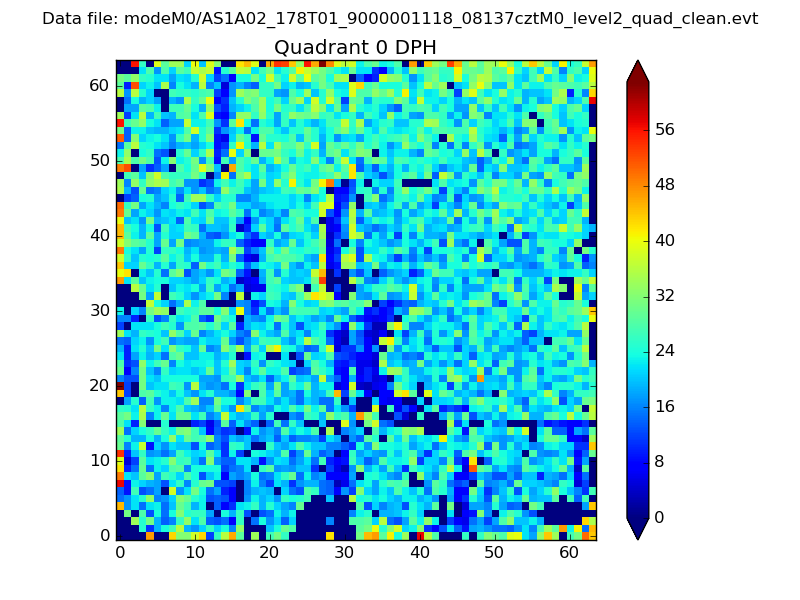 |
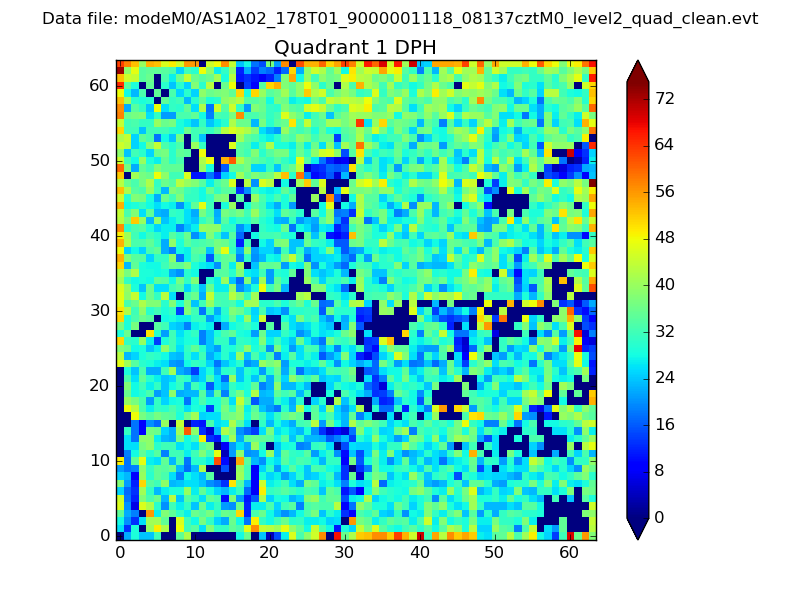 |
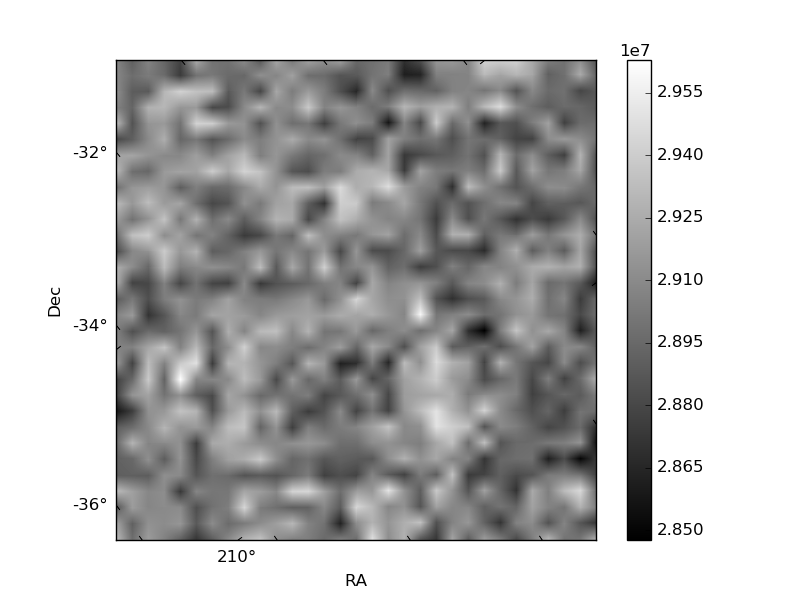
Quadrant B |
|---|---|---|---|
| Quadrant D | 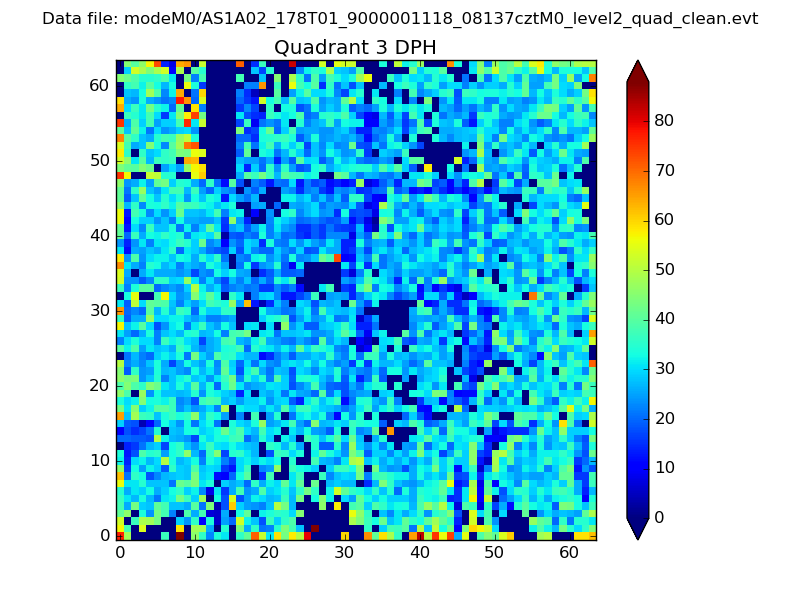 |
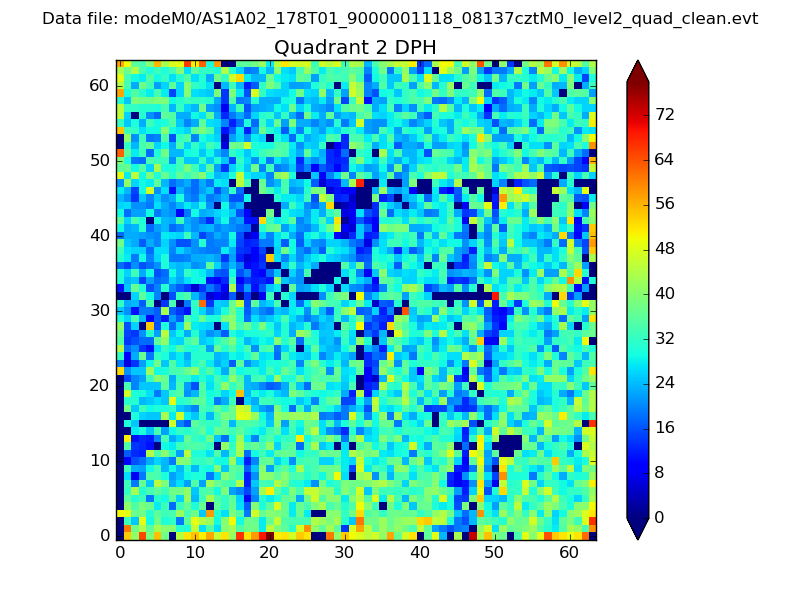 |
Quadrant C |
| Plot type | Count rate plots | Images |
|---|---|---|
| Comparison with Poisson distribution Blue bars denote a histogram of data divided into 1 sec bins. Red curve is a Poisson curve with rate = median count rate of data. |
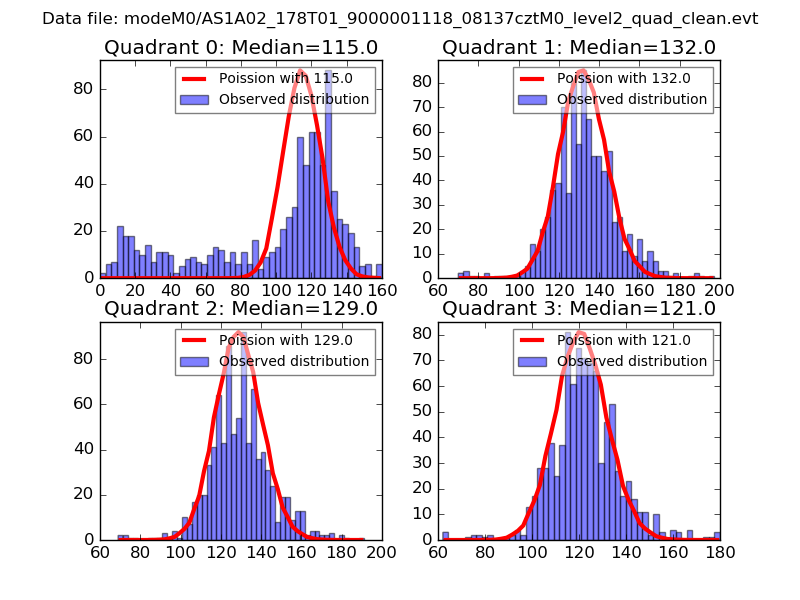 |
 |
| Quadrant-wise count rates Data is divided into 100 sec bins |
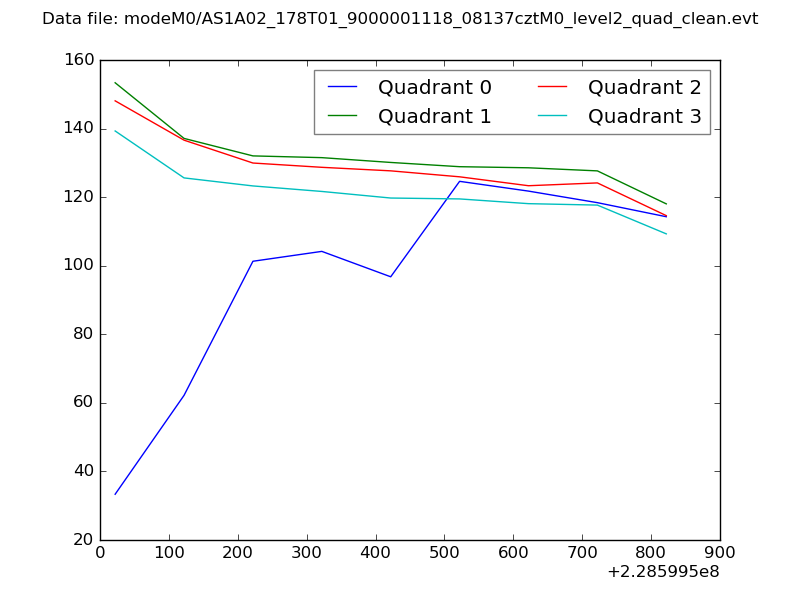 |
|
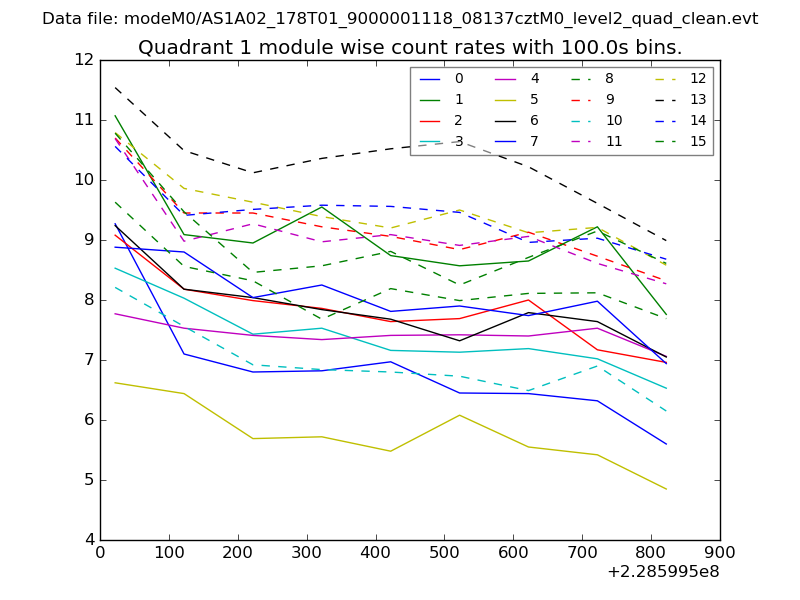
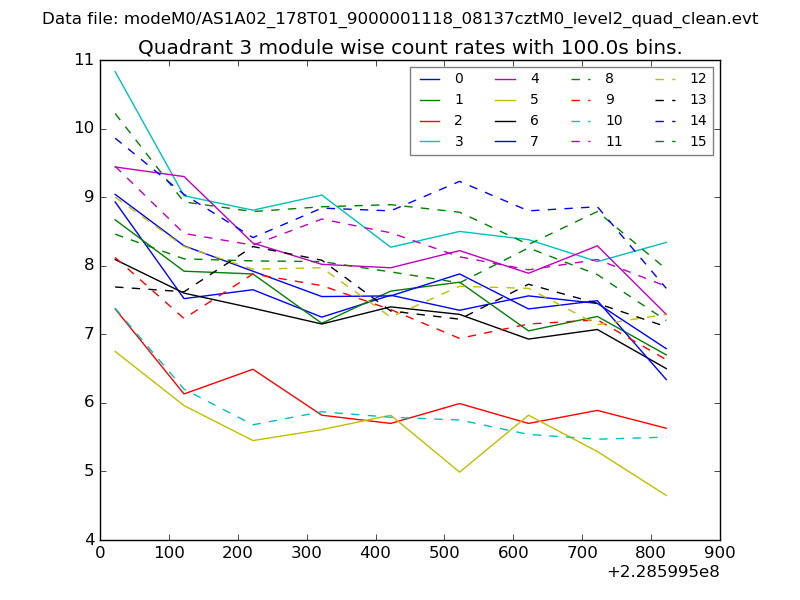
| Module-wise count rates for Quadrant A Data is divided into 100 sec bins |
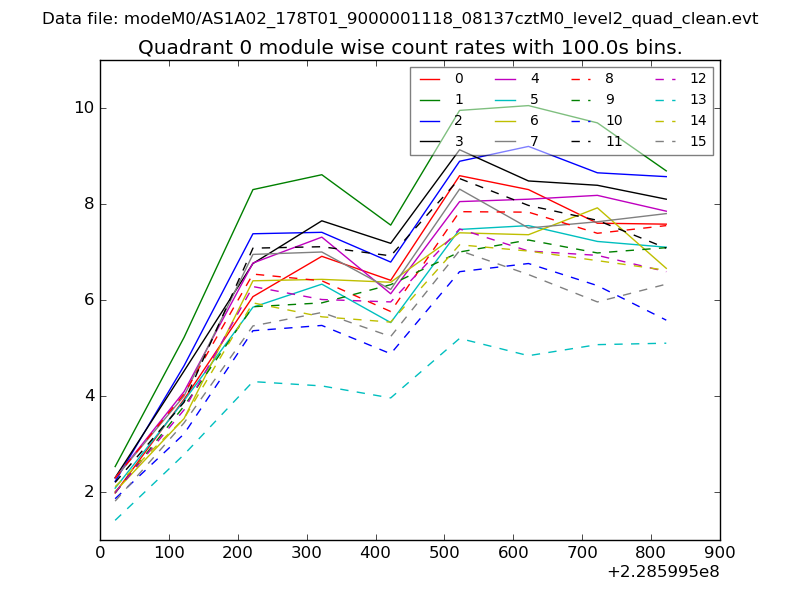 |
 |
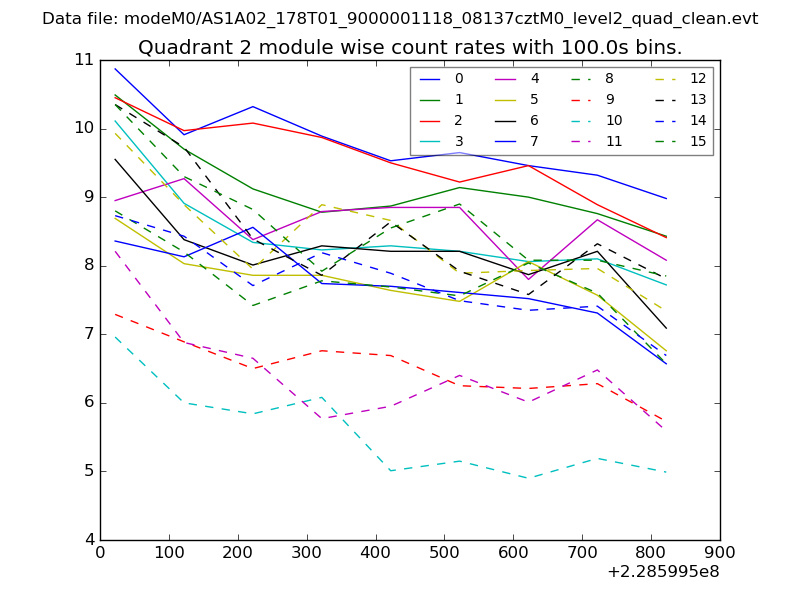
| Module-wise count rates for Quadrant B Data is divided into 100 sec bins |
 |
 |
| Module-wise count rates for Quadrant C Data is divided into 100 sec bins |
 |
 |
| Module-wise count rates for Quadrant D Data is divided into 100 sec bins |
 |
 |
| Parameter | Plot |
|---|---|
| CZT HV Monitor | 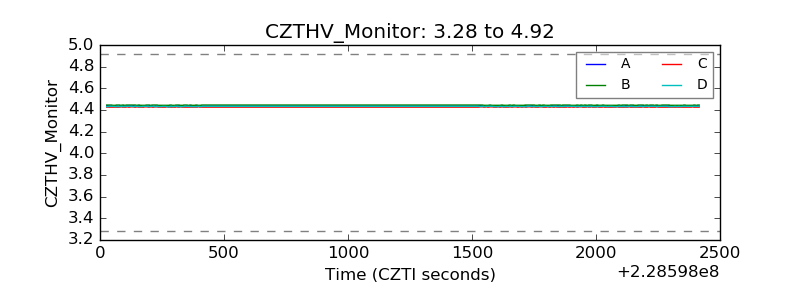 |
| D_VDD | 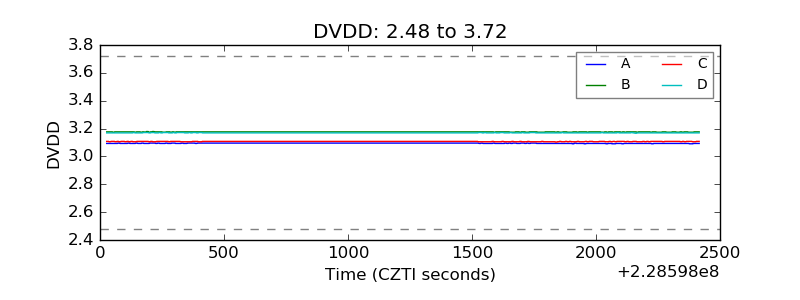 |
| Temperature 1 | 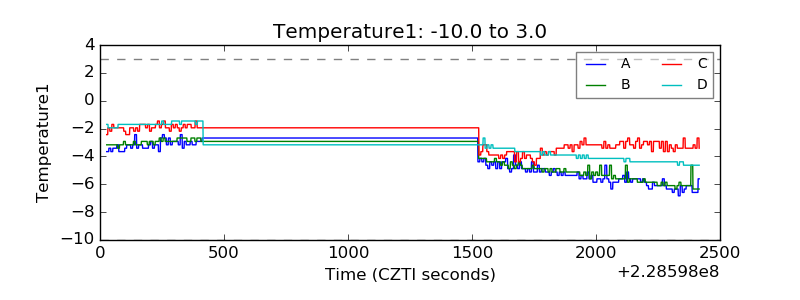 |
| Veto HV Monitor | 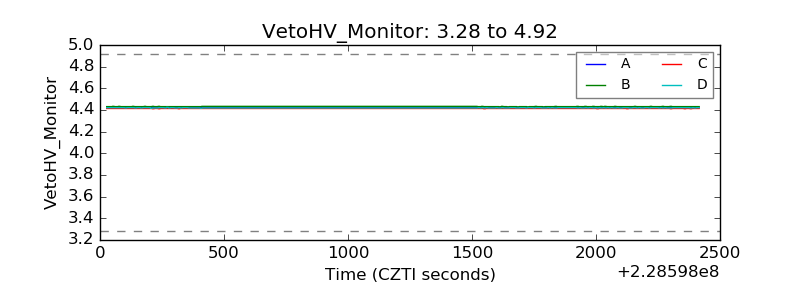 |
| Veto LLD | 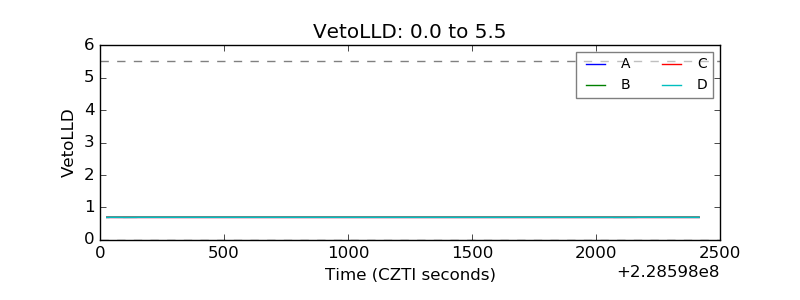 |
| Alpha Counter | 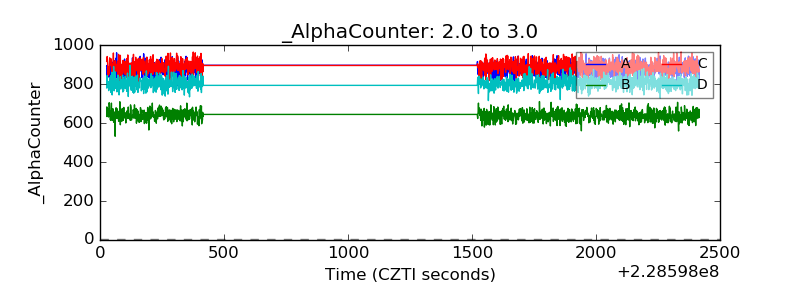 |
| _CPM_Rate | 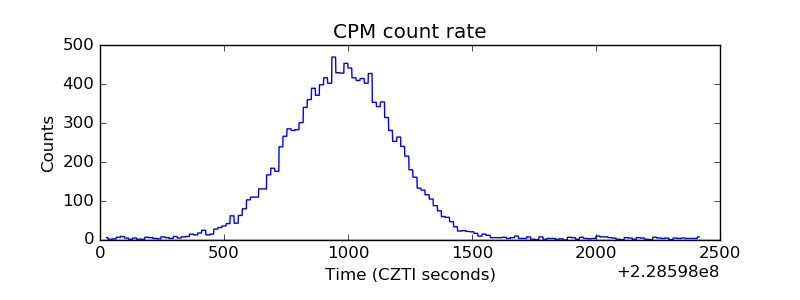 |
| CZT Counter | 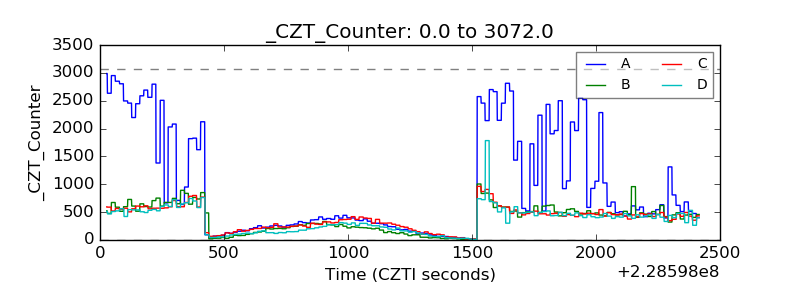 |
| +2.5 Volts monitor |  |
| +5 Volts monitor |  |
| _ROLL_ROT | 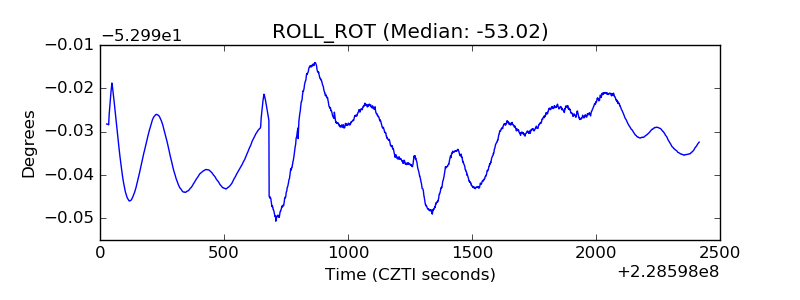 |
| _Roll_DEC | 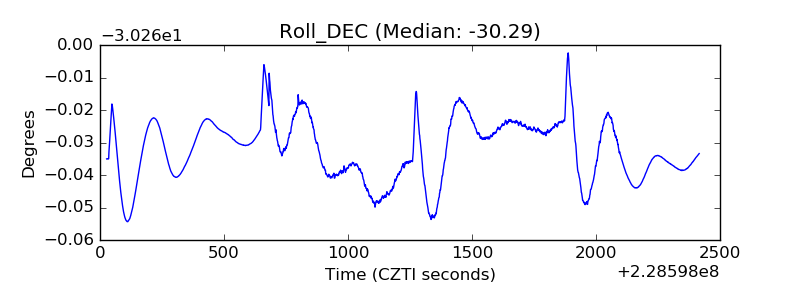 |
| _Roll_RA | 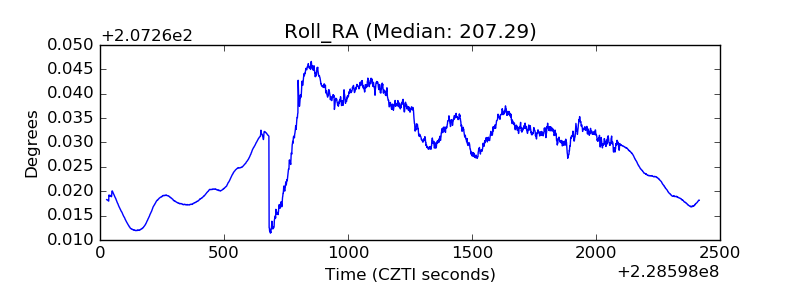 |
| Veto Counter | 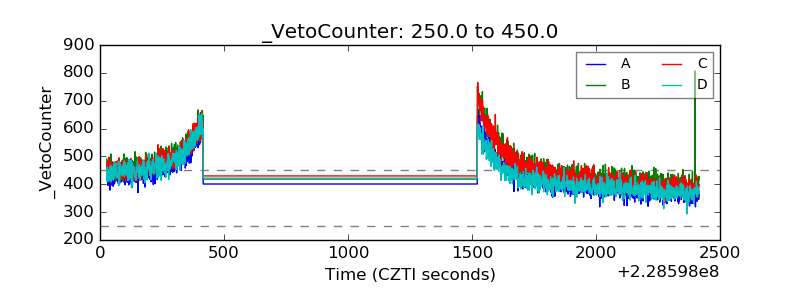 |