| Param | Original file | Final file |
|---|---|---|
| Filename | modeM0/AS1A03_051T01_9000001120_08136cztM0_level2.evt | modeM0/AS1A03_051T01_9000001120_08136cztM0_level2_quad_clean.evt |
| Size (bytes) | 22,631,040 | 7,531,200 |
| Size | 21.6 MB | 7.2 MB |
| Events in quadrant A | 167,449 | 48,439 |
| Events in quadrant B | 169,882 | 49,396 |
| Events in quadrant C | 159,421 | 47,571 |
| Events in quadrant D | 157,201 | 45,515 |
| Mode SS | |||
|---|---|---|---|
| Quadrant | BADHDUFLAG | Total packets | Discarded packets |
| A | 0 | 8 | 0 |
| B | 0 | 8 | 0 |
| C | 0 | 8 | 0 |
| D | 0 | 8 | 0 |
| Mode M0 | |||
|---|---|---|---|
| Quadrant | BADHDUFLAG | Total packets | Discarded packets |
| A | 0 | 824 | 1 |
| B | 0 | 817 | 0 |
| C | 0 | 816 | 0 |
| D | 0 | 830 | 0 |
| Quadrant | Total seconds | Saturated seconds | Saturation percentage |
|---|---|---|---|
| A | 408 | 0 | 0.000000% |
| B | 408 | 0 | 0.000000% |
| C | 408 | 0 | 0.000000% |
| D | 408 | 1 | 0.245098% |
Noise dominated data is calculated using 1-second bins in cleaned event files. If a bin has >2000 counts, and if more than 50% of those come from <1% of pixels, then it is considered to be noise-dominated and hence unusable.
| Quadrant | # 1 sec bins | Bins with >0 counts | Bins with >2000 counts | High rate bins dominated by noise | Noise dominated (total time) | Noise dominated (detector-on time) | Marked lightcurve |
|---|---|---|---|---|---|---|---|
| A | 408 | 408 | 0 | 0 | 0.00% | 0.00% | 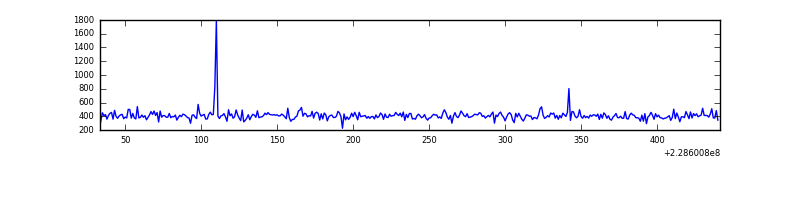 |
| B | 408 | 408 | 0 | 0 | 0.00% | 0.00% | 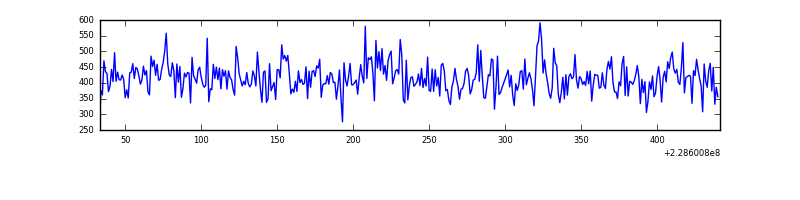 |
| C | 408 | 408 | 0 | 0 | 0.00% | 0.00% | 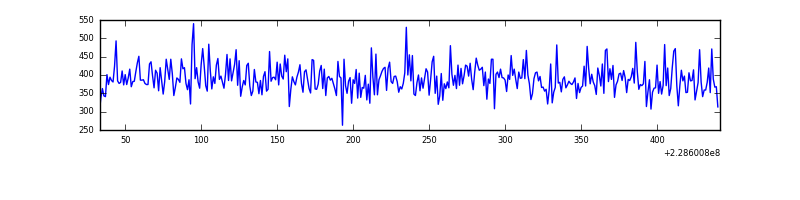 |
| D | 408 | 408 | 1 | 1 | 0.25% | 0.25% | 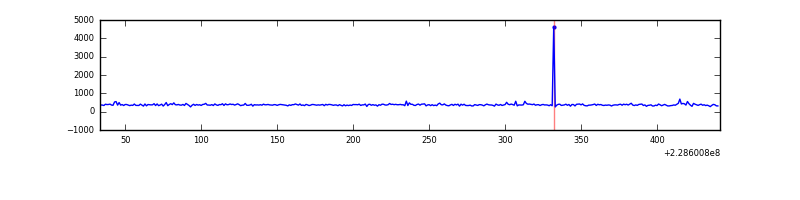 |
Top three noisy pixels from each quadrant. If the there are fewer than three noisy pixels in the level2.evt file, extra rows are filled as -1
| Pixel properties | Quadrant properties | ||||||
|---|---|---|---|---|---|---|---|
| Quadrant | DetID | PixID | Counts | Sigma | Mean | Median | Sigma |
| A | 13 | 170 | 4446 | 404.67 | 42 | 41 | 10.9 |
| A | 0 | 226 | 398 | 32.8 | 42 | 41 | 10.9 |
| A | 8 | 15 | 394 | 32.43 | 42 | 41 | 10.9 |
| B | 0 | 219 | 4028 | 382.43 | 42 | 41 | 10.4 |
| B | 12 | 111 | 928 | 85.08 | 42 | 41 | 10.4 |
| B | 11 | 111 | 664 | 59.76 | 42 | 41 | 10.4 |
| C | 14 | 67 | 380 | 30.15 | 40 | 40 | 11.3 |
| C | 13 | 61 | 290 | 22.17 | 40 | 40 | 11.3 |
| C | 8 | 222 | 246 | 18.27 | 40 | 40 | 11.3 |
| D | 1 | 52 | 5866 | 490.3 | 39 | 38 | 11.9 |
| D | 2 | 234 | 1237 | 100.87 | 39 | 38 | 11.9 |
| D | 2 | 14 | 781 | 62.51 | 39 | 38 | 11.9 |
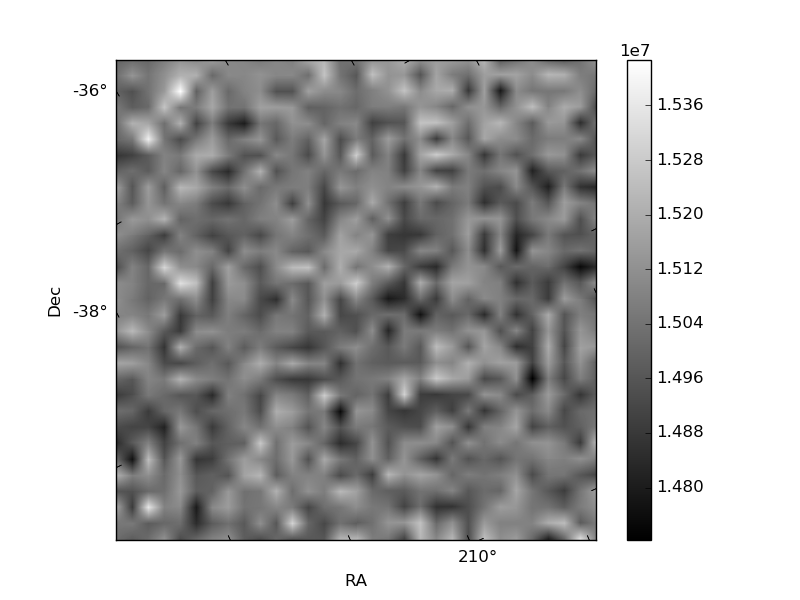
Histogram calculated using DETX and DETY for each event in the final _common_clean file
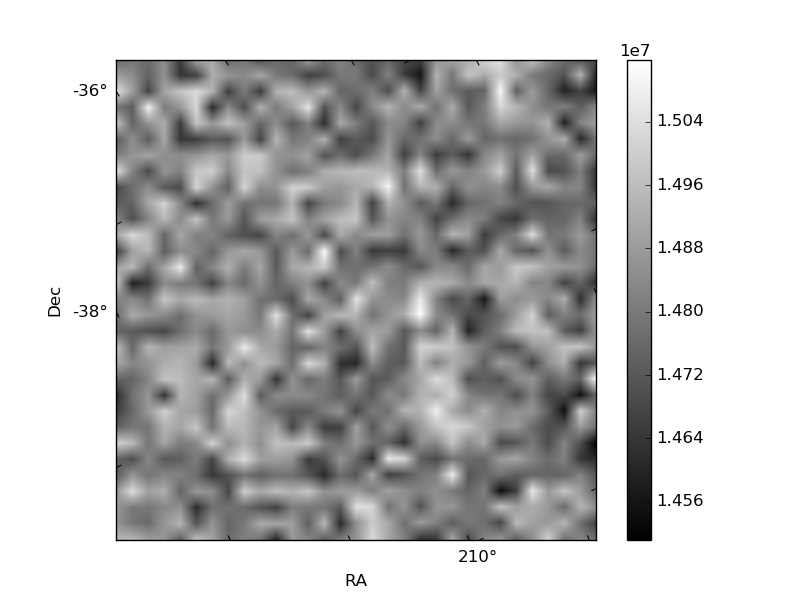
| Quadrant A | 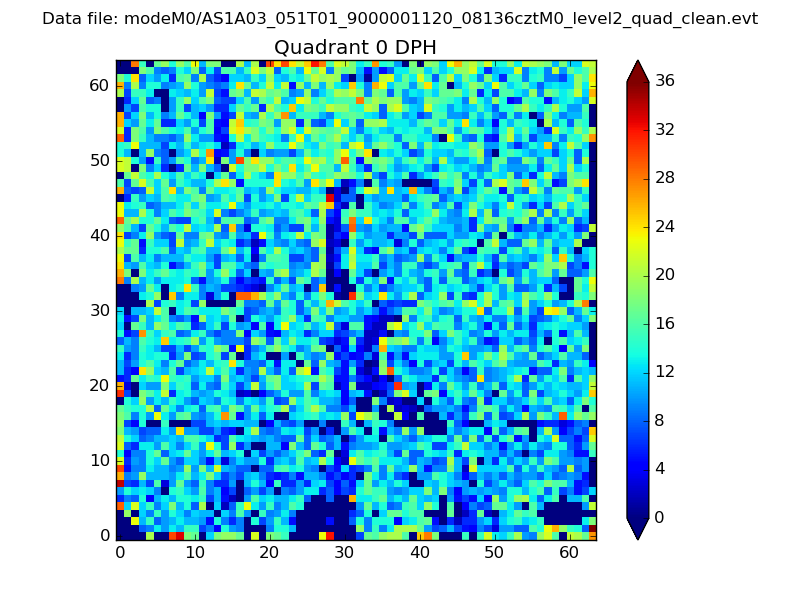 |
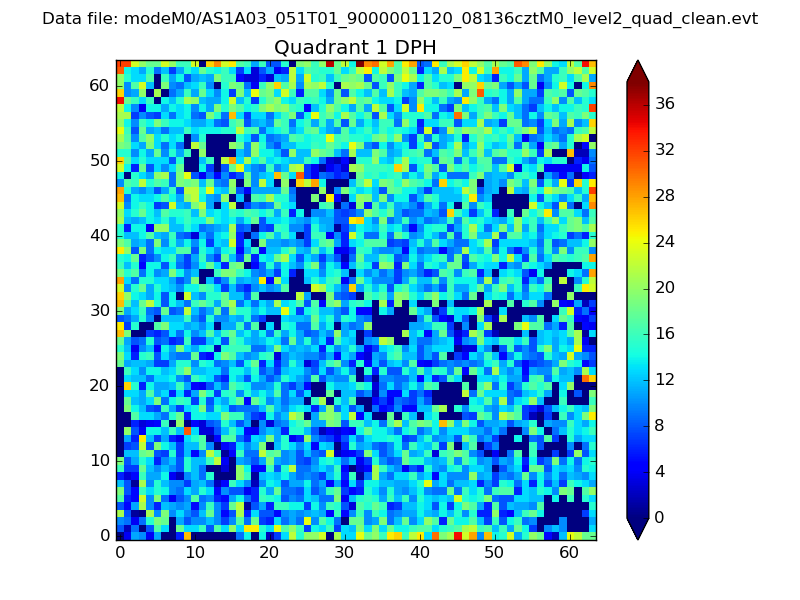 |
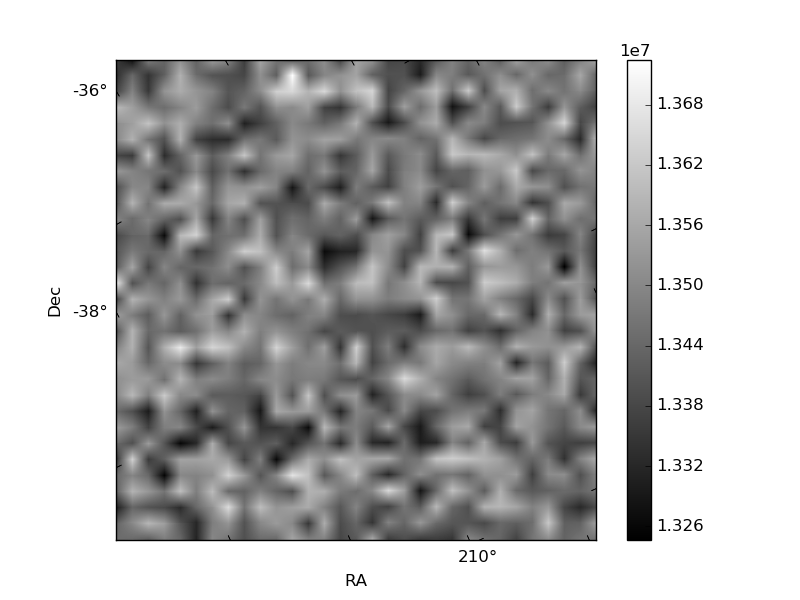
Quadrant B |
|---|---|---|---|
| Quadrant D | 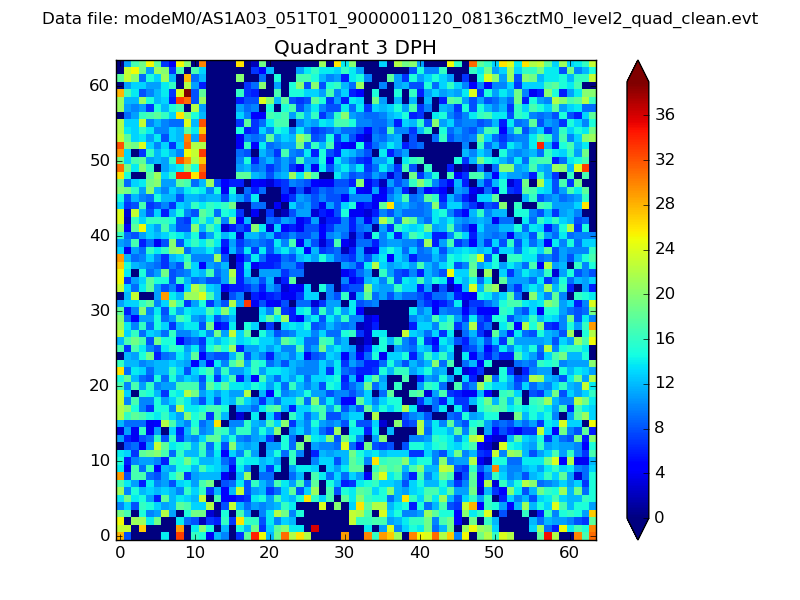 |
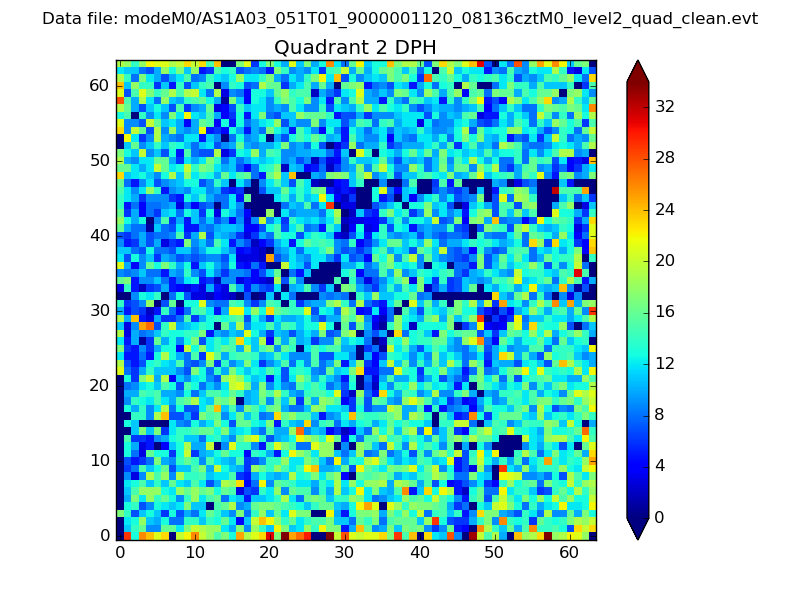 |
Quadrant C |
| Plot type | Count rate plots | Images |
|---|---|---|
| Comparison with Poisson distribution Blue bars denote a histogram of data divided into 1 sec bins. Red curve is a Poisson curve with rate = median count rate of data. |
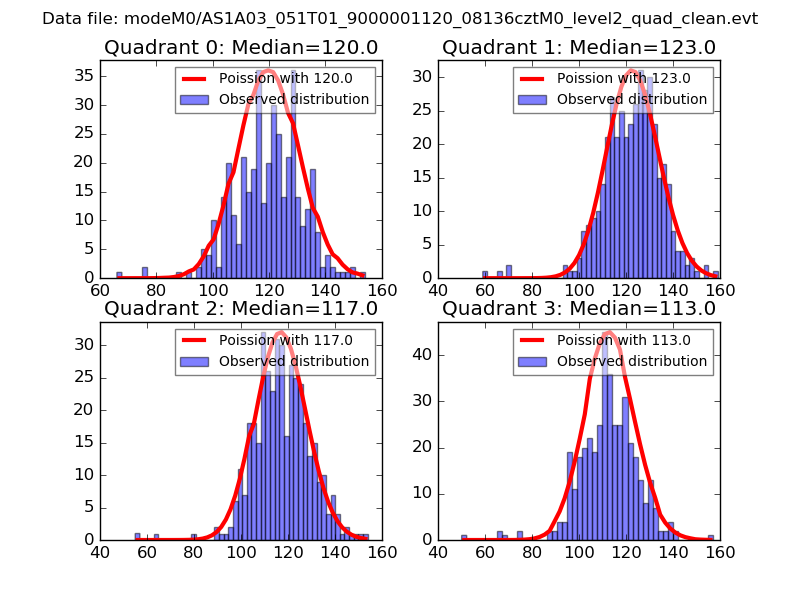 |
 |
| Quadrant-wise count rates Data is divided into 100 sec bins |
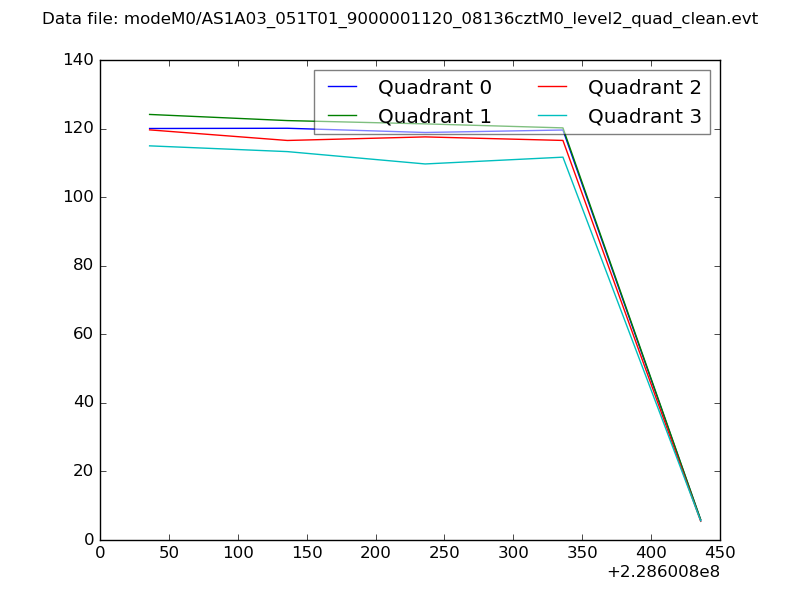 |
|
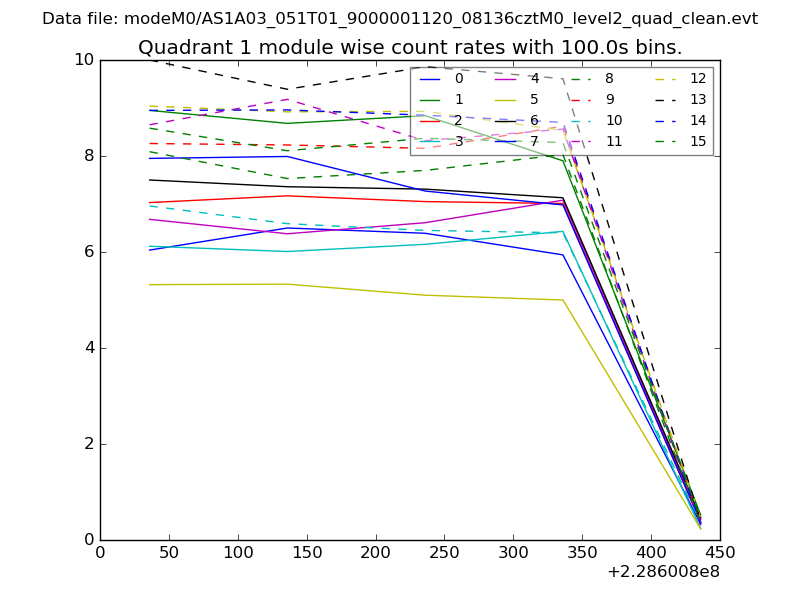
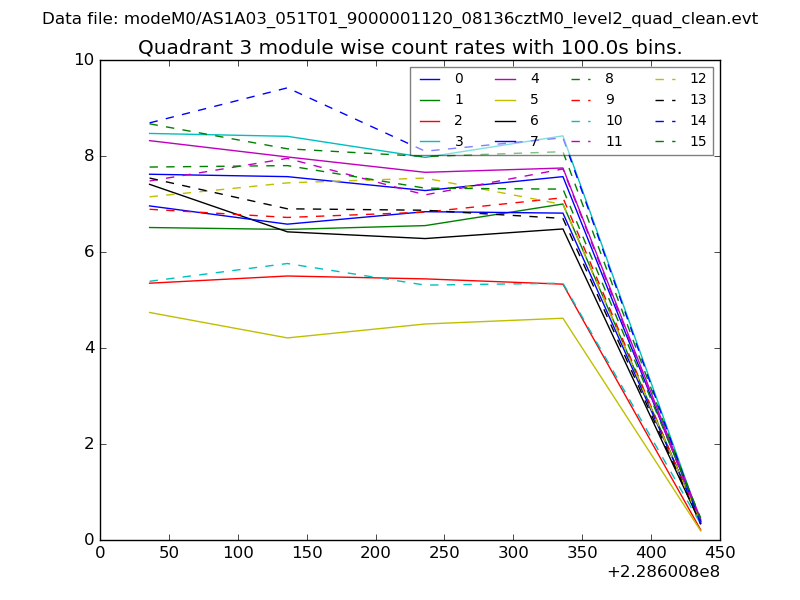
| Module-wise count rates for Quadrant A Data is divided into 100 sec bins |
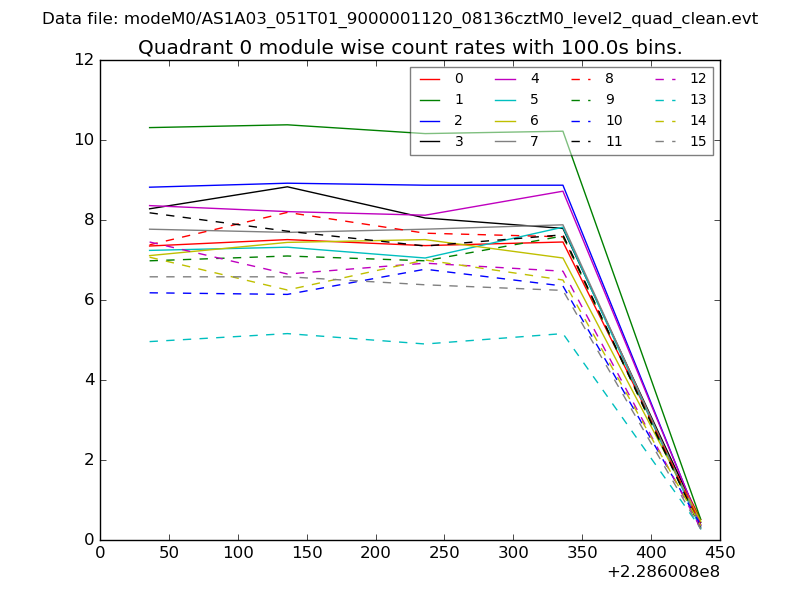 |
 |
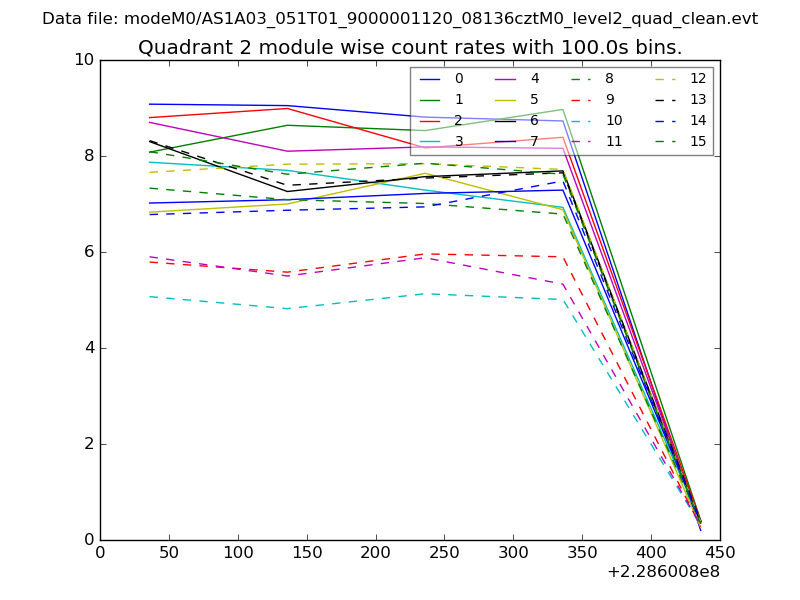
| Module-wise count rates for Quadrant B Data is divided into 100 sec bins |
 |
 |
| Module-wise count rates for Quadrant C Data is divided into 100 sec bins |
 |
 |
| Module-wise count rates for Quadrant D Data is divided into 100 sec bins |
 |
 |
| Parameter | Plot |
|---|---|
| CZT HV Monitor | 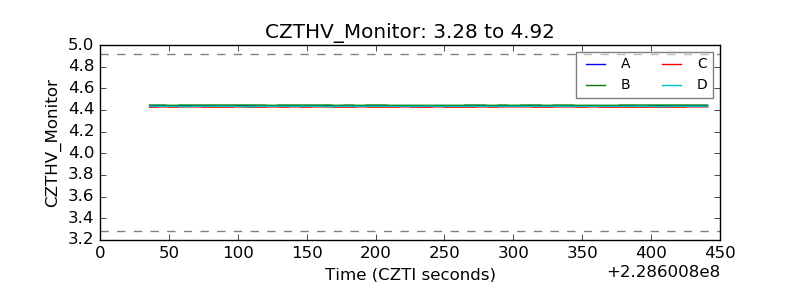 |
| D_VDD | 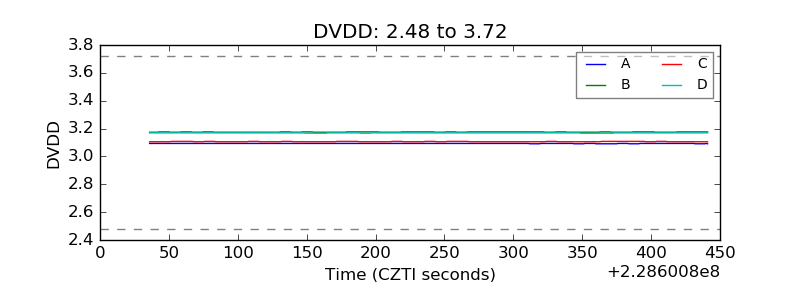 |
| Temperature 1 | 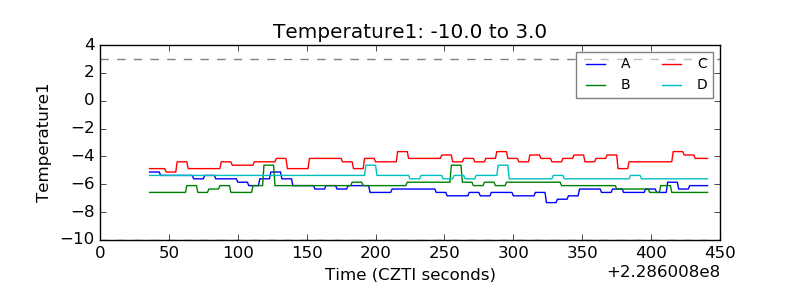 |
| Veto HV Monitor | 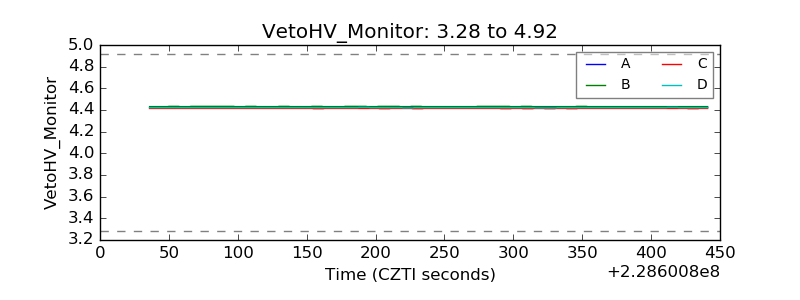 |
| Veto LLD | 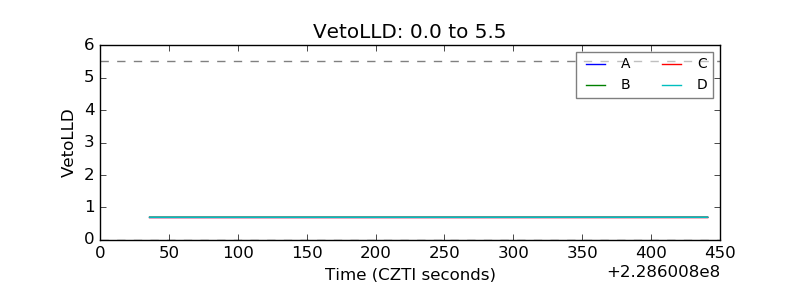 |
| Alpha Counter | 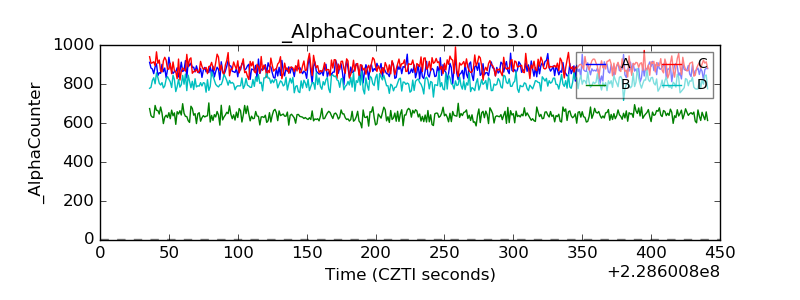 |
| _CPM_Rate | 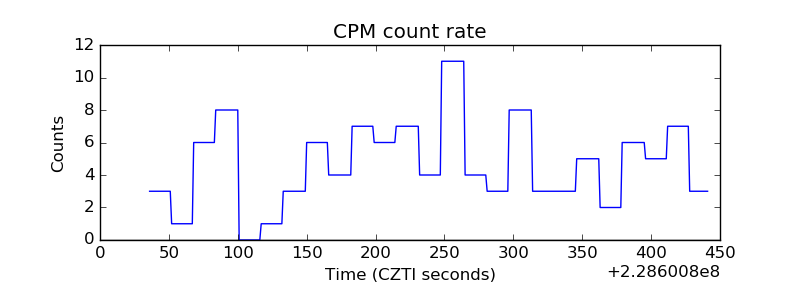 |
| CZT Counter | 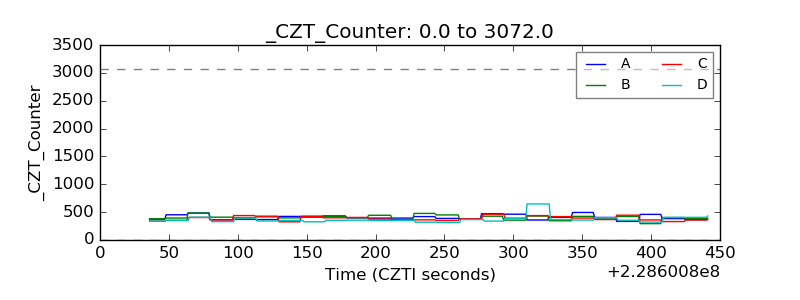 |
| +2.5 Volts monitor |  |
| +5 Volts monitor |  |
| _ROLL_ROT | 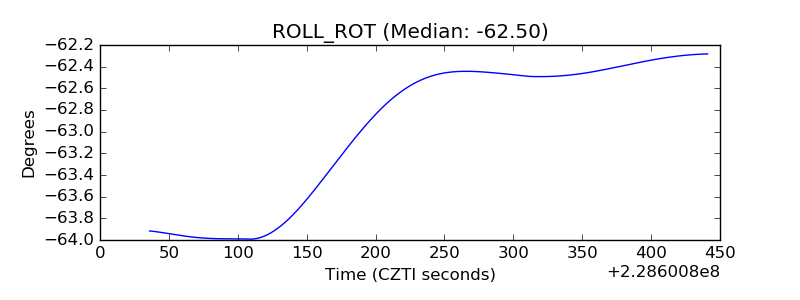 |
| _Roll_DEC | 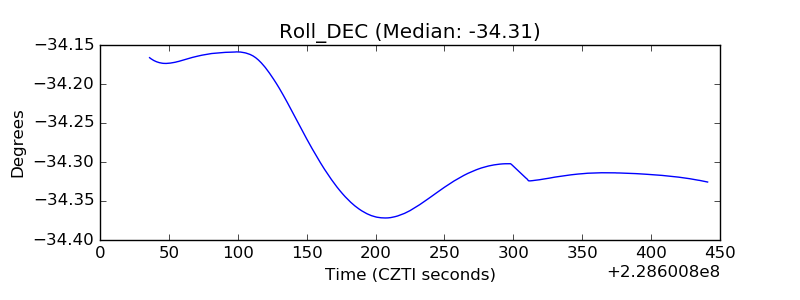 |
| _Roll_RA |  |
| Veto Counter | 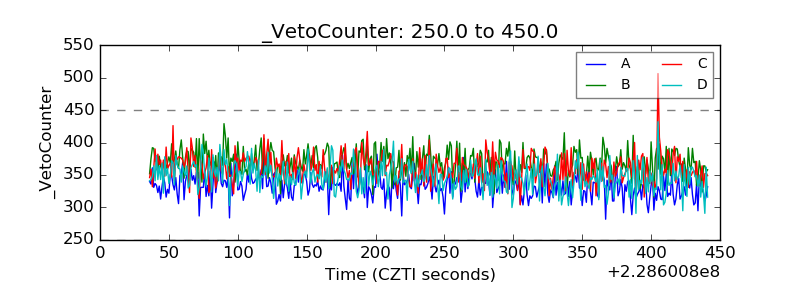 |