| Param | Original file | Final file |
|---|---|---|
| Filename | modeM0/AS1A03_051T01_9000001120_08137cztM0_level2.evt | modeM0/AS1A03_051T01_9000001120_08137cztM0_level2_quad_clean.evt |
| Size (bytes) | 372,792,960 | 72,552,960 |
| Size | 355.5 MB | 69.2 MB |
| Events in quadrant A | 2,898,482 | 451,309 |
| Events in quadrant B | 2,767,164 | 464,880 |
| Events in quadrant C | 2,575,308 | 451,177 |
| Events in quadrant D | 2,657,219 | 427,347 |
| Mode M9 | |||
|---|---|---|---|
| Quadrant | BADHDUFLAG | Total packets | Discarded packets |
| A | 0 | 8 | 0 |
| B | 0 | 8 | 0 |
| C | 0 | 8 | 0 |
| D | 0 | 8 | 0 |
| Mode SS | |||
|---|---|---|---|
| Quadrant | BADHDUFLAG | Total packets | Discarded packets |
| A | 0 | 116 | 0 |
| B | 0 | 116 | 0 |
| C | 0 | 116 | 0 |
| D | 0 | 116 | 0 |
| Mode M0 | |||
|---|---|---|---|
| Quadrant | BADHDUFLAG | Total packets | Discarded packets |
| A | 0 | 12681 | 2 |
| B | 0 | 12323 | 1 |
| C | 0 | 11773 | 1 |
| D | 0 | 12286 | 1 |
| Quadrant | Total seconds | Saturated seconds | Saturation percentage |
|---|---|---|---|
| A | 5757 | 84 | 1.459093% |
| B | 5757 | 55 | 0.955359% |
| C | 5757 | 14 | 0.243182% |
| D | 5757 | 30 | 0.521105% |
Noise dominated data is calculated using 1-second bins in cleaned event files. If a bin has >2000 counts, and if more than 50% of those come from <1% of pixels, then it is considered to be noise-dominated and hence unusable.
| Quadrant | # 1 sec bins | Bins with >0 counts | Bins with >2000 counts | High rate bins dominated by noise | Noise dominated (total time) | Noise dominated (detector-on time) | Marked lightcurve |
|---|---|---|---|---|---|---|---|
| A | 6537 | 5759 | 65 | 65 | 0.99% | 1.13% | 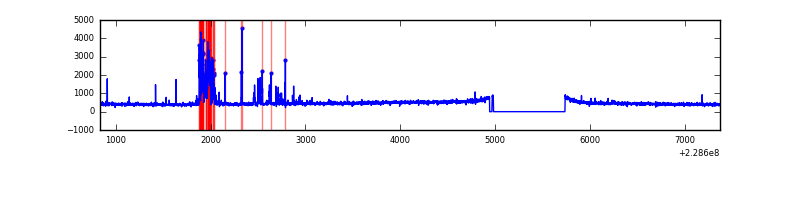 |
| B | 6537 | 5759 | 16 | 16 | 0.24% | 0.28% | 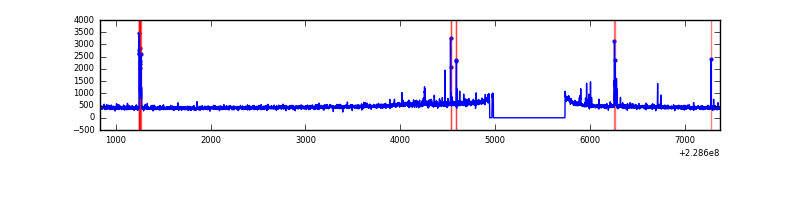 |
| C | 6537 | 5759 | 0 | 0 | 0.00% | 0.00% | 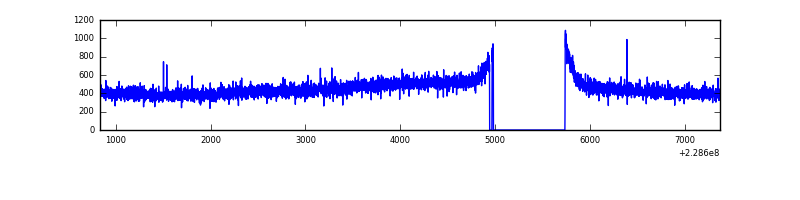 |
| D | 6537 | 5759 | 20 | 20 | 0.31% | 0.35% | 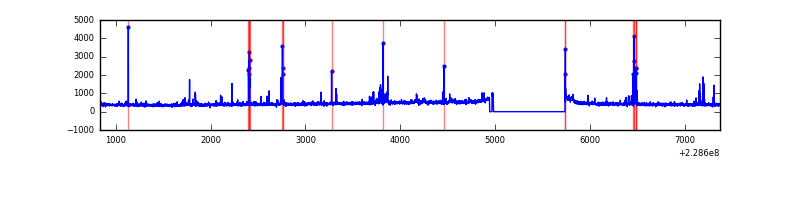 |
Top three noisy pixels from each quadrant. If the there are fewer than three noisy pixels in the level2.evt file, extra rows are filled as -1
| Pixel properties | Quadrant properties | ||||||
|---|---|---|---|---|---|---|---|
| Quadrant | DetID | PixID | Counts | Sigma | Mean | Median | Sigma |
| A | 13 | 170 | 325013 | 2380.93 | 663 | 649 | 136.2 |
| A | 8 | 15 | 13282 | 92.73 | 663 | 649 | 136.2 |
| A | 13 | 248 | 10470 | 72.09 | 663 | 649 | 136.2 |
| B | 10 | 16 | 62273 | 482.48 | 672 | 656 | 127.7 |
| B | 0 | 214 | 51816 | 400.6 | 672 | 656 | 127.7 |
| B | 10 | 252 | 19804 | 149.94 | 672 | 656 | 127.7 |
| C | 1 | 16 | 30178 | 194.54 | 651 | 658 | 151.7 |
| C | 13 | 61 | 5048 | 28.93 | 651 | 658 | 151.7 |
| C | 8 | 222 | 4745 | 26.93 | 651 | 658 | 151.7 |
| D | 1 | 52 | 82183 | 470.97 | 636 | 624 | 173.2 |
| D | 12 | 233 | 56286 | 321.43 | 636 | 624 | 173.2 |
| D | 7 | 71 | 46948 | 267.5 | 636 | 624 | 173.2 |
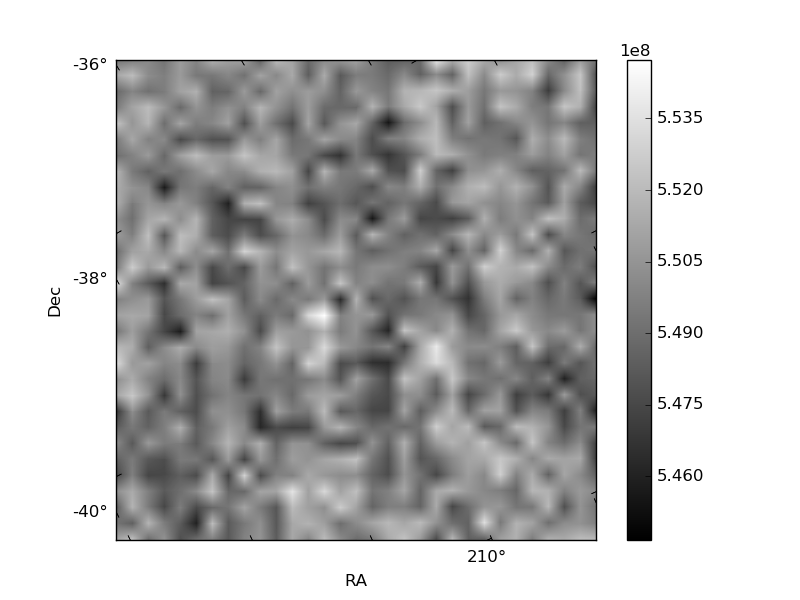
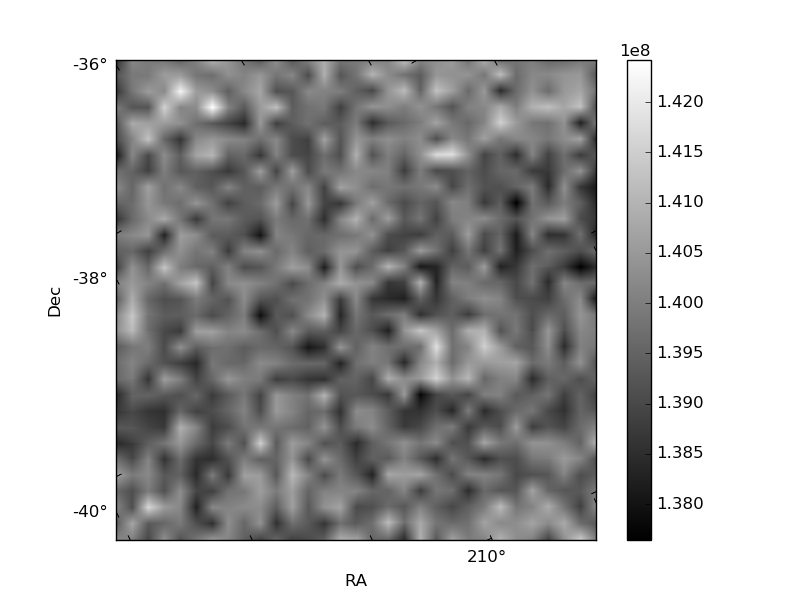
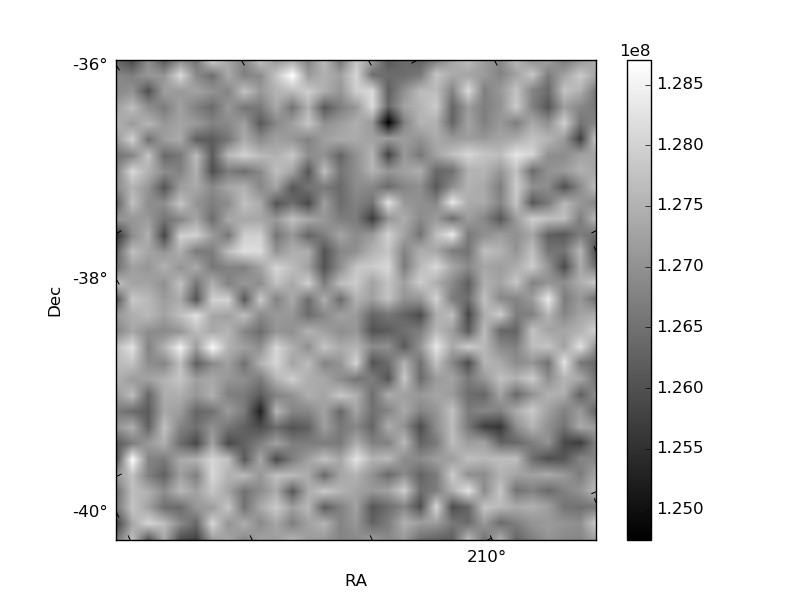
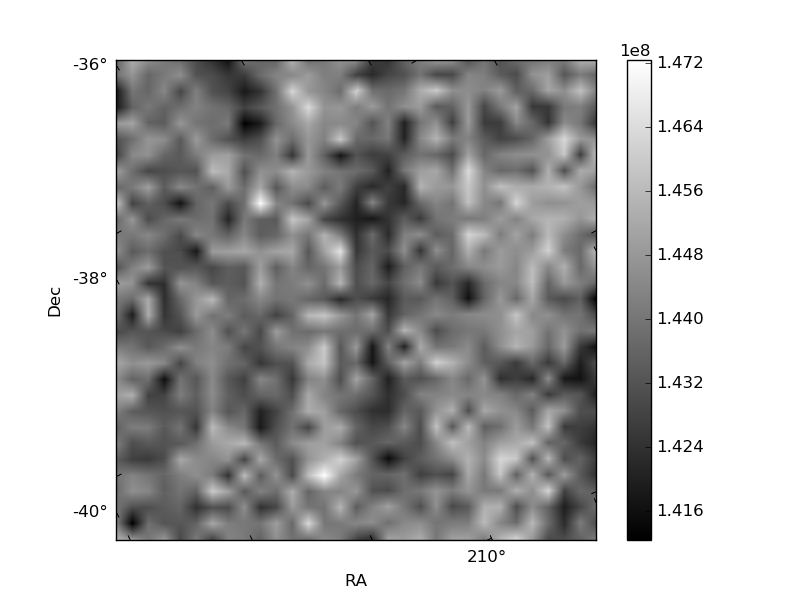
Histogram calculated using DETX and DETY for each event in the final _common_clean file
| Quadrant A | 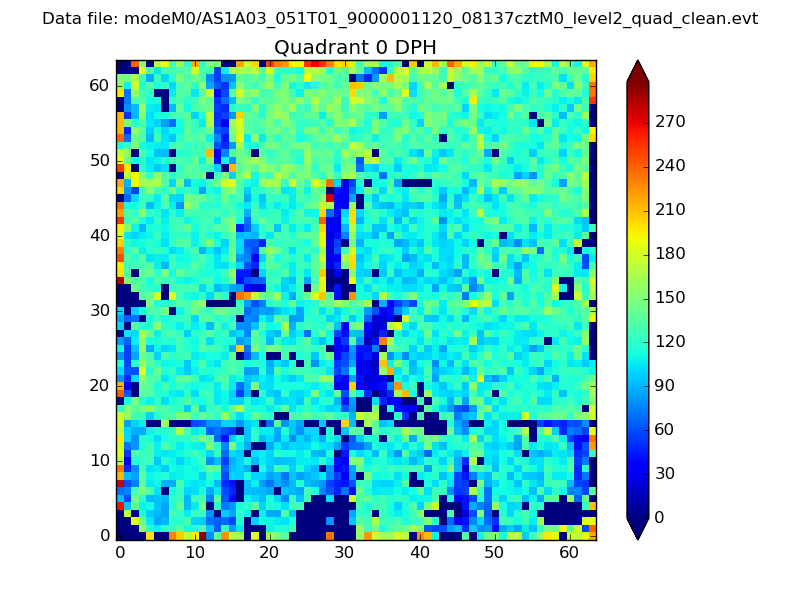 |
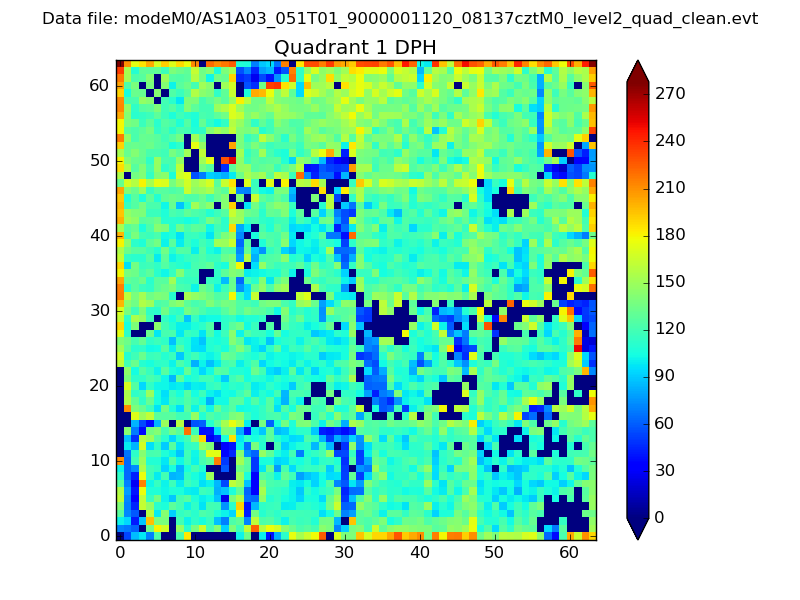 |
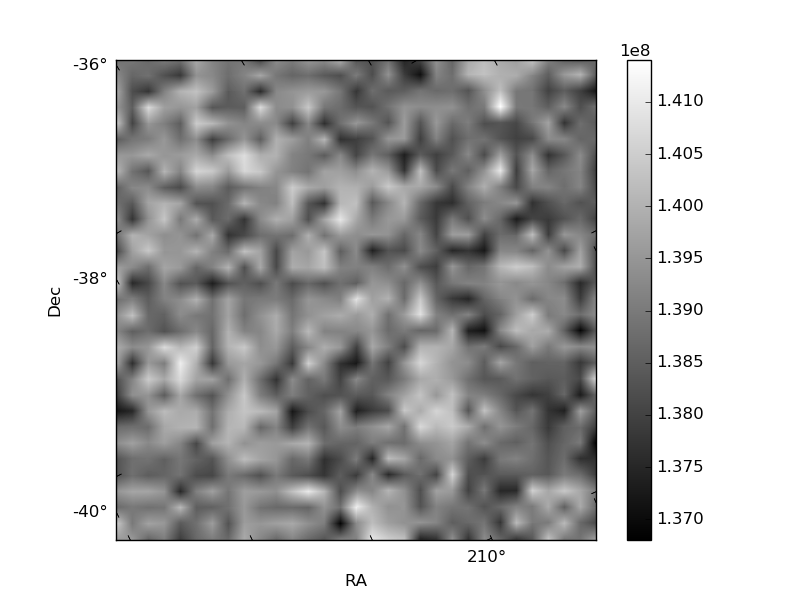
Quadrant B |
|---|---|---|---|
| Quadrant D | 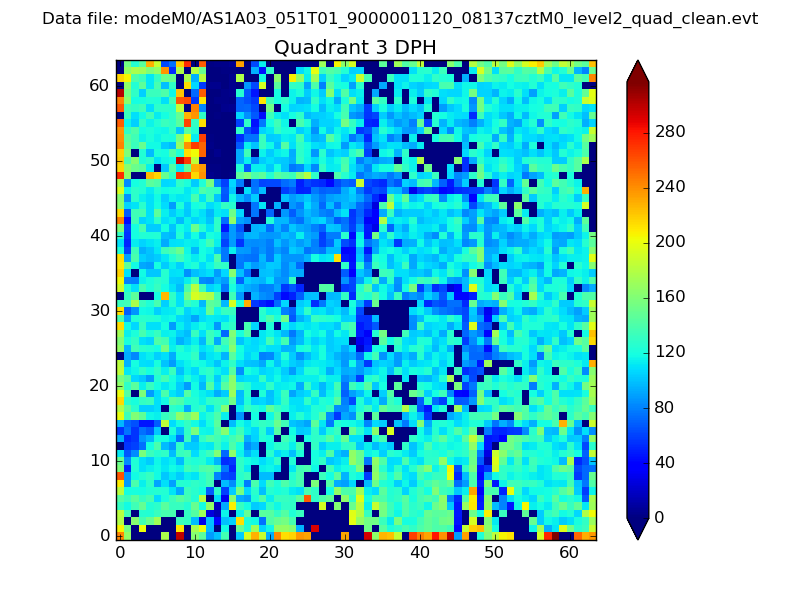 |
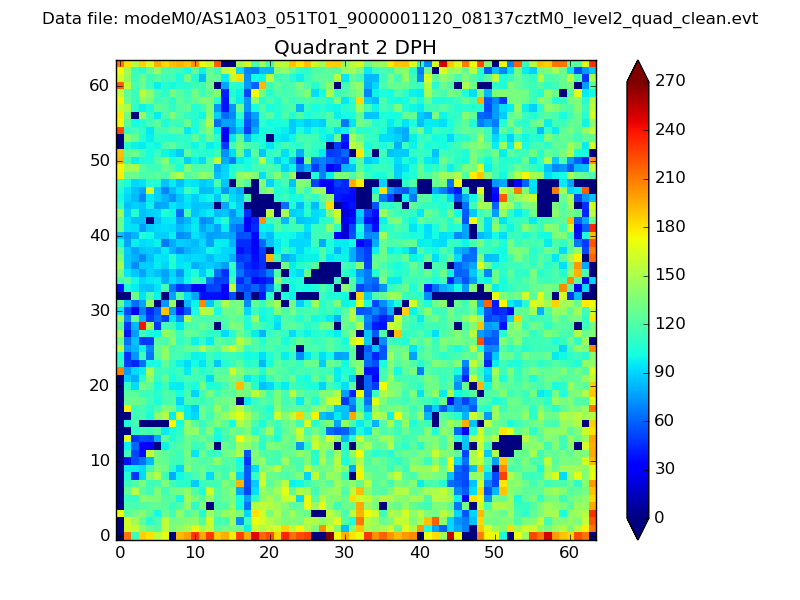 |
Quadrant C |
| Plot type | Count rate plots | Images |
|---|---|---|
| Comparison with Poisson distribution Blue bars denote a histogram of data divided into 1 sec bins. Red curve is a Poisson curve with rate = median count rate of data. |
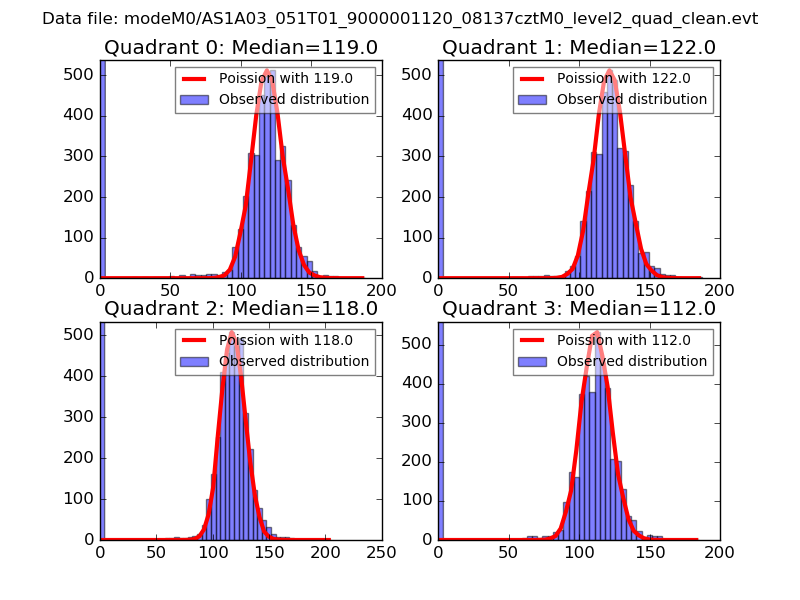 |
 |
| Quadrant-wise count rates Data is divided into 100 sec bins |
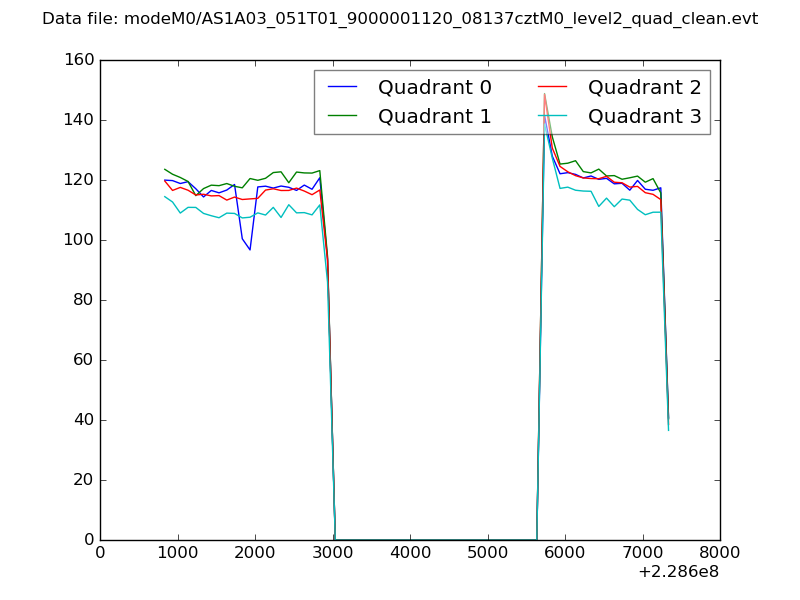 |
|
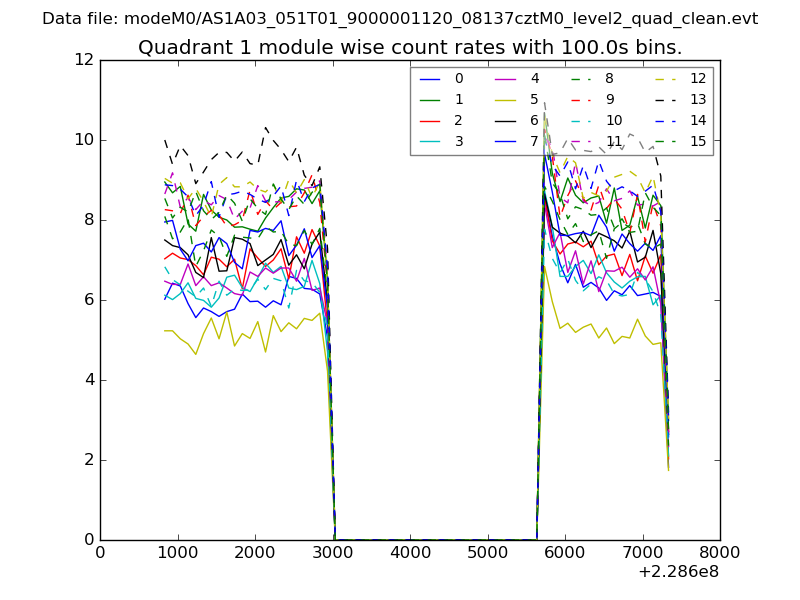
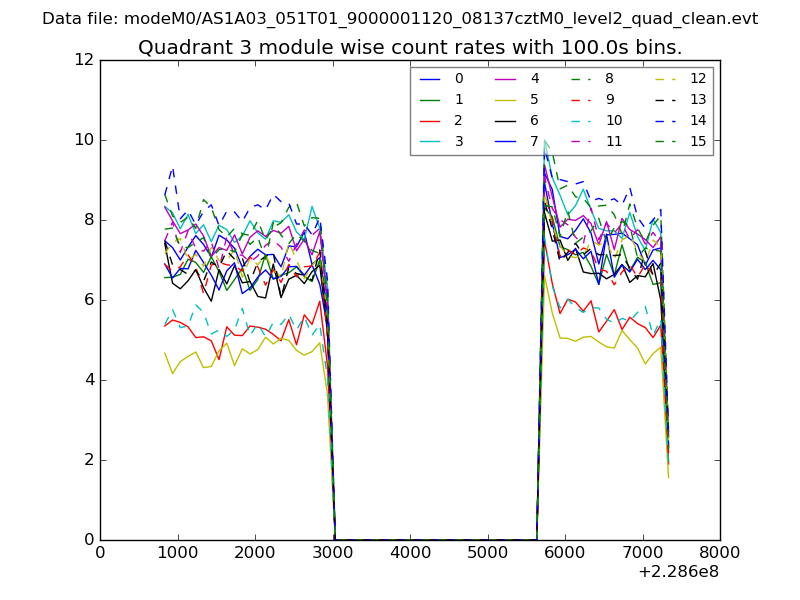
| Module-wise count rates for Quadrant A Data is divided into 100 sec bins |
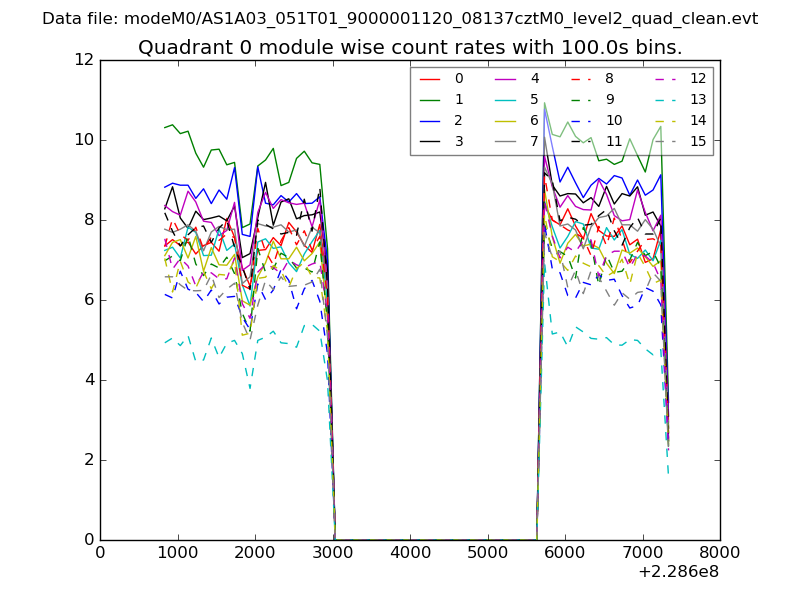 |
 |
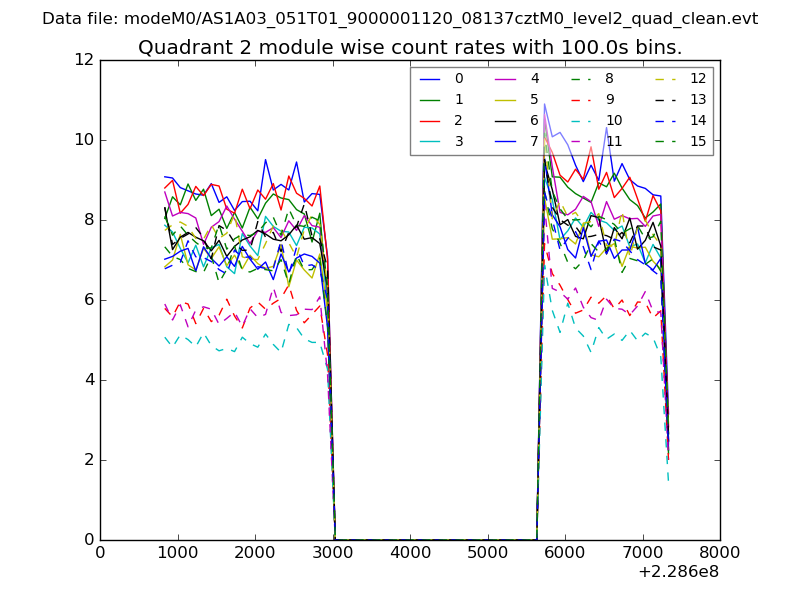
| Module-wise count rates for Quadrant B Data is divided into 100 sec bins |
 |
 |
| Module-wise count rates for Quadrant C Data is divided into 100 sec bins |
 |
 |
| Module-wise count rates for Quadrant D Data is divided into 100 sec bins |
 |
 |
| Parameter | Plot |
|---|---|
| CZT HV Monitor | 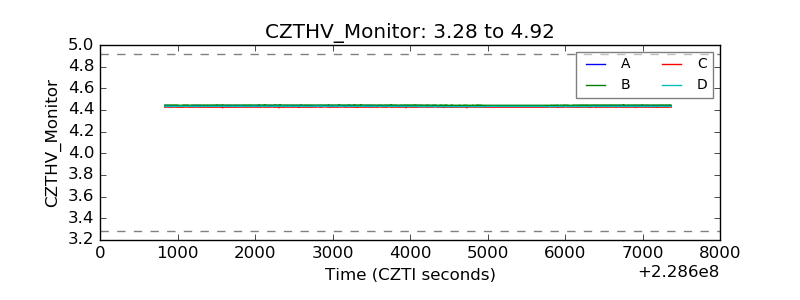 |
| D_VDD | 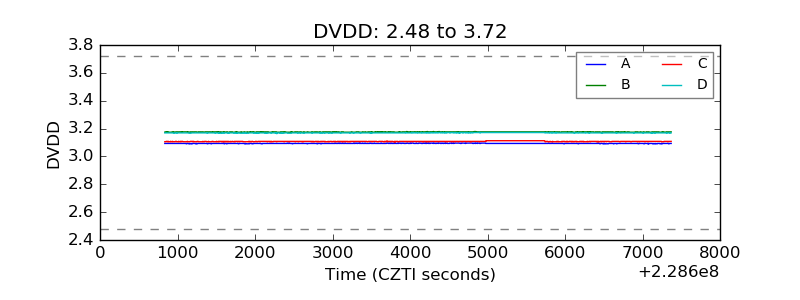 |
| Temperature 1 | 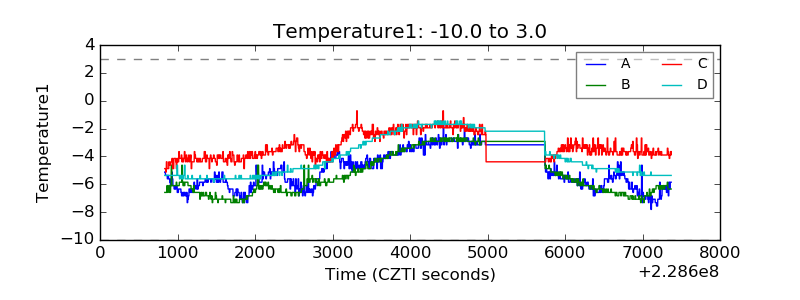 |
| Veto HV Monitor | 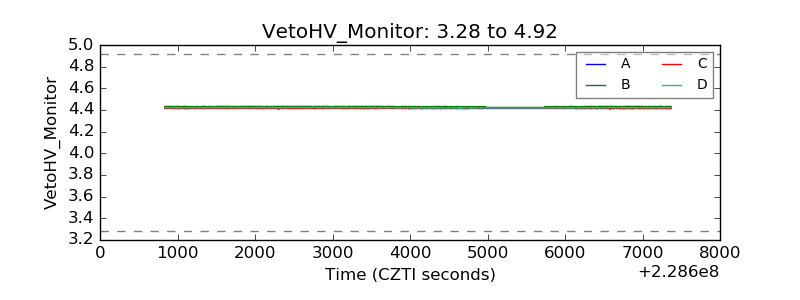 |
| Veto LLD |  |
| Alpha Counter | 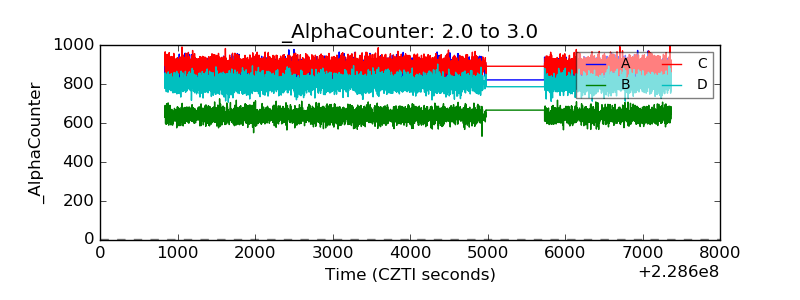 |
| _CPM_Rate |  |
| CZT Counter | 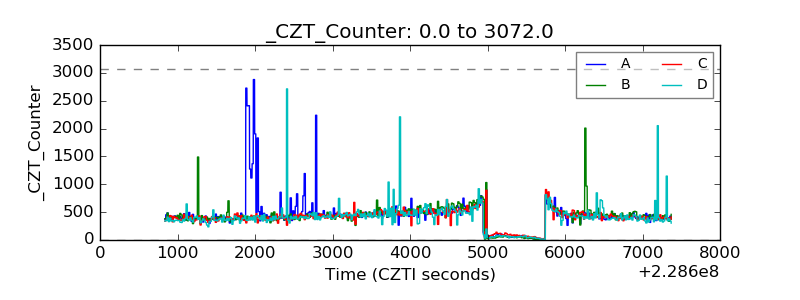 |
| +2.5 Volts monitor |  |
| +5 Volts monitor |  |
| _ROLL_ROT | 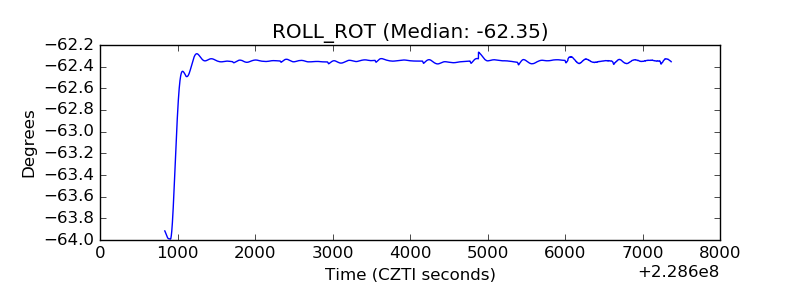 |
| _Roll_DEC | 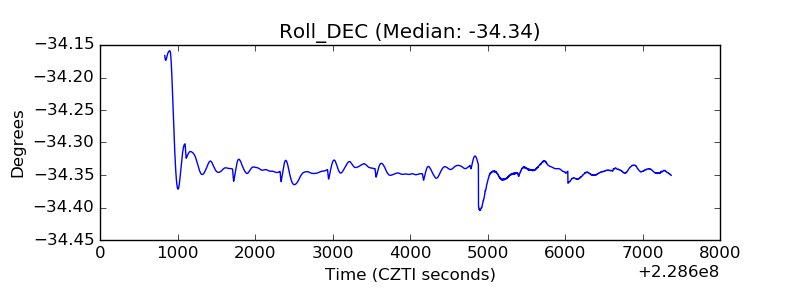 |
| _Roll_RA | 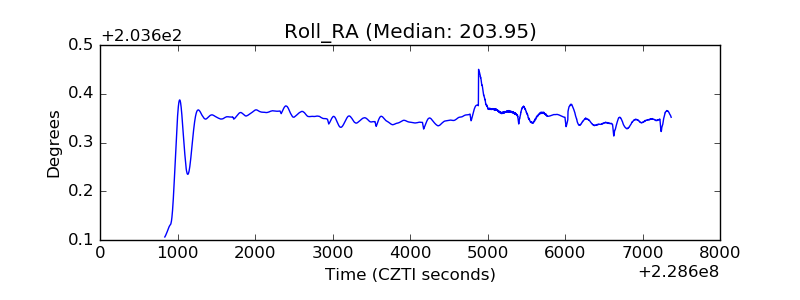 |
| Veto Counter | 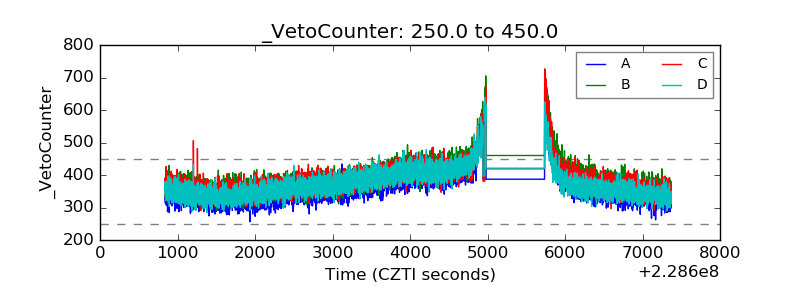 |