| Param | Original file | Final file |
|---|---|---|
| Filename | modeM0/AS1A03_051T01_9000001120_08139cztM0_level2.evt | modeM0/AS1A03_051T01_9000001120_08139cztM0_level2_quad_clean.evt |
| Size (bytes) | 506,174,400 | 111,303,360 |
| Size | 482.7 MB | 106.1 MB |
| Events in quadrant A | 3,637,005 | 711,651 |
| Events in quadrant B | 3,815,623 | 724,078 |
| Events in quadrant C | 3,634,319 | 706,450 |
| Events in quadrant D | 3,701,350 | 675,127 |
| Mode M9 | |||
|---|---|---|---|
| Quadrant | BADHDUFLAG | Total packets | Discarded packets |
| A | 0 | 3 | 0 |
| B | 0 | 3 | 0 |
| C | 0 | 3 | 0 |
| D | 0 | 3 | 0 |
| Mode SS | |||
|---|---|---|---|
| Quadrant | BADHDUFLAG | Total packets | Discarded packets |
| A | 0 | 164 | 0 |
| B | 0 | 164 | 0 |
| C | 0 | 164 | 0 |
| D | 0 | 164 | 0 |
| Mode M0 | |||
|---|---|---|---|
| Quadrant | BADHDUFLAG | Total packets | Discarded packets |
| A | 0 | 16460 | 4 |
| B | 0 | 16759 | 3 |
| C | 0 | 16482 | 3 |
| D | 0 | 16811 | 3 |
| Quadrant | Total seconds | Saturated seconds | Saturation percentage |
|---|---|---|---|
| A | 7954 | 69 | 0.867488% |
| B | 7954 | 160 | 2.011567% |
| C | 7954 | 95 | 1.194368% |
| D | 7954 | 62 | 0.779482% |
Noise dominated data is calculated using 1-second bins in cleaned event files. If a bin has >2000 counts, and if more than 50% of those come from <1% of pixels, then it is considered to be noise-dominated and hence unusable.
| Quadrant | # 1 sec bins | Bins with >0 counts | Bins with >2000 counts | High rate bins dominated by noise | Noise dominated (total time) | Noise dominated (detector-on time) | Marked lightcurve |
|---|---|---|---|---|---|---|---|
| A | 8394 | 7957 | 0 | 0 | 0.00% | 0.00% | 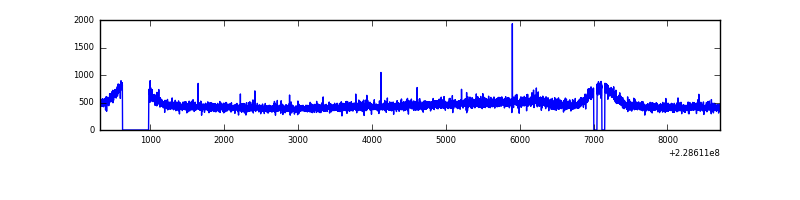 |
| B | 8394 | 7957 | 2 | 2 | 0.02% | 0.03% | 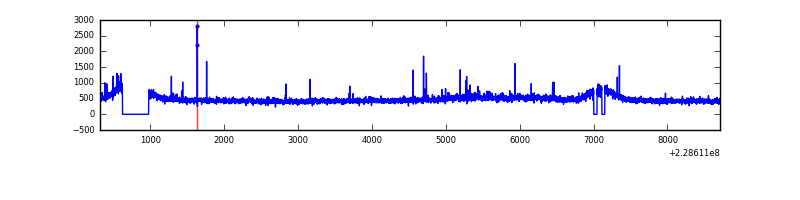 |
| C | 8394 | 7957 | 0 | 0 | 0.00% | 0.00% | 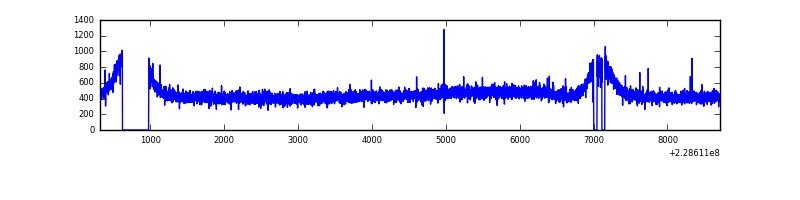 |
| D | 8394 | 7957 | 2 | 2 | 0.02% | 0.03% | 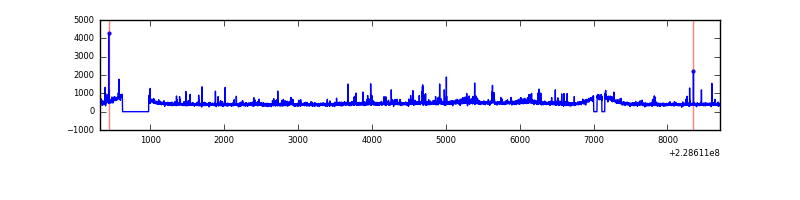 |
Top three noisy pixels from each quadrant. If the there are fewer than three noisy pixels in the level2.evt file, extra rows are filled as -1
| Pixel properties | Quadrant properties | ||||||
|---|---|---|---|---|---|---|---|
| Quadrant | DetID | PixID | Counts | Sigma | Mean | Median | Sigma |
| A | 0 | 226 | 8762 | 40.6 | 941 | 920 | 193.1 |
| A | 12 | 194 | 8500 | 39.25 | 941 | 920 | 193.1 |
| A | 8 | 15 | 8253 | 37.97 | 941 | 920 | 193.1 |
| B | 0 | 219 | 47618 | 252.35 | 953 | 927 | 185.0 |
| B | 0 | 214 | 38993 | 205.73 | 953 | 927 | 185.0 |
| B | 12 | 111 | 20590 | 106.27 | 953 | 927 | 185.0 |
| C | 1 | 16 | 13839 | 59.98 | 926 | 932 | 215.2 |
| C | 13 | 61 | 6945 | 27.94 | 926 | 932 | 215.2 |
| C | 14 | 67 | 4388 | 16.06 | 926 | 932 | 215.2 |
| D | 1 | 52 | 178506 | 731.02 | 909 | 888 | 243.0 |
| D | 2 | 234 | 25518 | 101.37 | 909 | 888 | 243.0 |
| D | 12 | 233 | 18154 | 71.06 | 909 | 888 | 243.0 |
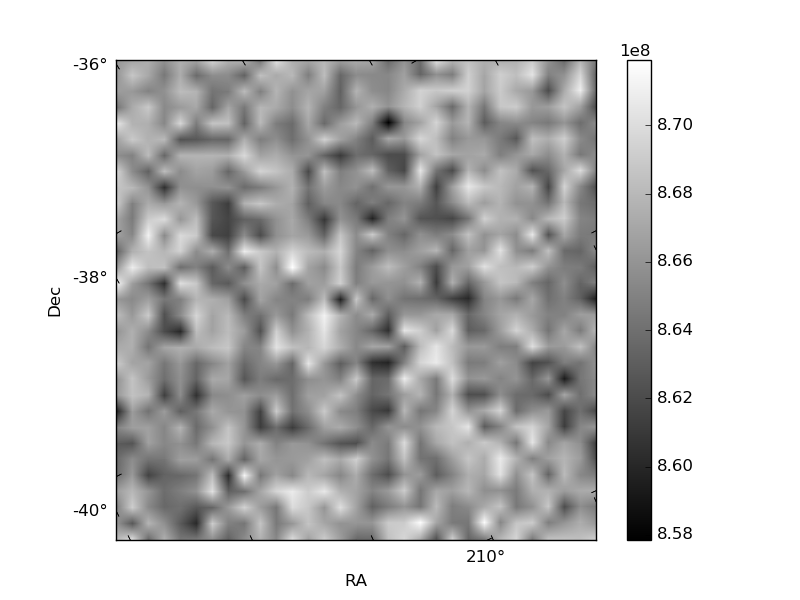
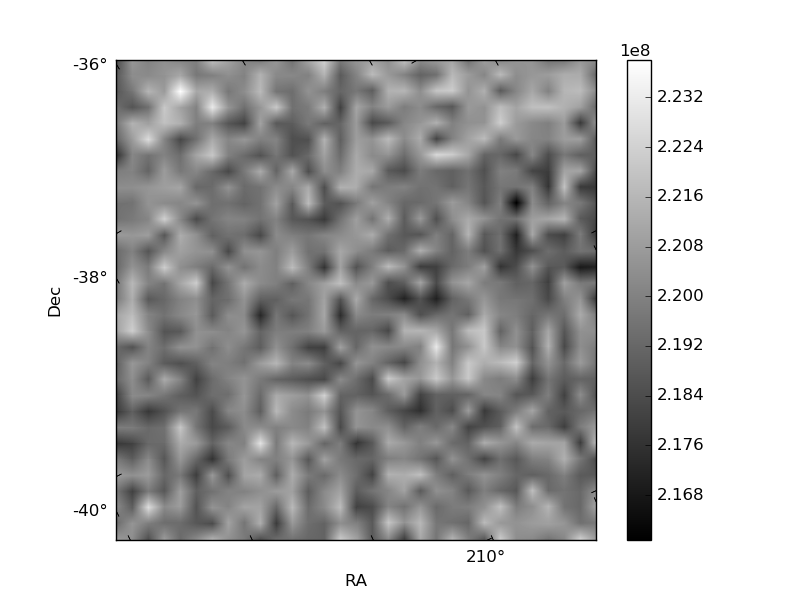
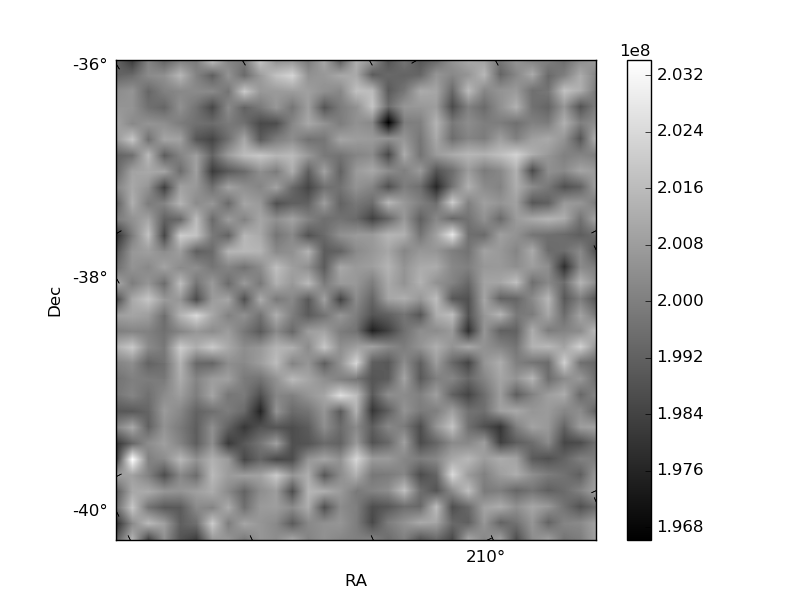
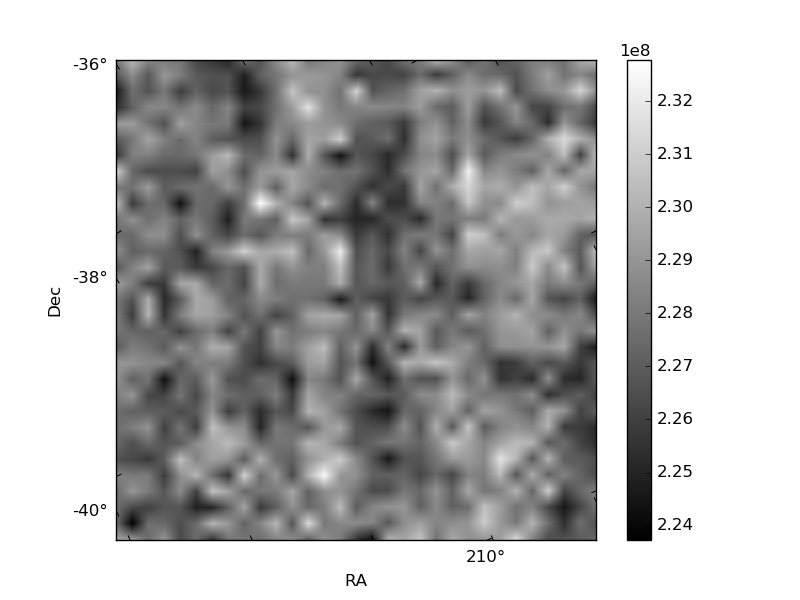
Histogram calculated using DETX and DETY for each event in the final _common_clean file
| Quadrant A | 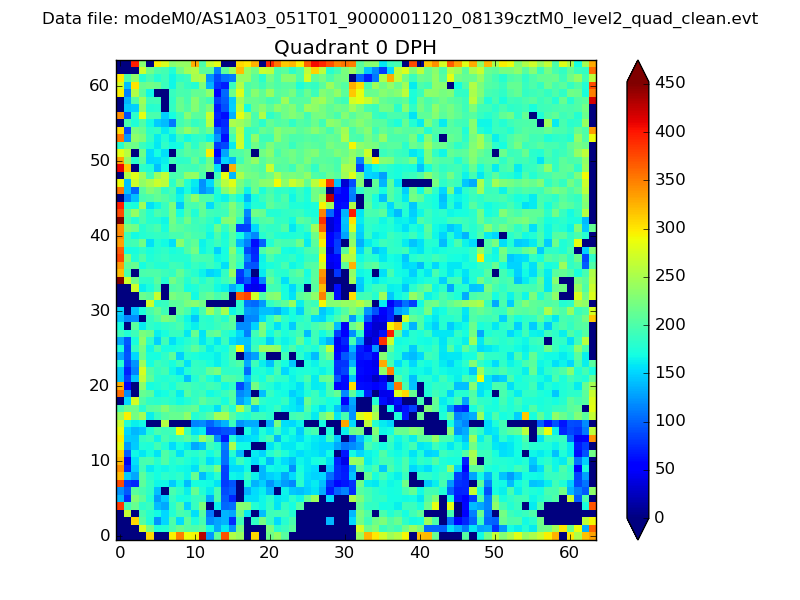 |
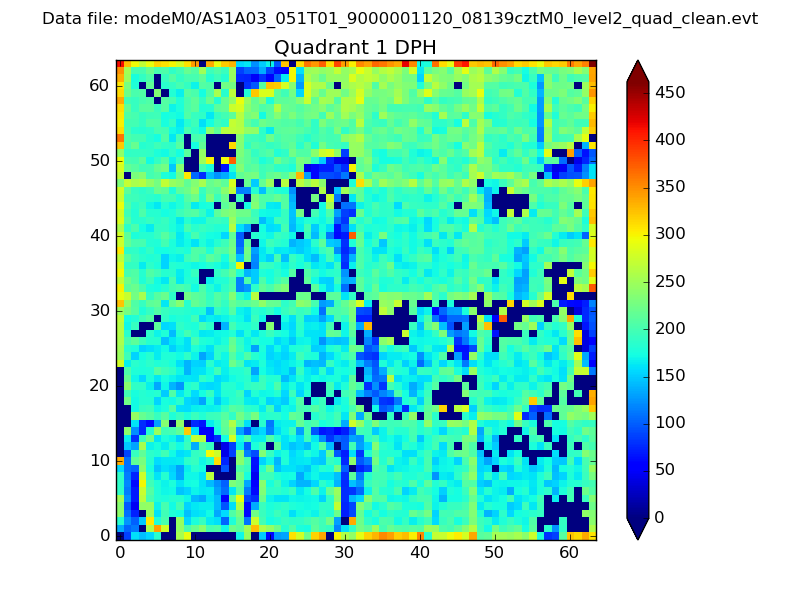 |
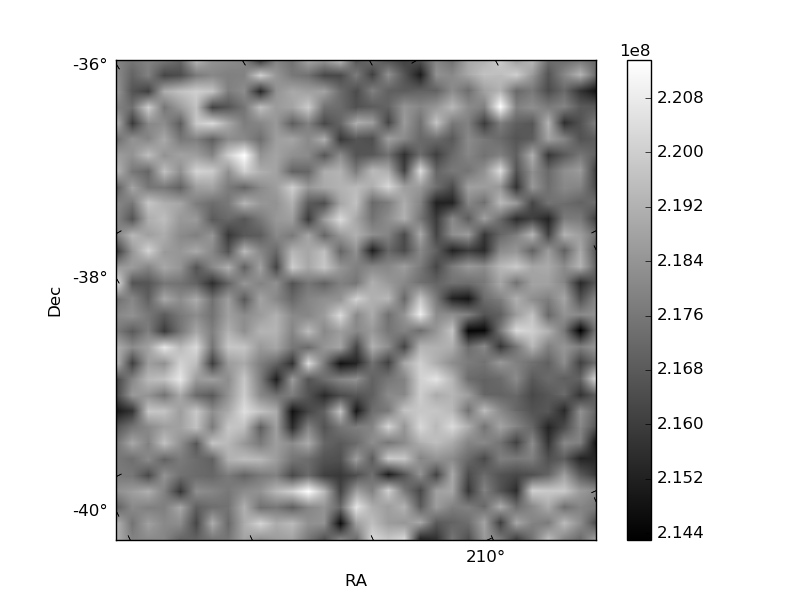
Quadrant B |
|---|---|---|---|
| Quadrant D | 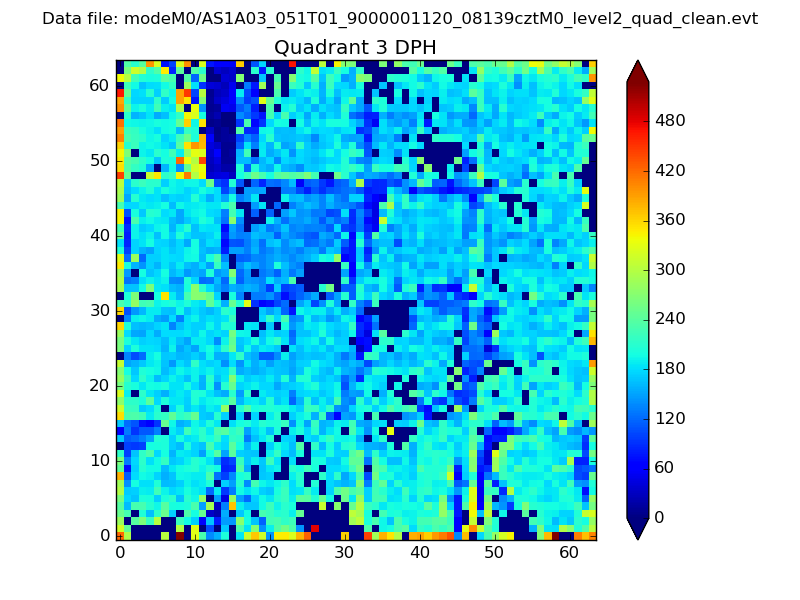 |
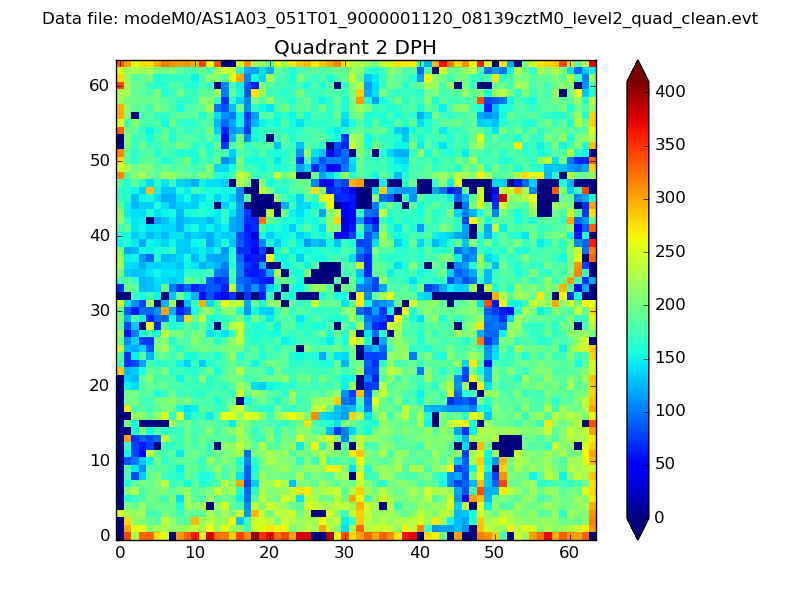 |
Quadrant C |
| Plot type | Count rate plots | Images |
|---|---|---|
| Comparison with Poisson distribution Blue bars denote a histogram of data divided into 1 sec bins. Red curve is a Poisson curve with rate = median count rate of data. |
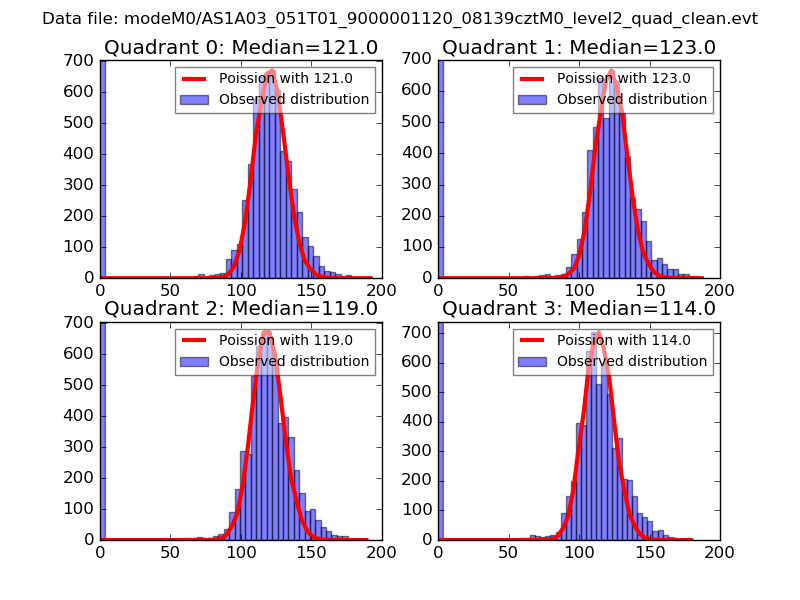 |
 |
| Quadrant-wise count rates Data is divided into 100 sec bins |
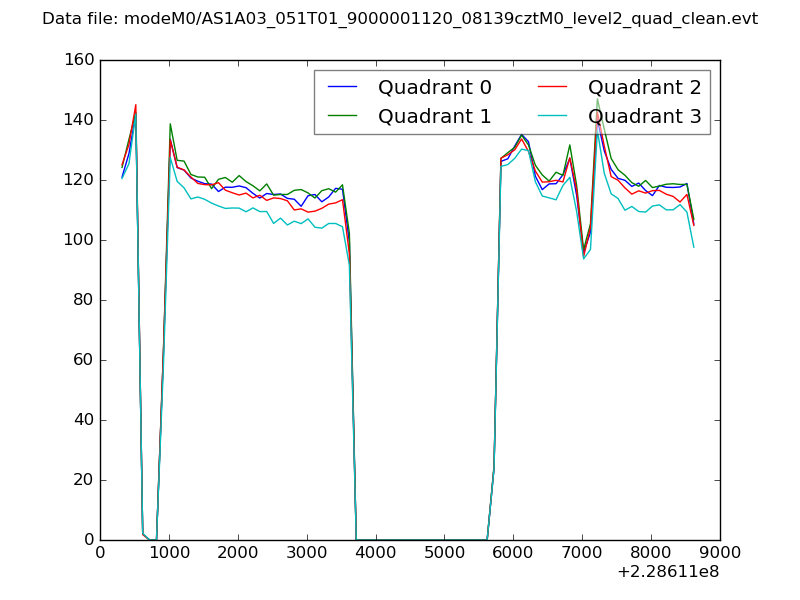 |
|
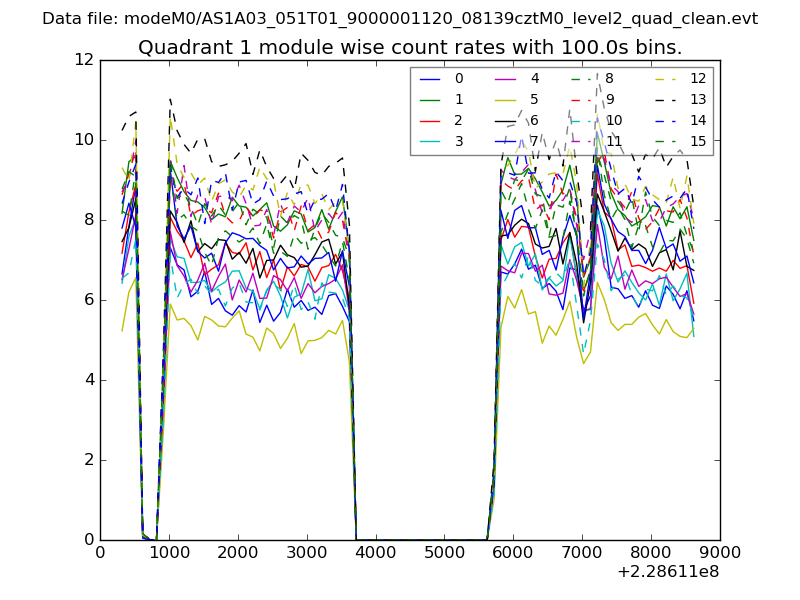
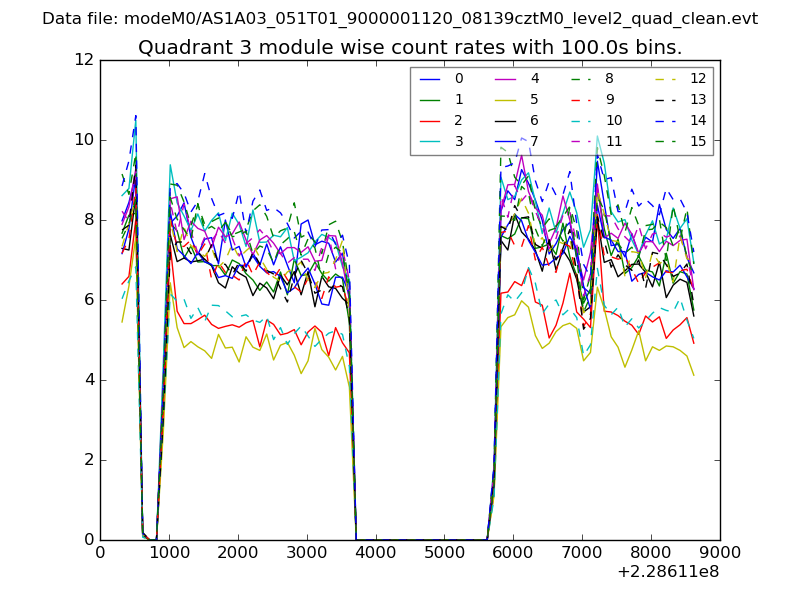
| Module-wise count rates for Quadrant A Data is divided into 100 sec bins |
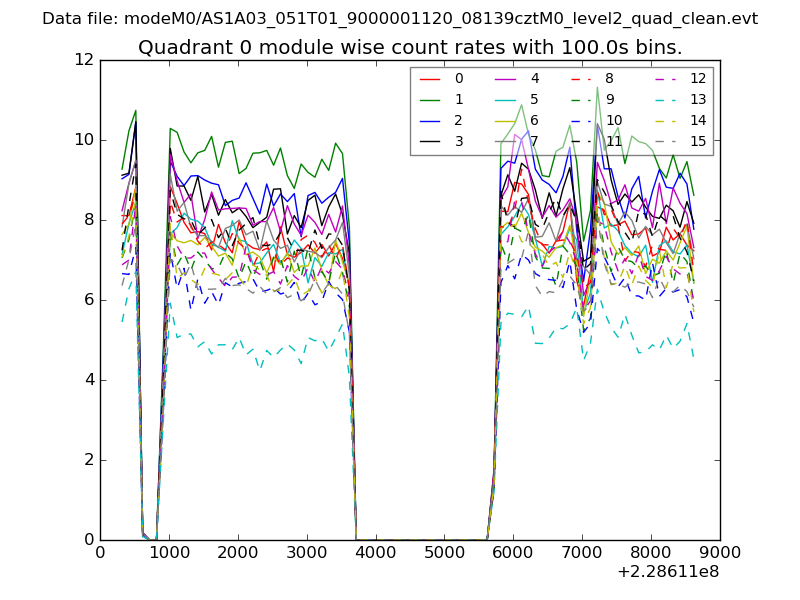 |
 |
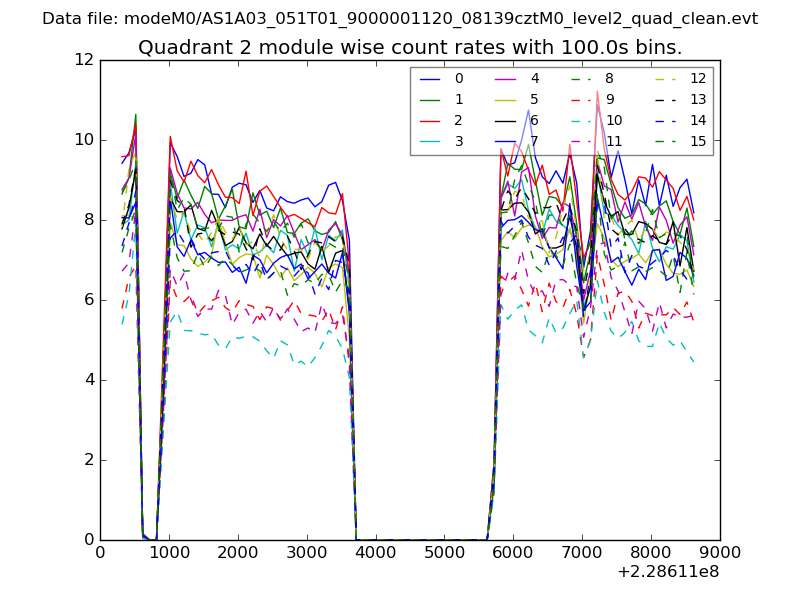
| Module-wise count rates for Quadrant B Data is divided into 100 sec bins |
 |
 |
| Module-wise count rates for Quadrant C Data is divided into 100 sec bins |
 |
 |
| Module-wise count rates for Quadrant D Data is divided into 100 sec bins |
 |
 |
| Parameter | Plot |
|---|---|
| CZT HV Monitor | 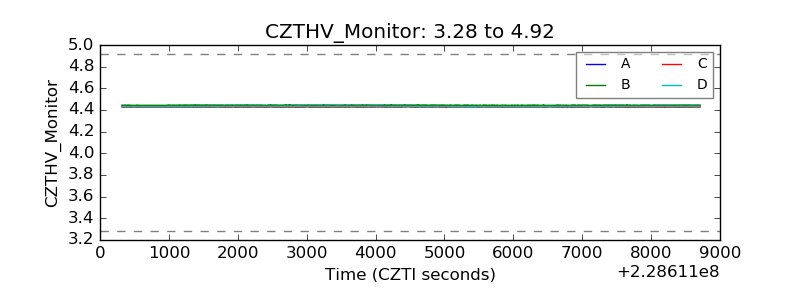 |
| D_VDD |  |
| Temperature 1 | 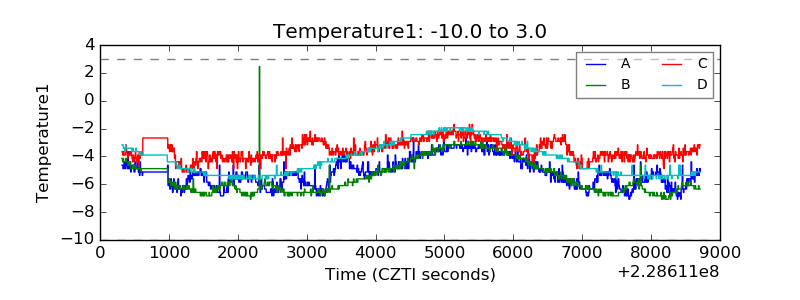 |
| Veto HV Monitor | 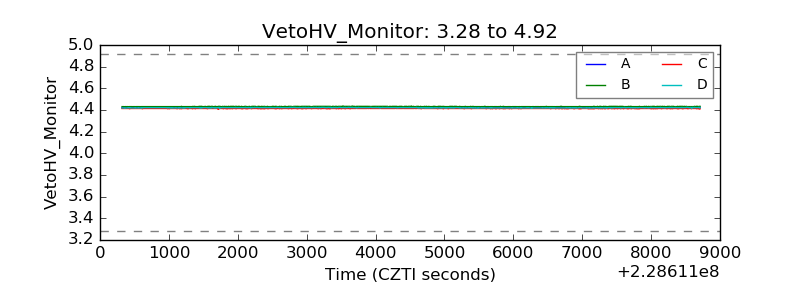 |
| Veto LLD | 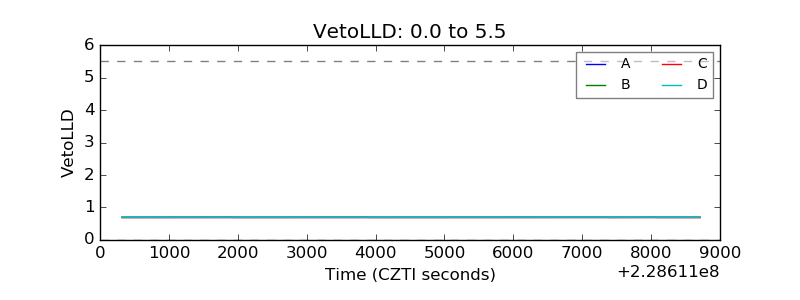 |
| Alpha Counter | 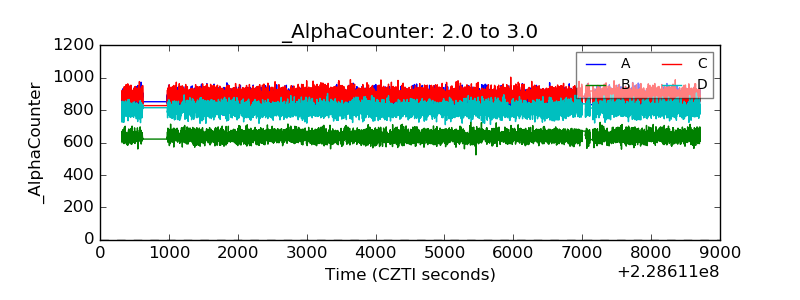 |
| _CPM_Rate | 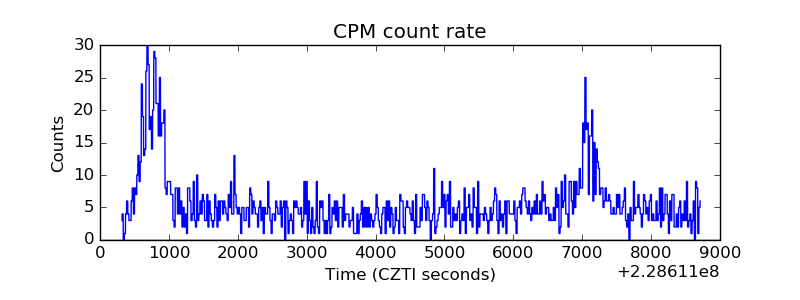 |
| CZT Counter | 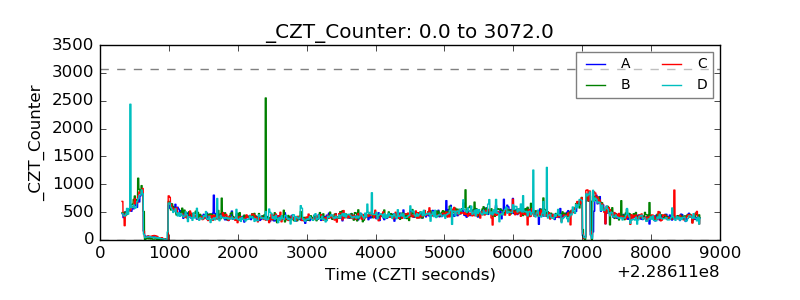 |
| +2.5 Volts monitor |  |
| +5 Volts monitor |  |
| _ROLL_ROT | 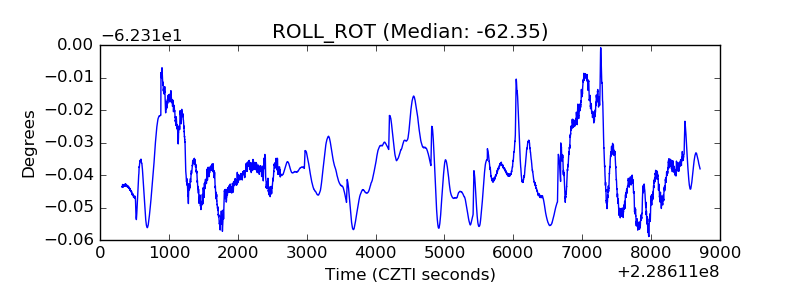 |
| _Roll_DEC | 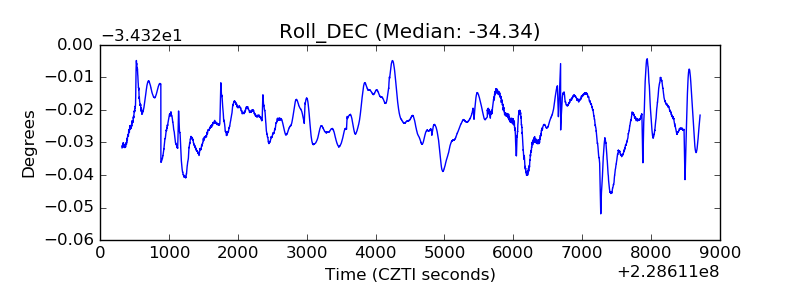 |
| _Roll_RA | 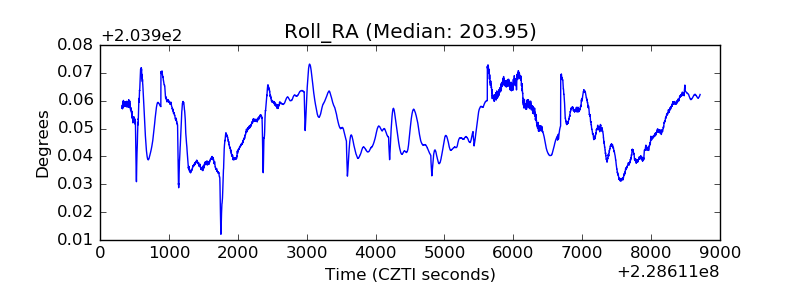 |
| Veto Counter | 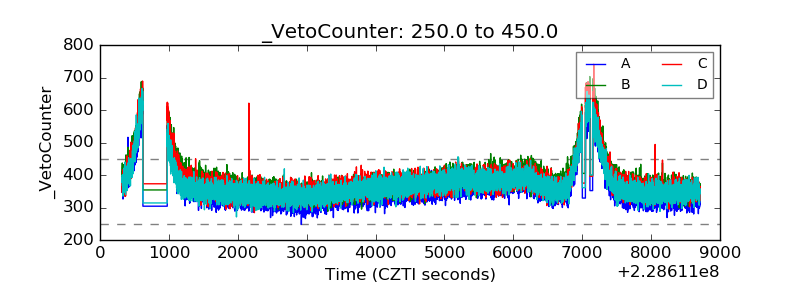 |