| Param | Original file | Final file |
|---|---|---|
| Filename | modeM0/AS1A03_051T01_9000001120_08140cztM0_level2.evt | modeM0/AS1A03_051T01_9000001120_08140cztM0_level2_quad_clean.evt |
| Size (bytes) | 551,992,320 | 124,704,000 |
| Size | 526.4 MB | 118.9 MB |
| Events in quadrant A | 3,961,723 | 801,535 |
| Events in quadrant B | 4,103,882 | 817,297 |
| Events in quadrant C | 3,953,568 | 793,670 |
| Events in quadrant D | 4,107,057 | 760,470 |
| Mode M9 | |||
|---|---|---|---|
| Quadrant | BADHDUFLAG | Total packets | Discarded packets |
| A | 0 | 3 | 0 |
| B | 0 | 3 | 0 |
| C | 0 | 3 | 0 |
| D | 0 | 3 | 0 |
| Mode SS | |||
|---|---|---|---|
| Quadrant | BADHDUFLAG | Total packets | Discarded packets |
| A | 0 | 178 | 0 |
| B | 0 | 178 | 0 |
| C | 0 | 178 | 0 |
| D | 0 | 178 | 0 |
| Mode M0 | |||
|---|---|---|---|
| Quadrant | BADHDUFLAG | Total packets | Discarded packets |
| A | 0 | 17900 | 21 |
| B | 0 | 18084 | 21 |
| C | 0 | 17938 | 9 |
| D | 0 | 18536 | 19 |
| Quadrant | Total seconds | Saturated seconds | Saturation percentage |
|---|---|---|---|
| A | 8687 | 88 | 1.013008% |
| B | 8687 | 174 | 2.002993% |
| C | 8692 | 129 | 1.484123% |
| D | 8688 | 113 | 1.300645% |
Noise dominated data is calculated using 1-second bins in cleaned event files. If a bin has >2000 counts, and if more than 50% of those come from <1% of pixels, then it is considered to be noise-dominated and hence unusable.
| Quadrant | # 1 sec bins | Bins with >0 counts | Bins with >2000 counts | High rate bins dominated by noise | Noise dominated (total time) | Noise dominated (detector-on time) | Marked lightcurve |
|---|---|---|---|---|---|---|---|
| A | 9065 | 8698 | 0 | 0 | 0.00% | 0.00% |  |
| B | 9065 | 8698 | 0 | 0 | 0.00% | 0.00% |  |
| C | 9065 | 8698 | 0 | 0 | 0.00% | 0.00% | 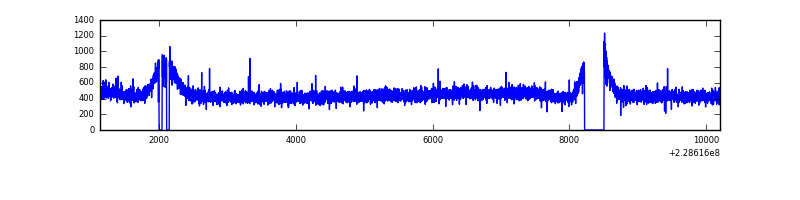 |
| D | 9065 | 8698 | 18 | 18 | 0.20% | 0.21% |  |
Top three noisy pixels from each quadrant. If the there are fewer than three noisy pixels in the level2.evt file, extra rows are filled as -1
| Pixel properties | Quadrant properties | ||||||
|---|---|---|---|---|---|---|---|
| Quadrant | DetID | PixID | Counts | Sigma | Mean | Median | Sigma |
| A | 0 | 226 | 9480 | 40.23 | 1028 | 1005 | 210.6 |
| A | 12 | 194 | 9199 | 38.9 | 1028 | 1005 | 210.6 |
| A | 13 | 254 | 4501 | 16.59 | 1028 | 1005 | 210.6 |
| B | 0 | 214 | 35024 | 171.04 | 1037 | 1010 | 198.9 |
| B | 12 | 111 | 22662 | 108.88 | 1037 | 1010 | 198.9 |
| B | 11 | 111 | 17961 | 85.24 | 1037 | 1010 | 198.9 |
| C | 1 | 16 | 15726 | 62.42 | 1008 | 1010 | 235.8 |
| C | 13 | 61 | 7535 | 27.67 | 1008 | 1010 | 235.8 |
| C | 12 | 4 | 3152 | 9.08 | 1008 | 1010 | 235.8 |
| D | 1 | 52 | 137397 | 548.26 | 991 | 964 | 248.8 |
| D | 12 | 233 | 107490 | 428.08 | 991 | 964 | 248.8 |
| D | 12 | 227 | 59322 | 234.51 | 991 | 964 | 248.8 |
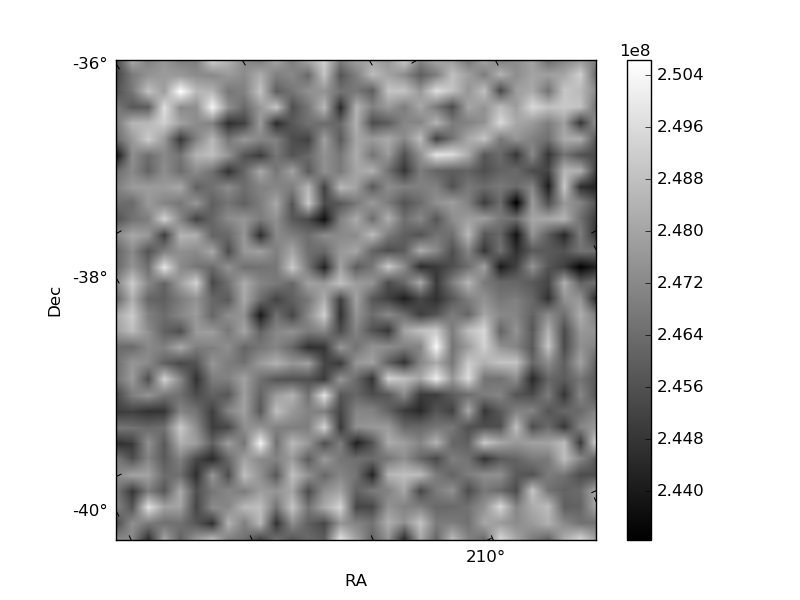
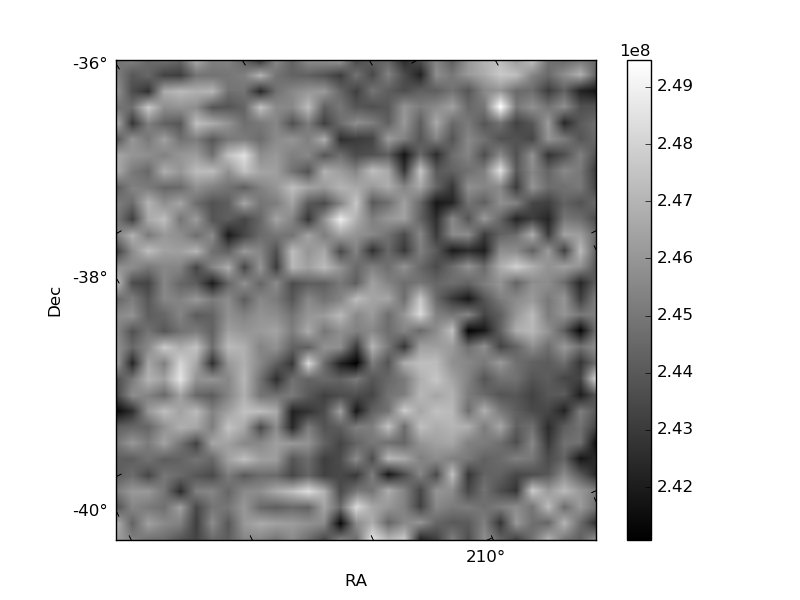
Histogram calculated using DETX and DETY for each event in the final _common_clean file
| Quadrant A | 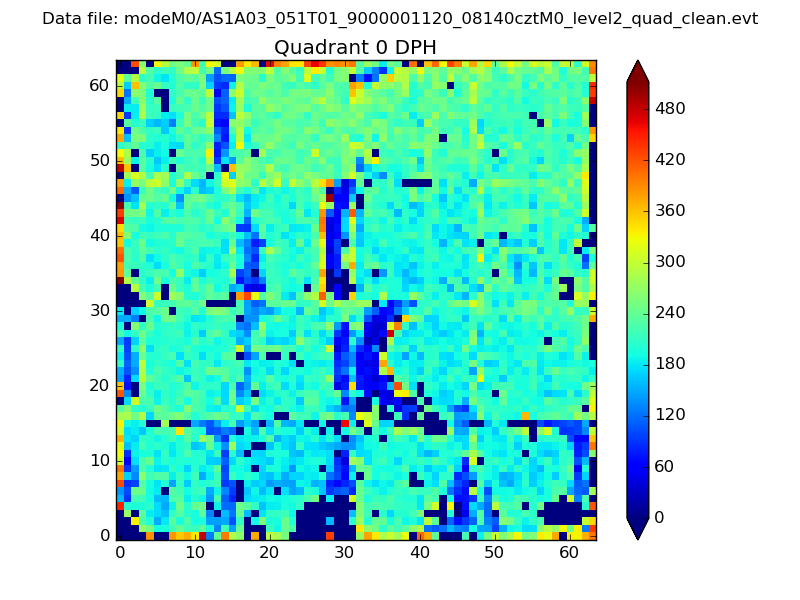 |
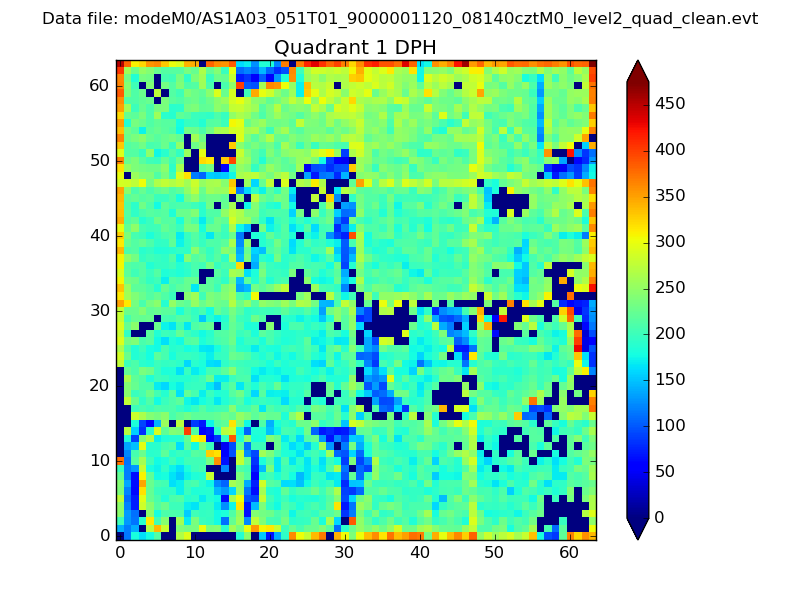 |
Quadrant B |
|---|---|---|---|
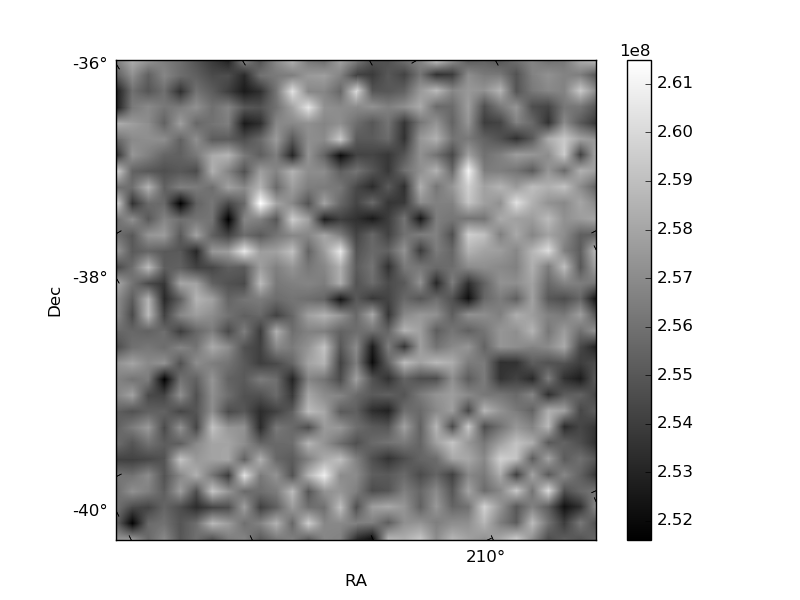
| Quadrant D | 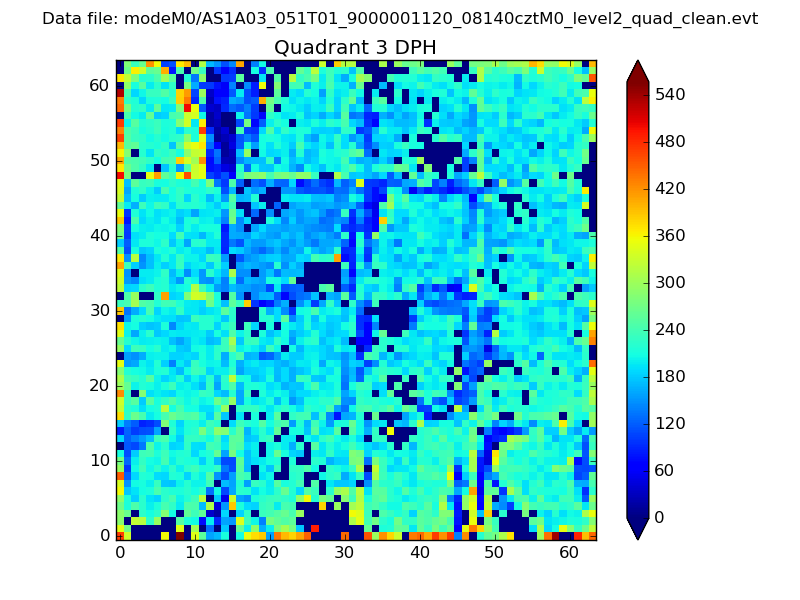 |
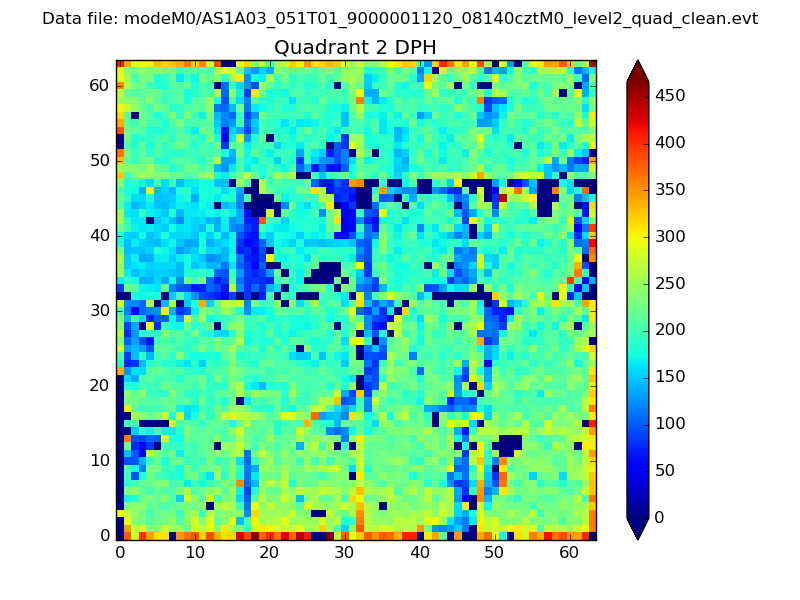 |
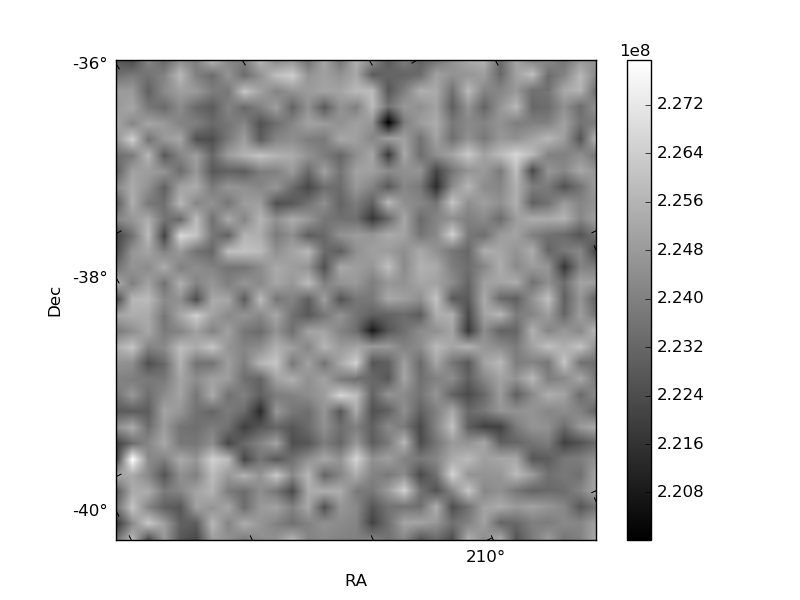
Quadrant C |
| Plot type | Count rate plots | Images |
|---|---|---|
| Comparison with Poisson distribution Blue bars denote a histogram of data divided into 1 sec bins. Red curve is a Poisson curve with rate = median count rate of data. |
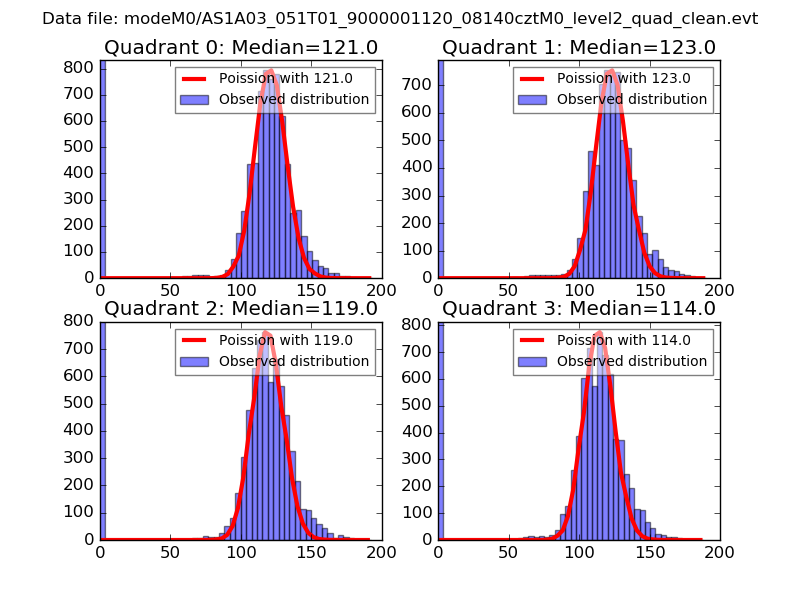 |
 |
| Quadrant-wise count rates Data is divided into 100 sec bins |
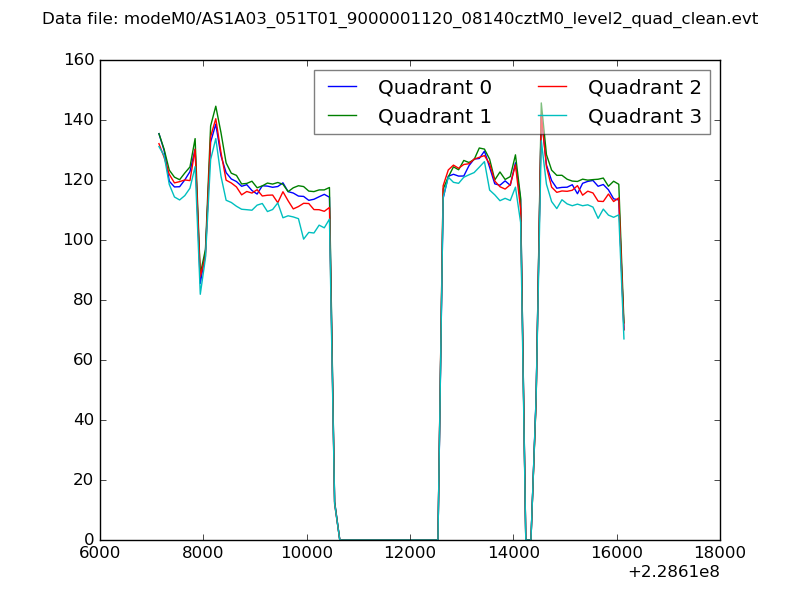 |
|
| Module-wise count rates for Quadrant A Data is divided into 100 sec bins |
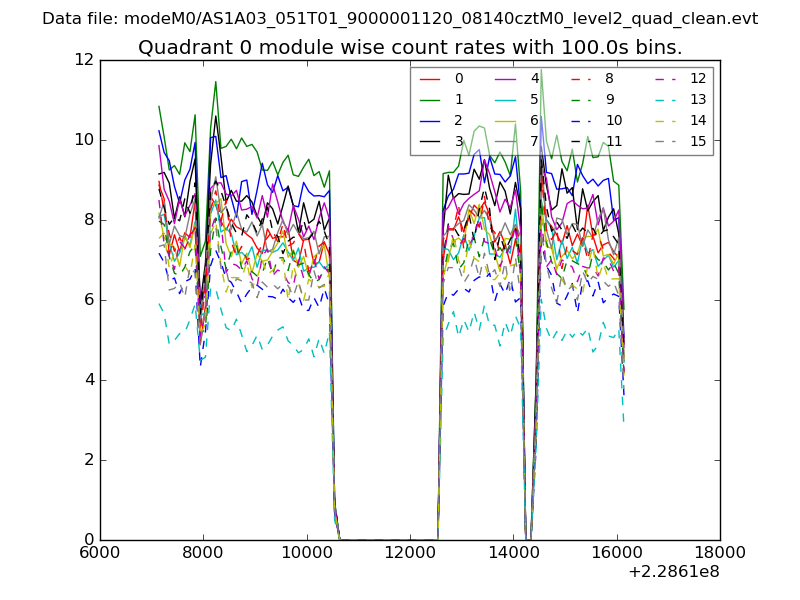 |
 |
| Module-wise count rates for Quadrant B Data is divided into 100 sec bins |
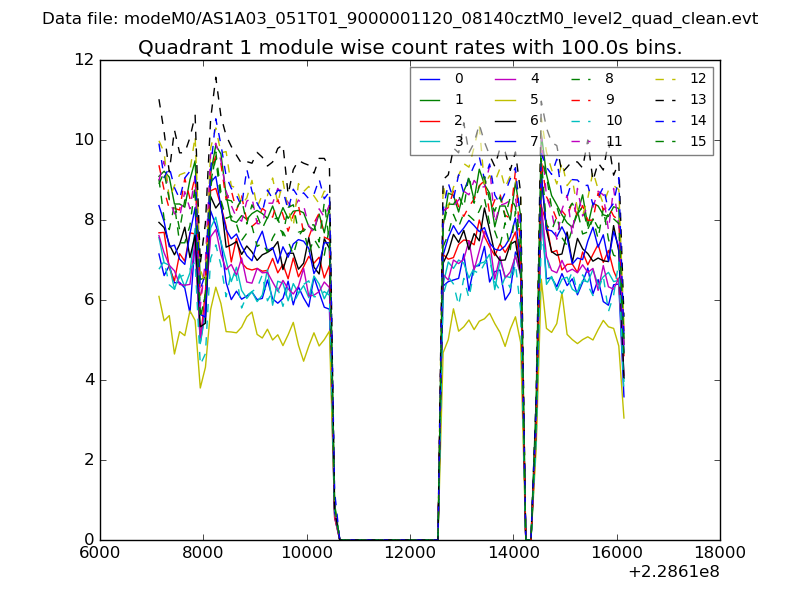 |
 |
| Module-wise count rates for Quadrant C Data is divided into 100 sec bins |
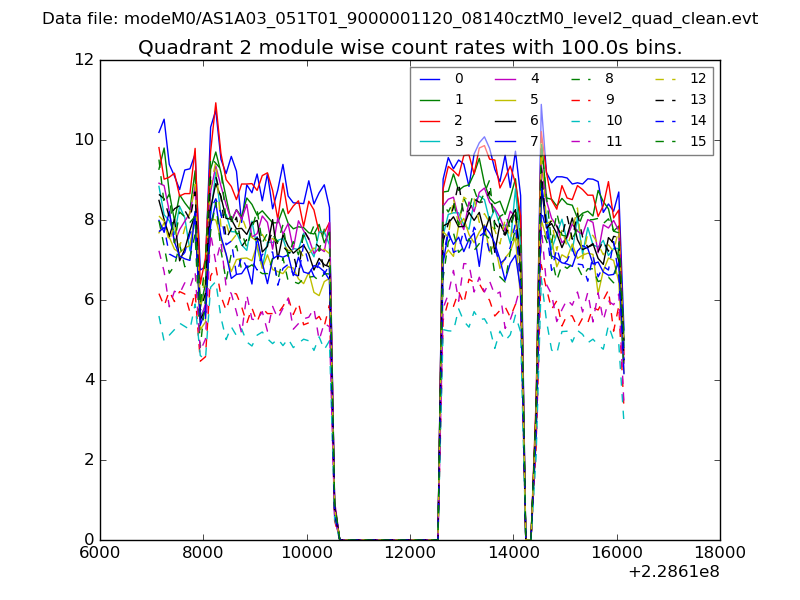 |
 |
| Module-wise count rates for Quadrant D Data is divided into 100 sec bins |
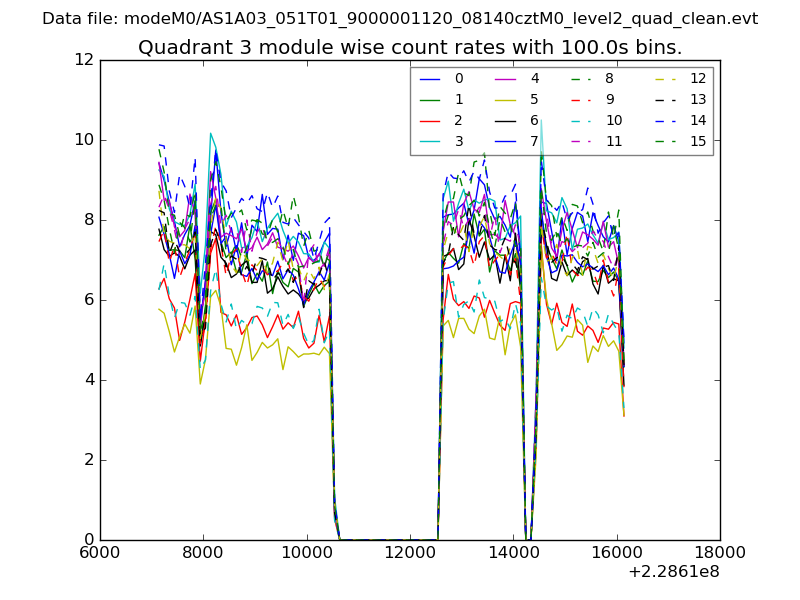 |
 |
| Parameter | Plot |
|---|---|
| CZT HV Monitor | 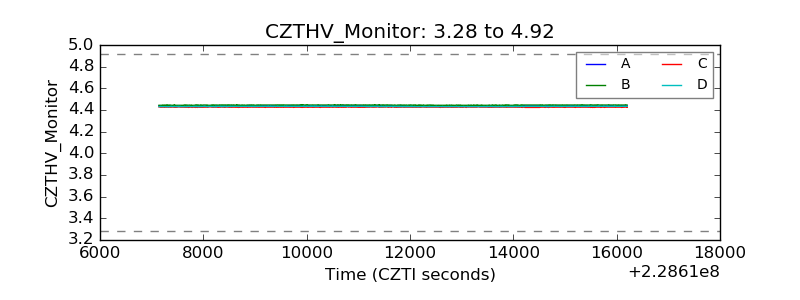 |
| D_VDD | 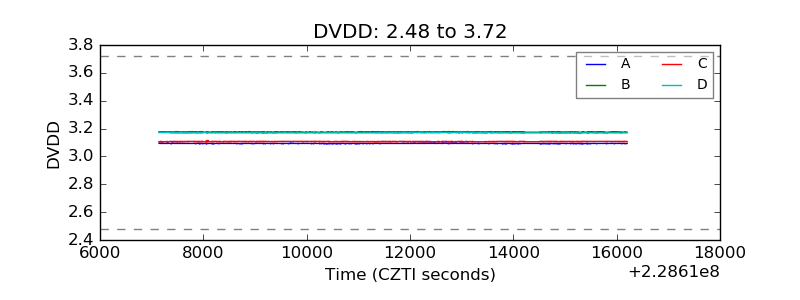 |
| Temperature 1 |  |
| Veto HV Monitor | 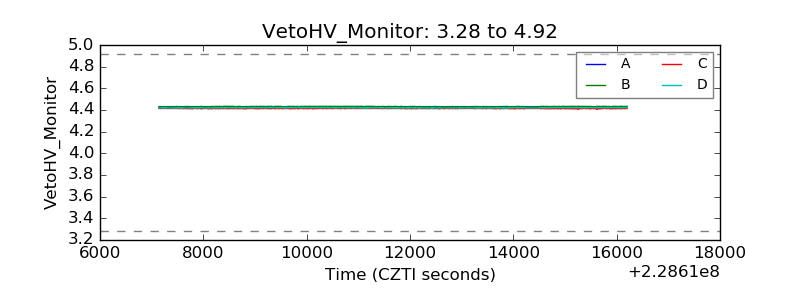 |
| Veto LLD |  |
| Alpha Counter | 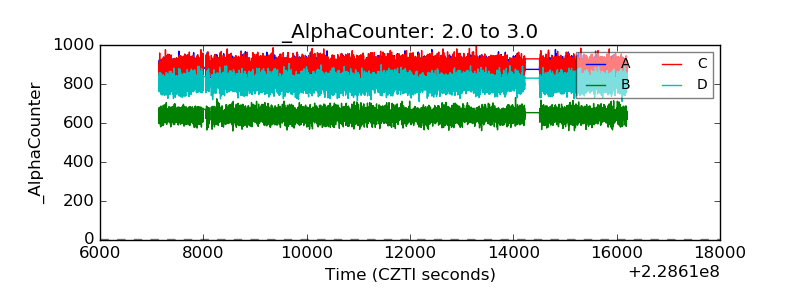 |
| _CPM_Rate | 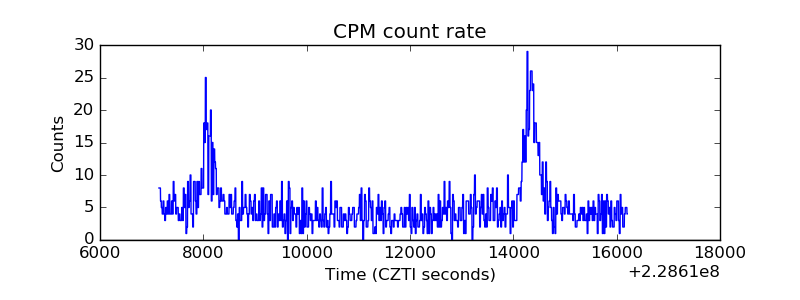 |
| CZT Counter | 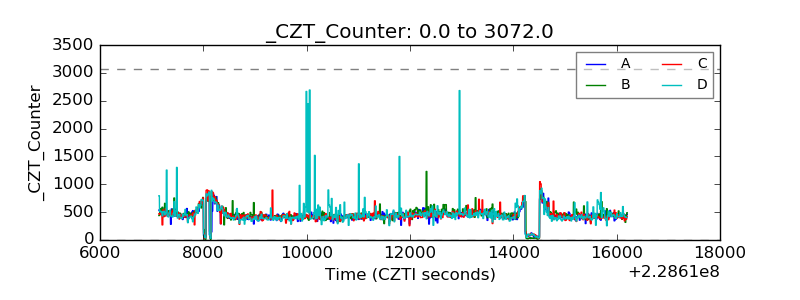 |
| +2.5 Volts monitor |  |
| +5 Volts monitor |  |
| _ROLL_ROT | 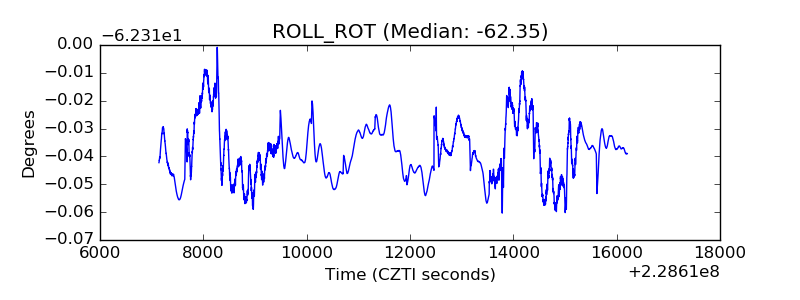 |
| _Roll_DEC | 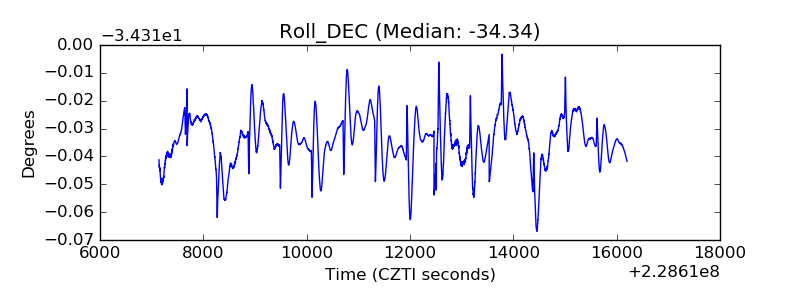 |
| _Roll_RA | 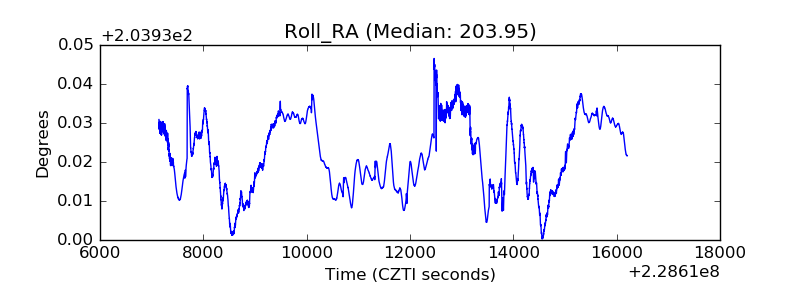 |
| Veto Counter | 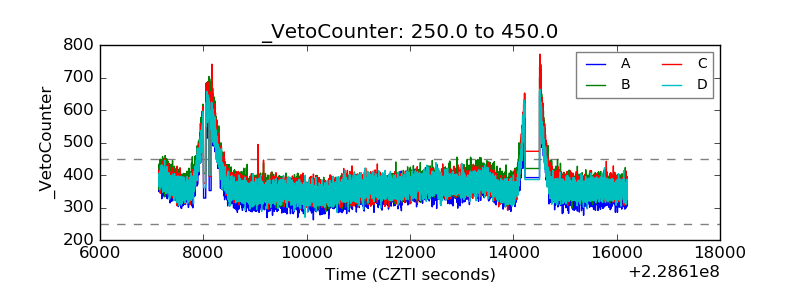 |