| Param | Original file | Final file |
|---|---|---|
| Filename | modeM0/AS1A03_051T01_9000001120_08142cztM0_level2.evt | modeM0/AS1A03_051T01_9000001120_08142cztM0_level2_quad_clean.evt |
| Size (bytes) | 819,725,760 | 157,279,680 |
| Size | 781.8 MB | 150.0 MB |
| Events in quadrant A | 5,702,149 | 979,182 |
| Events in quadrant B | 5,998,473 | 997,509 |
| Events in quadrant C | 5,724,644 | 971,272 |
| Events in quadrant D | 6,535,296 | 933,714 |
| Mode M9 | |||
|---|---|---|---|
| Quadrant | BADHDUFLAG | Total packets | Discarded packets |
| A | 0 | 11 | 0 |
| B | 0 | 11 | 0 |
| C | 0 | 11 | 0 |
| D | 0 | 11 | 0 |
| Mode SS | |||
|---|---|---|---|
| Quadrant | BADHDUFLAG | Total packets | Discarded packets |
| A | 0 | 262 | 2 |
| B | 0 | 262 | 0 |
| C | 0 | 262 | 2 |
| D | 0 | 262 | 4 |
| Mode M0 | |||
|---|---|---|---|
| Quadrant | BADHDUFLAG | Total packets | Discarded packets |
| A | 0 | 26167 | 325 |
| B | 0 | 26540 | 279 |
| C | 0 | 26228 | 300 |
| D | 0 | 28815 | 445 |
| Quadrant | Total seconds | Saturated seconds | Saturation percentage |
|---|---|---|---|
| A | 12743 | 116 | 0.910304% |
| B | 12769 | 165 | 1.292192% |
| C | 12754 | 129 | 1.011447% |
| D | 12739 | 177 | 1.389434% |
Noise dominated data is calculated using 1-second bins in cleaned event files. If a bin has >2000 counts, and if more than 50% of those come from <1% of pixels, then it is considered to be noise-dominated and hence unusable.
| Quadrant | # 1 sec bins | Bins with >0 counts | Bins with >2000 counts | High rate bins dominated by noise | Noise dominated (total time) | Noise dominated (detector-on time) | Marked lightcurve |
|---|---|---|---|---|---|---|---|
| A | 14010 | 12869 | 0 | 0 | 0.00% | 0.00% |  |
| B | 14010 | 12884 | 12 | 12 | 0.09% | 0.09% |  |
| C | 14010 | 12875 | 0 | 0 | 0.00% | 0.00% | 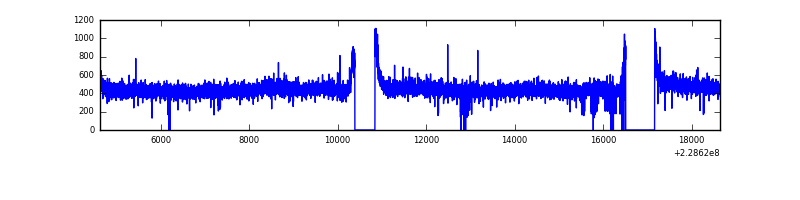 |
| D | 14010 | 12862 | 66 | 66 | 0.47% | 0.51% |  |
Top three noisy pixels from each quadrant. If the there are fewer than three noisy pixels in the level2.evt file, extra rows are filled as -1
| Pixel properties | Quadrant properties | ||||||
|---|---|---|---|---|---|---|---|
| Quadrant | DetID | PixID | Counts | Sigma | Mean | Median | Sigma |
| A | 0 | 226 | 13700 | 40.36 | 1480 | 1446 | 303.6 |
| A | 12 | 194 | 13197 | 38.7 | 1480 | 1446 | 303.6 |
| A | 13 | 251 | 9659 | 27.05 | 1480 | 1446 | 303.6 |
| B | 4 | 173 | 81272 | 281.22 | 1493 | 1457 | 283.8 |
| B | 0 | 214 | 57250 | 196.58 | 1493 | 1457 | 283.8 |
| B | 10 | 16 | 38083 | 129.05 | 1493 | 1457 | 283.8 |
| C | 1 | 16 | 55044 | 159.01 | 1451 | 1455 | 337.0 |
| C | 13 | 61 | 10898 | 28.02 | 1451 | 1455 | 337.0 |
| C | 8 | 128 | 6491 | 14.94 | 1451 | 1455 | 337.0 |
| D | 1 | 52 | 589306 | 1680.63 | 1429 | 1391 | 349.8 |
| D | 12 | 233 | 219476 | 623.42 | 1429 | 1391 | 349.8 |
| D | 12 | 227 | 181953 | 516.16 | 1429 | 1391 | 349.8 |
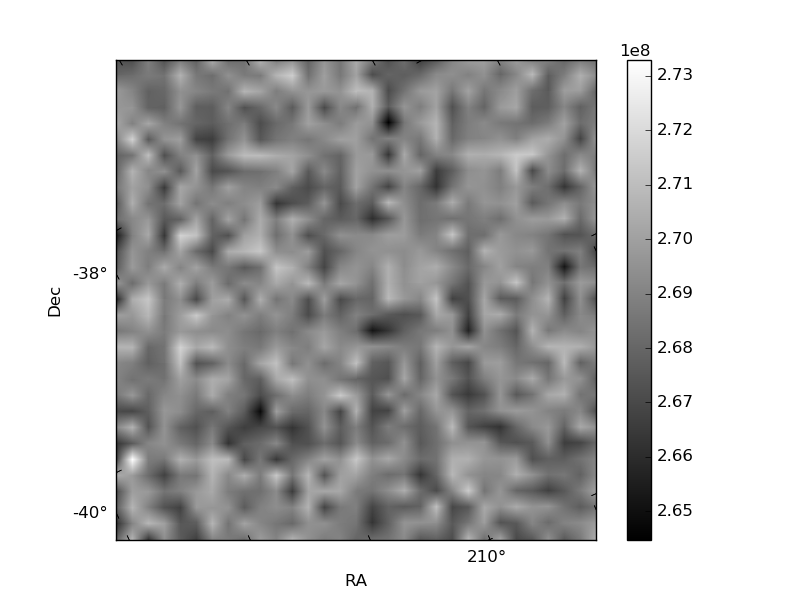
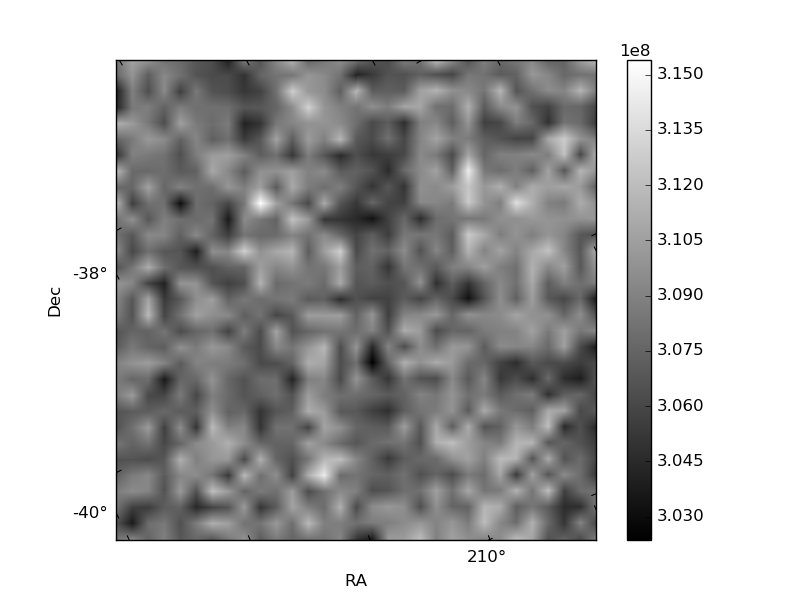
Histogram calculated using DETX and DETY for each event in the final _common_clean file
| Quadrant A | 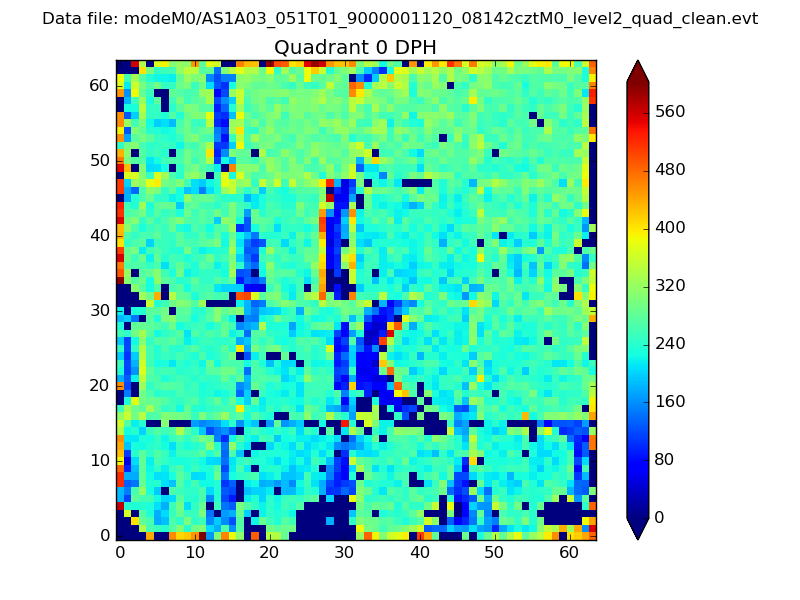 |
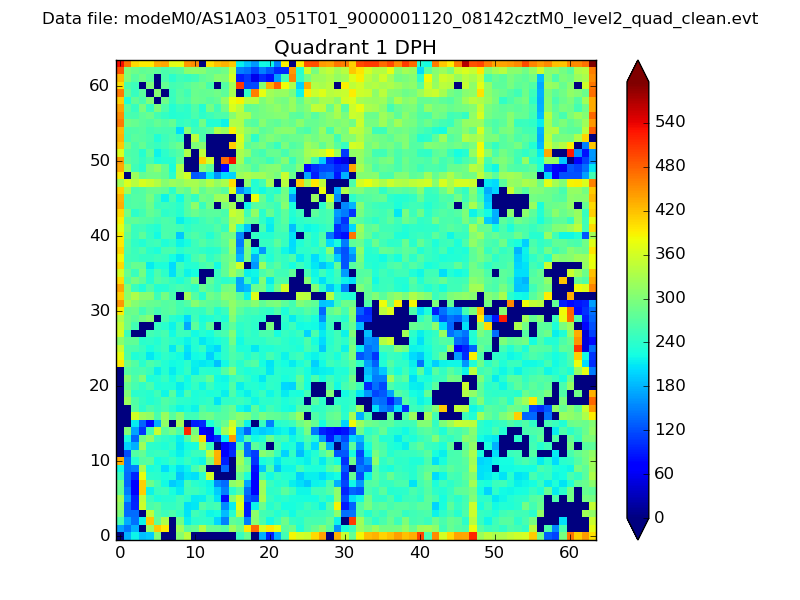 |
Quadrant B |
|---|---|---|---|
| Quadrant D | 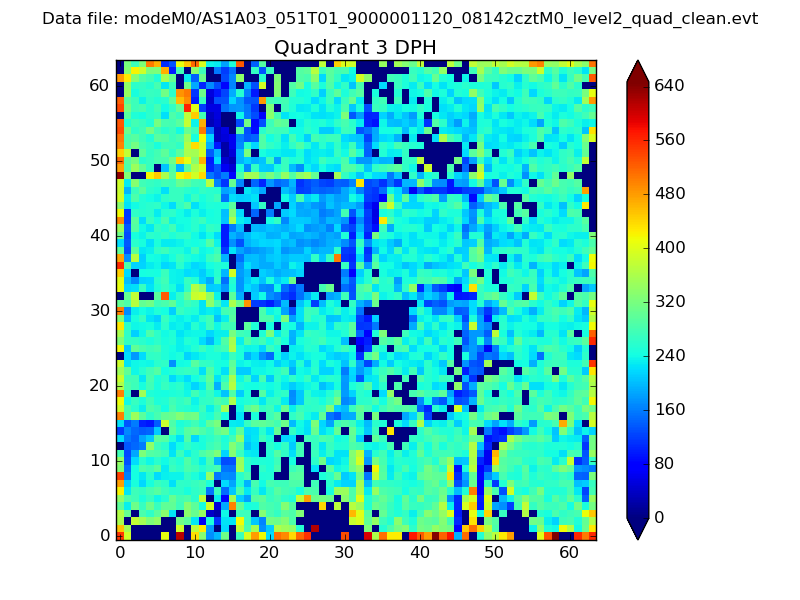 |
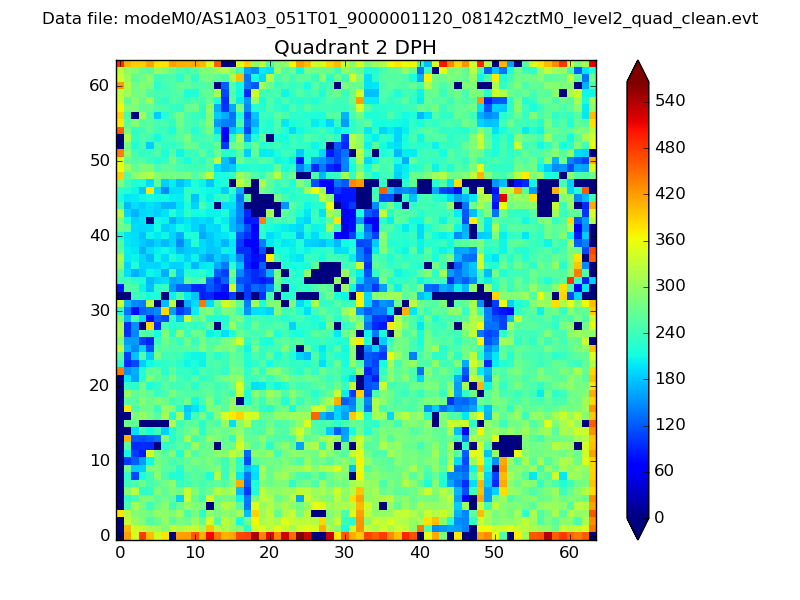 |
Quadrant C |
| Plot type | Count rate plots | Images |
|---|---|---|
| Comparison with Poisson distribution Blue bars denote a histogram of data divided into 1 sec bins. Red curve is a Poisson curve with rate = median count rate of data. |
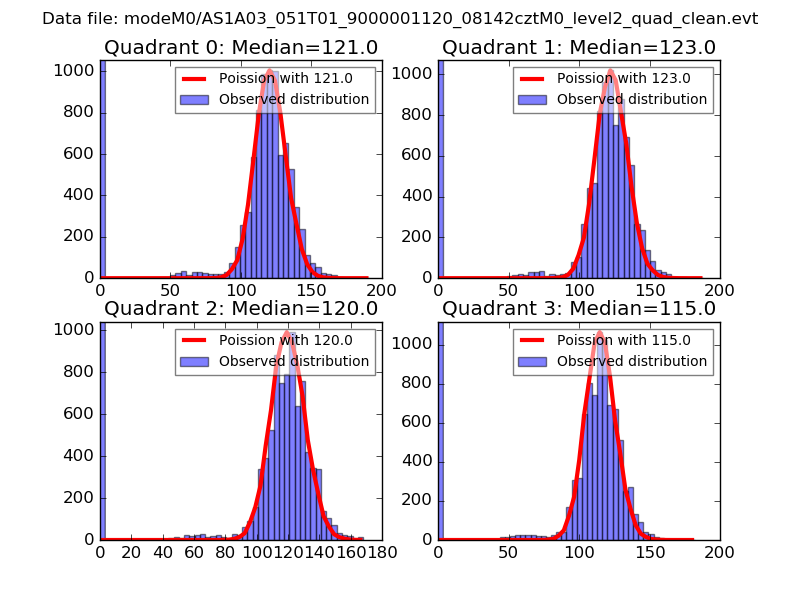 |
 |
| Quadrant-wise count rates Data is divided into 100 sec bins |
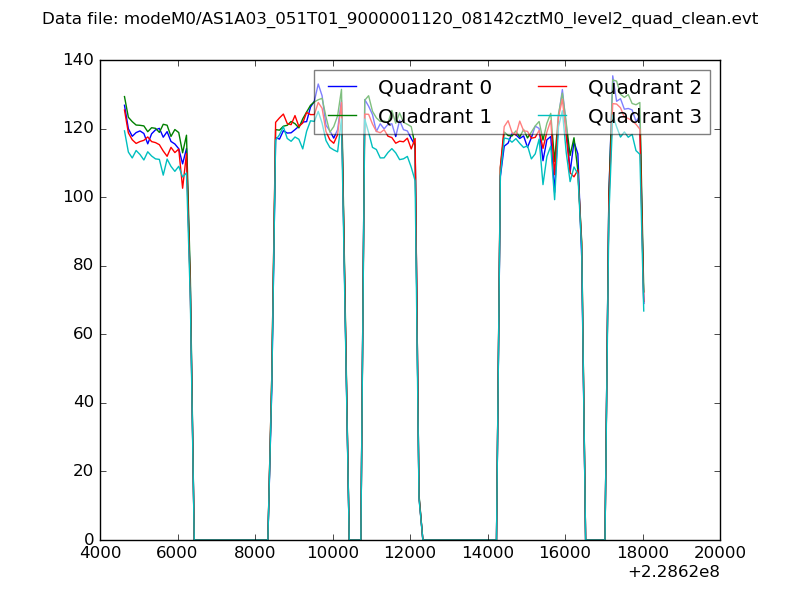 |
|
| Module-wise count rates for Quadrant A Data is divided into 100 sec bins |
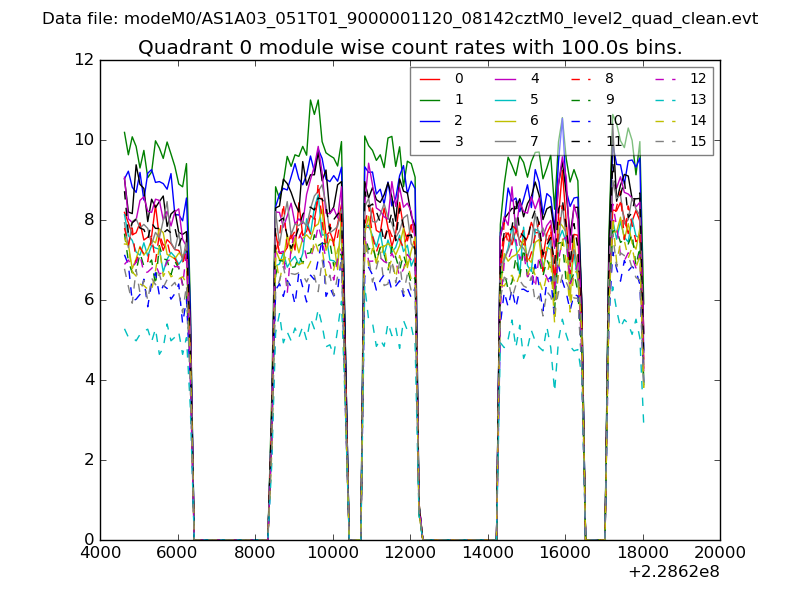 |
 |
| Module-wise count rates for Quadrant B Data is divided into 100 sec bins |
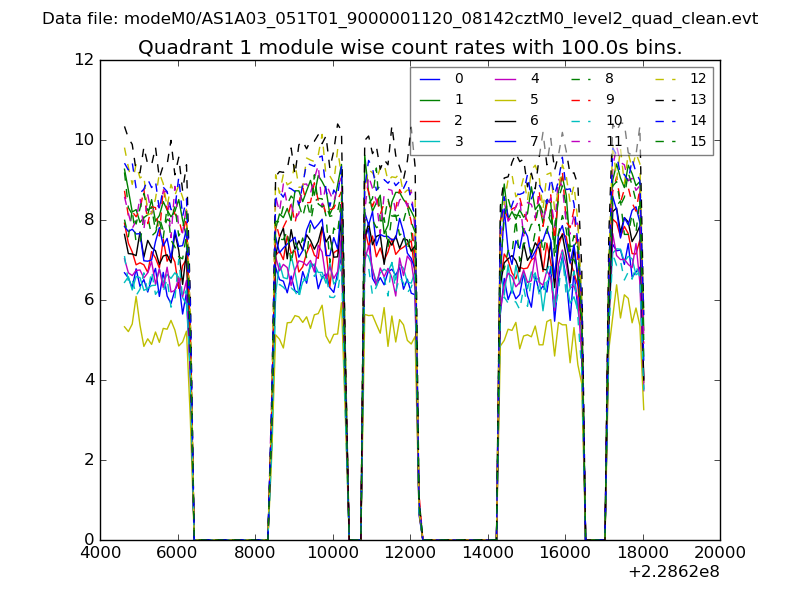 |
 |
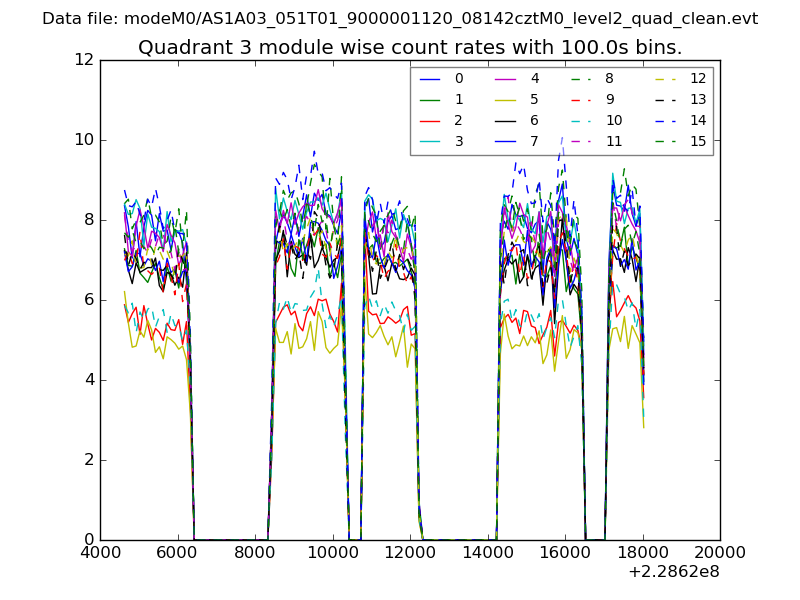
| Module-wise count rates for Quadrant C Data is divided into 100 sec bins |
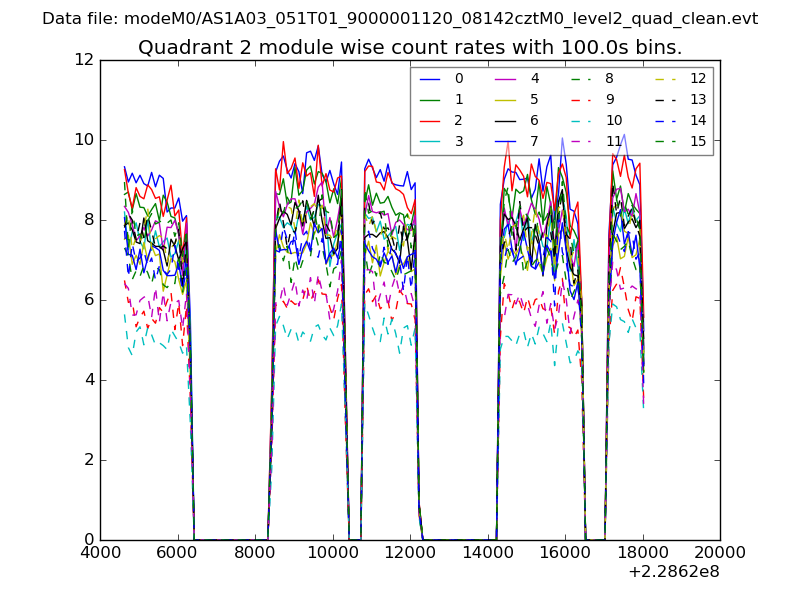 |
 |
| Module-wise count rates for Quadrant D Data is divided into 100 sec bins |
 |
 |
| Parameter | Plot |
|---|---|
| CZT HV Monitor | 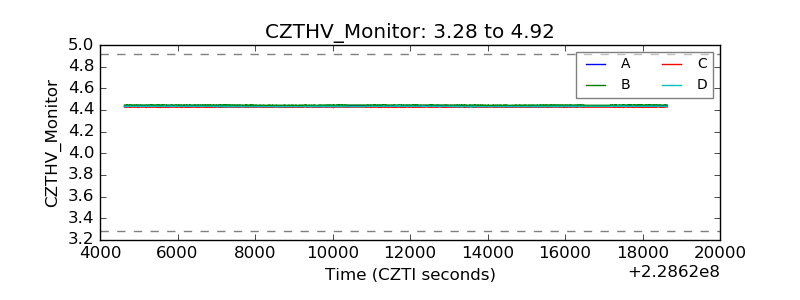 |
| D_VDD | 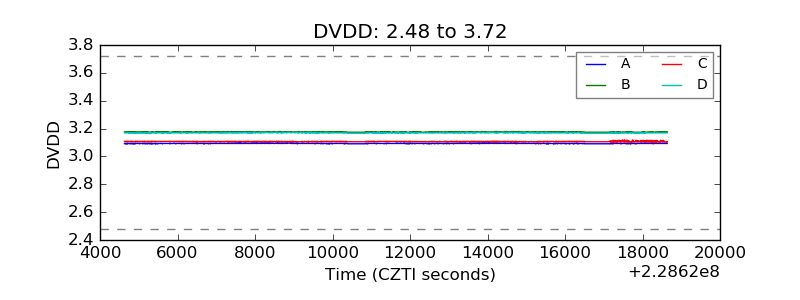 |
| Temperature 1 | 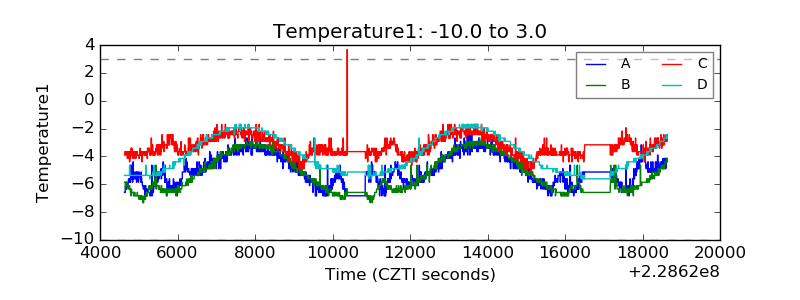 |
| Veto HV Monitor | 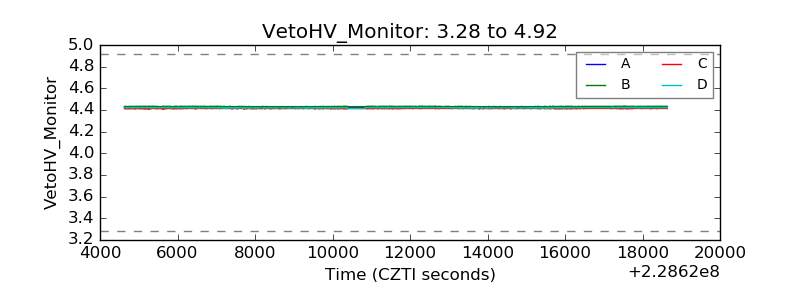 |
| Veto LLD | 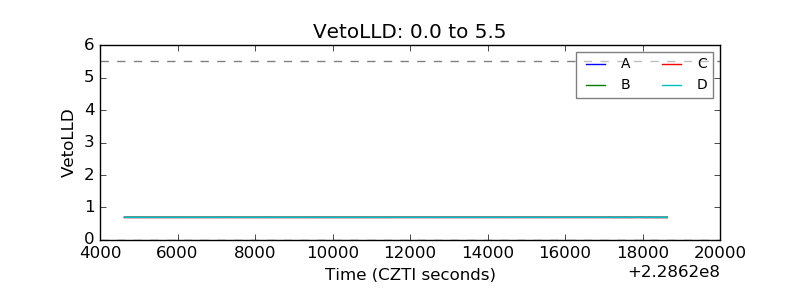 |
| Alpha Counter | 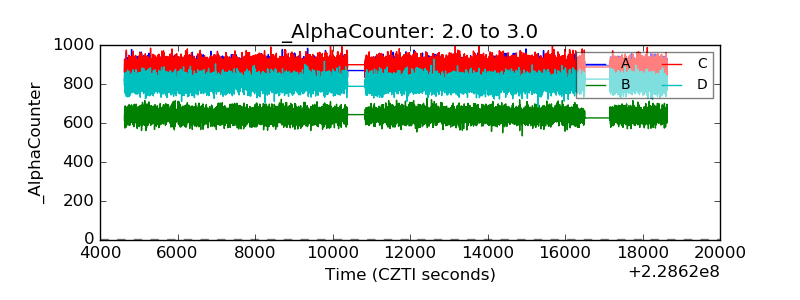 |
| _CPM_Rate | 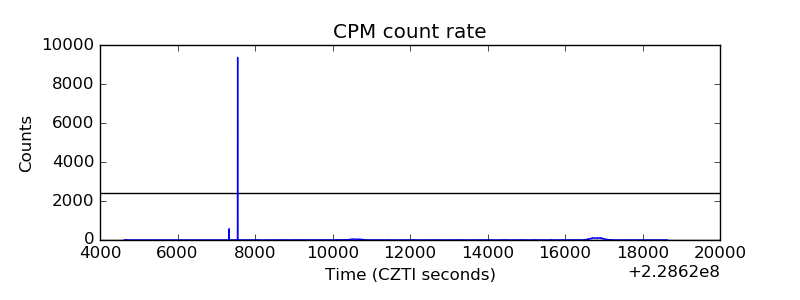 |
| CZT Counter | 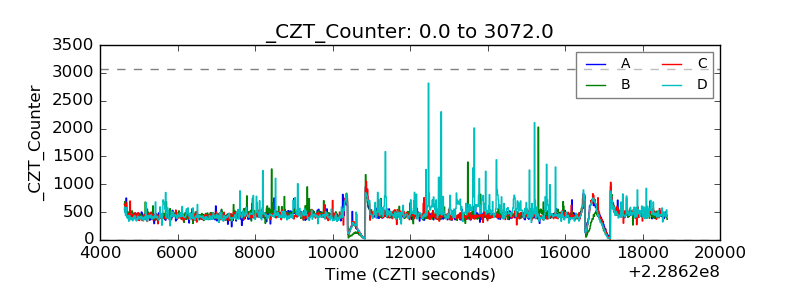 |
| +2.5 Volts monitor |  |
| +5 Volts monitor |  |
| _ROLL_ROT | 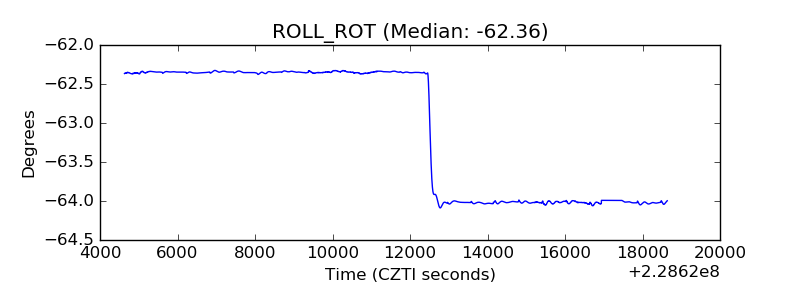 |
| _Roll_DEC | 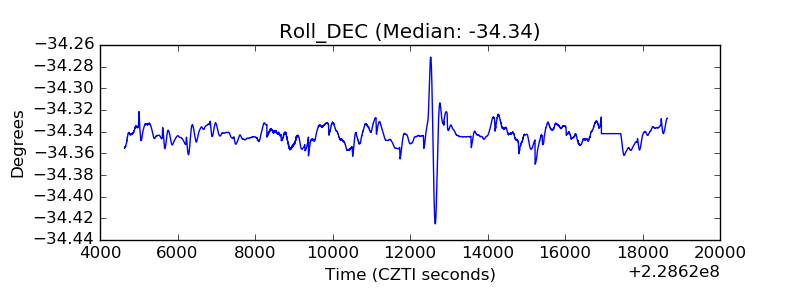 |
| _Roll_RA | 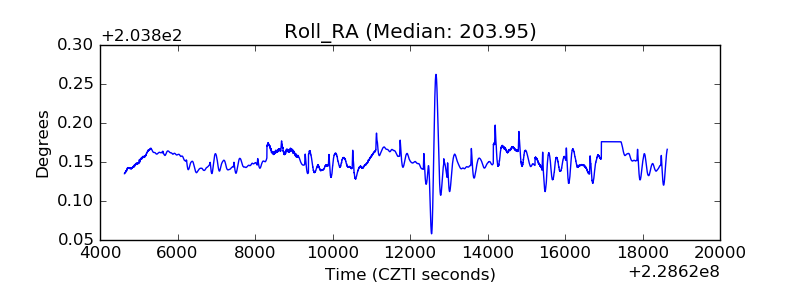 |
| Veto Counter | 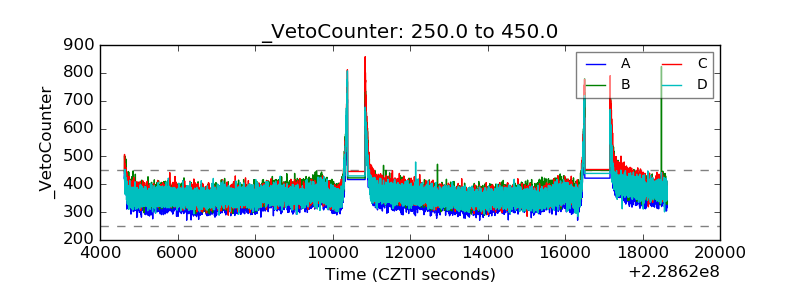 |