| Param | Original file | Final file |
|---|---|---|
| Filename | modeM0/AS1A03_051T01_9000001120_08146cztM0_level2.evt | modeM0/AS1A03_051T01_9000001120_08146cztM0_level2_quad_clean.evt |
| Size (bytes) | 436,815,360 | 64,638,720 |
| Size | 416.6 MB | 61.6 MB |
| Events in quadrant A | 3,125,694 | 378,615 |
| Events in quadrant B | 3,452,067 | 379,812 |
| Events in quadrant C | 3,128,795 | 380,176 |
| Events in quadrant D | 3,082,769 | 367,292 |
| Mode M9 | |||
|---|---|---|---|
| Quadrant | BADHDUFLAG | Total packets | Discarded packets |
| A | 0 | 15 | 0 |
| B | 0 | 15 | 0 |
| C | 0 | 15 | 0 |
| D | 0 | 16 | 0 |
| Mode SS | |||
|---|---|---|---|
| Quadrant | BADHDUFLAG | Total packets | Discarded packets |
| A | 0 | 132 | 0 |
| B | 0 | 132 | 0 |
| C | 0 | 132 | 0 |
| D | 0 | 132 | 0 |
| Mode M0 | |||
|---|---|---|---|
| Quadrant | BADHDUFLAG | Total packets | Discarded packets |
| A | 0 | 13601 | 3 |
| B | 0 | 14427 | 2 |
| C | 0 | 13738 | 2 |
| D | 0 | 13725 | 2 |
| Quadrant | Total seconds | Saturated seconds | Saturation percentage |
|---|---|---|---|
| A | 6463 | 93 | 1.438960% |
| B | 6463 | 165 | 2.552994% |
| C | 6463 | 86 | 1.330651% |
| D | 6463 | 70 | 1.083088% |
Noise dominated data is calculated using 1-second bins in cleaned event files. If a bin has >2000 counts, and if more than 50% of those come from <1% of pixels, then it is considered to be noise-dominated and hence unusable.
| Quadrant | # 1 sec bins | Bins with >0 counts | Bins with >2000 counts | High rate bins dominated by noise | Noise dominated (total time) | Noise dominated (detector-on time) | Marked lightcurve |
|---|---|---|---|---|---|---|---|
| A | 7559 | 6464 | 0 | 0 | 0.00% | 0.00% | 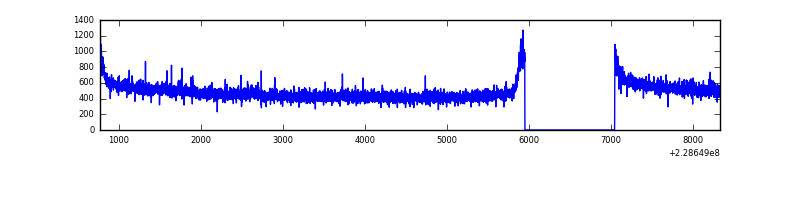 |
| B | 7559 | 6464 | 47 | 47 | 0.62% | 0.73% | 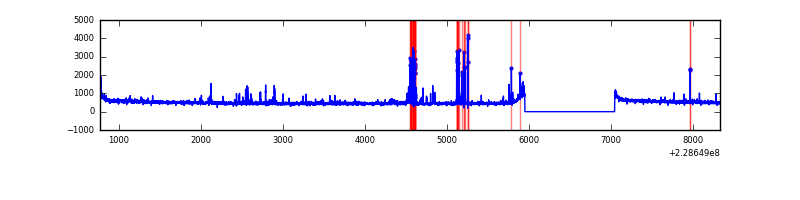 |
| C | 7559 | 6464 | 0 | 0 | 0.00% | 0.00% | 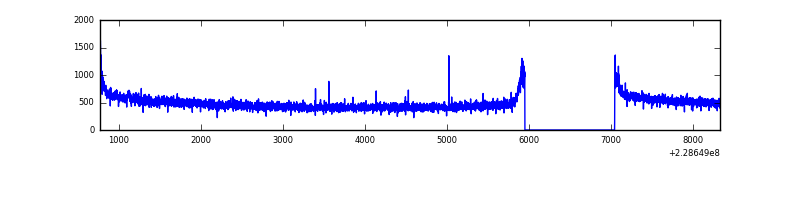 |
| D | 7559 | 6464 | 6 | 6 | 0.08% | 0.09% | 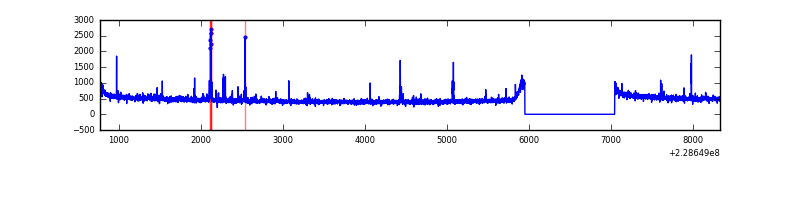 |
Top three noisy pixels from each quadrant. If the there are fewer than three noisy pixels in the level2.evt file, extra rows are filled as -1
| Pixel properties | Quadrant properties | ||||||
|---|---|---|---|---|---|---|---|
| Quadrant | DetID | PixID | Counts | Sigma | Mean | Median | Sigma |
| A | 3 | 1 | 11380 | 64.58 | 808 | 791 | 164.0 |
| A | 0 | 226 | 7498 | 40.9 | 808 | 791 | 164.0 |
| A | 12 | 194 | 7372 | 40.13 | 808 | 791 | 164.0 |
| B | 5 | 255 | 217502 | 1418.92 | 806 | 787 | 152.7 |
| B | 10 | 16 | 45679 | 293.93 | 806 | 787 | 152.7 |
| B | 0 | 214 | 27552 | 175.24 | 806 | 787 | 152.7 |
| C | 1 | 16 | 58547 | 318.68 | 787 | 791 | 181.2 |
| C | 13 | 61 | 5978 | 28.62 | 787 | 791 | 181.2 |
| C | 14 | 67 | 2715 | 10.62 | 787 | 791 | 181.2 |
| D | 7 | 71 | 51947 | 268.16 | 781 | 761 | 190.9 |
| D | 1 | 52 | 36718 | 188.38 | 781 | 761 | 190.9 |
| D | 2 | 234 | 20874 | 105.37 | 781 | 761 | 190.9 |
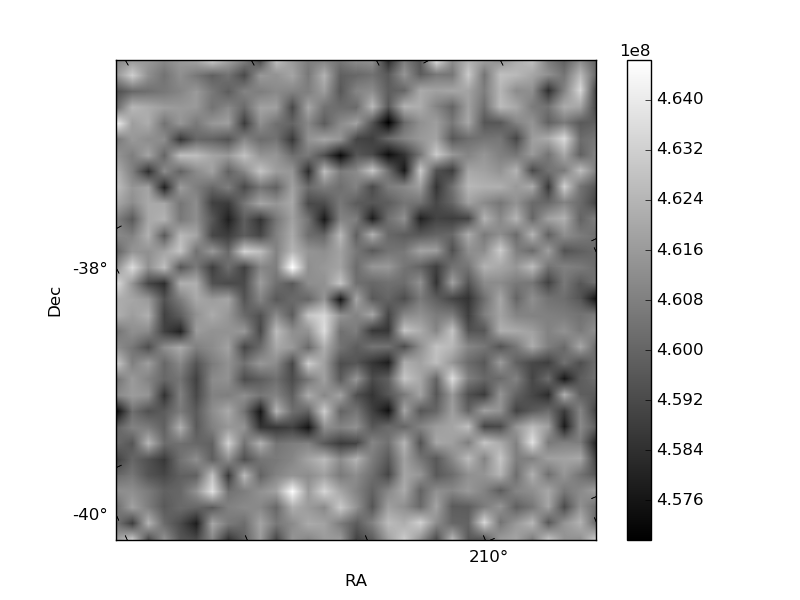
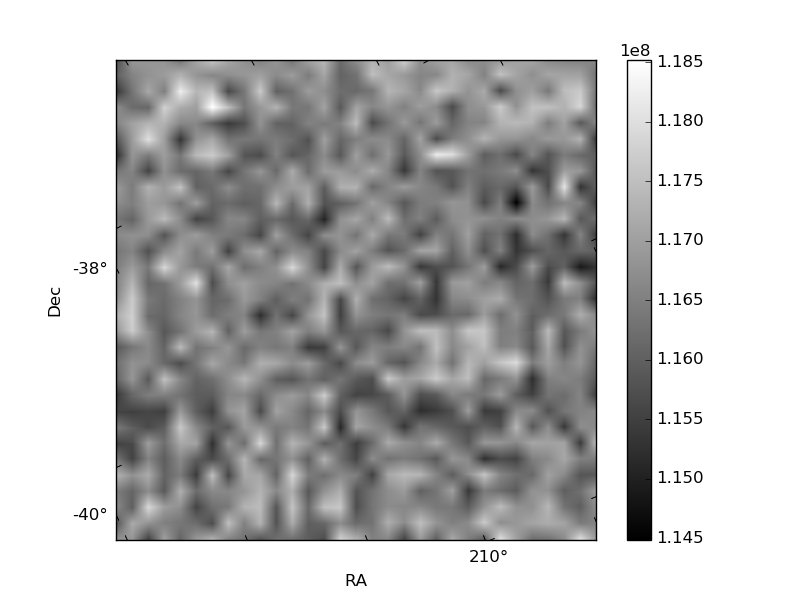
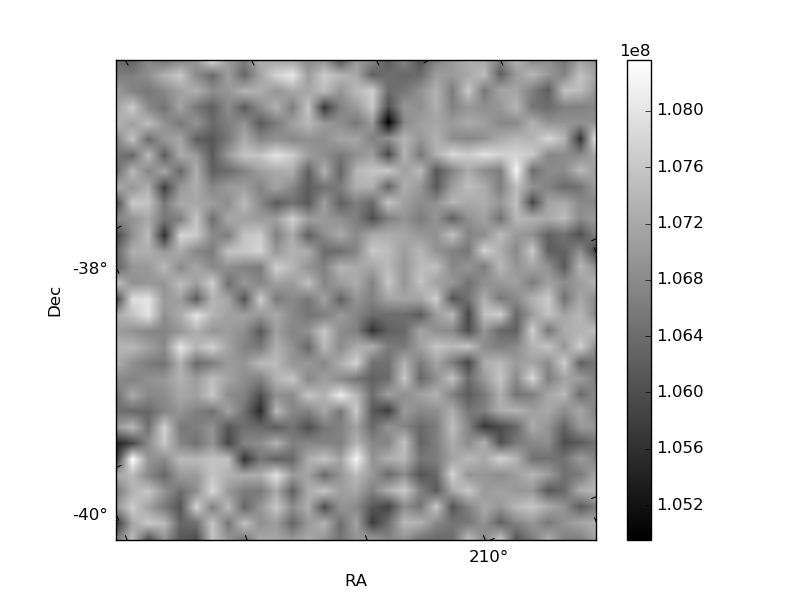
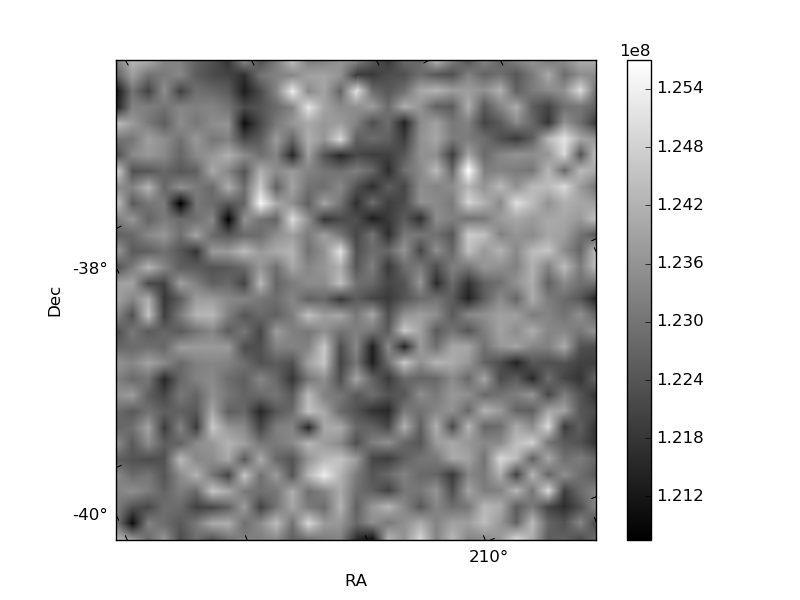
Histogram calculated using DETX and DETY for each event in the final _common_clean file
| Quadrant A | 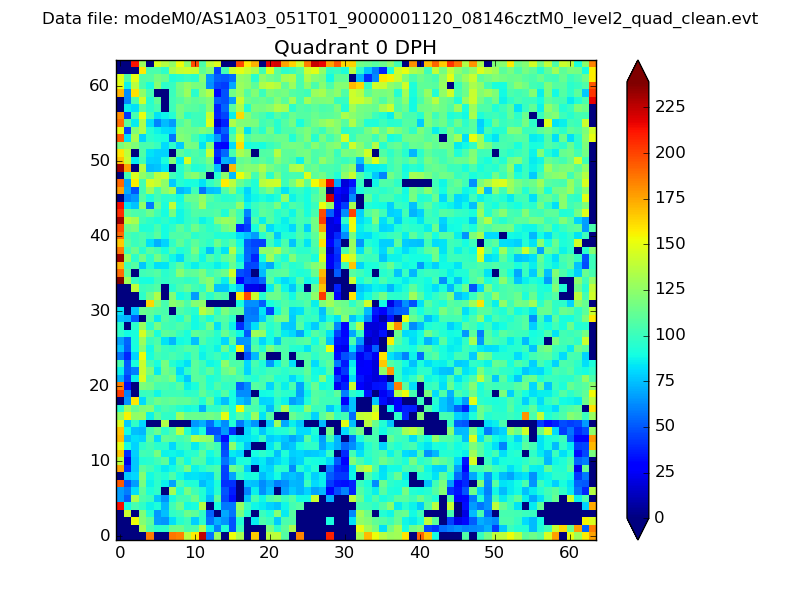 |
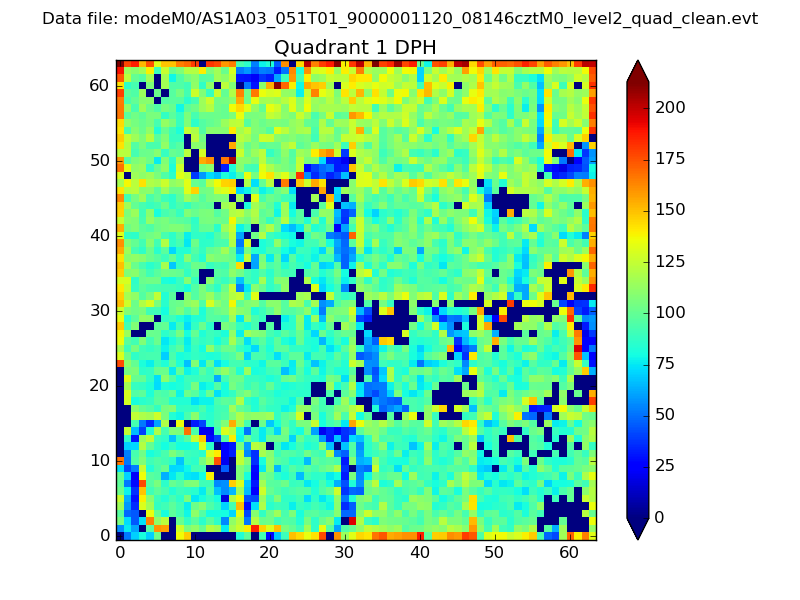 |
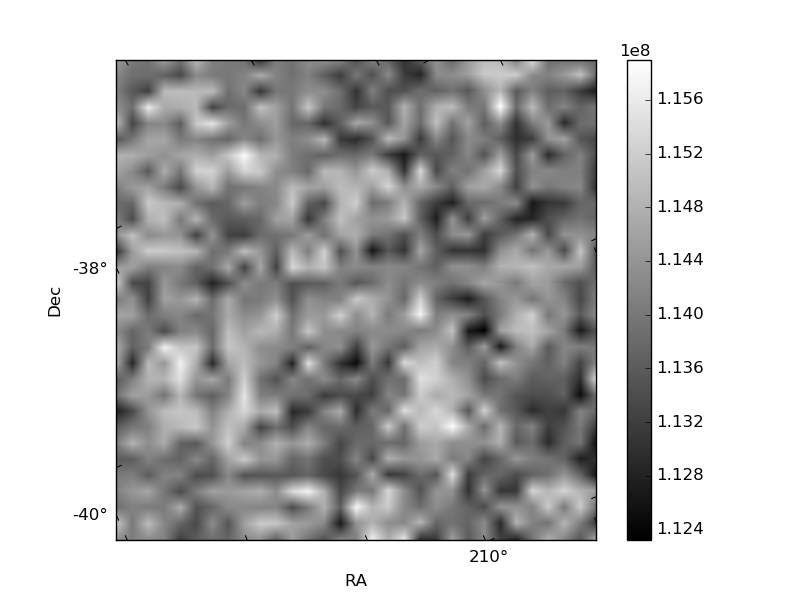
Quadrant B |
|---|---|---|---|
| Quadrant D | 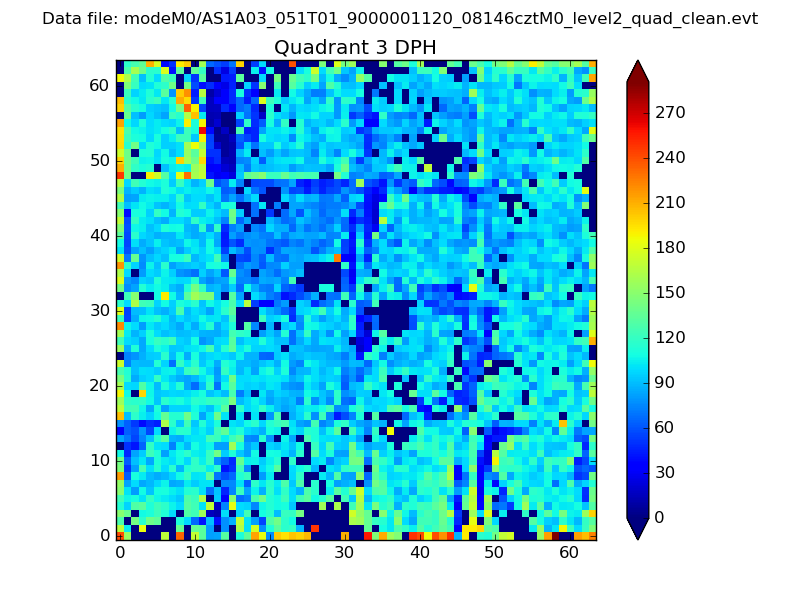 |
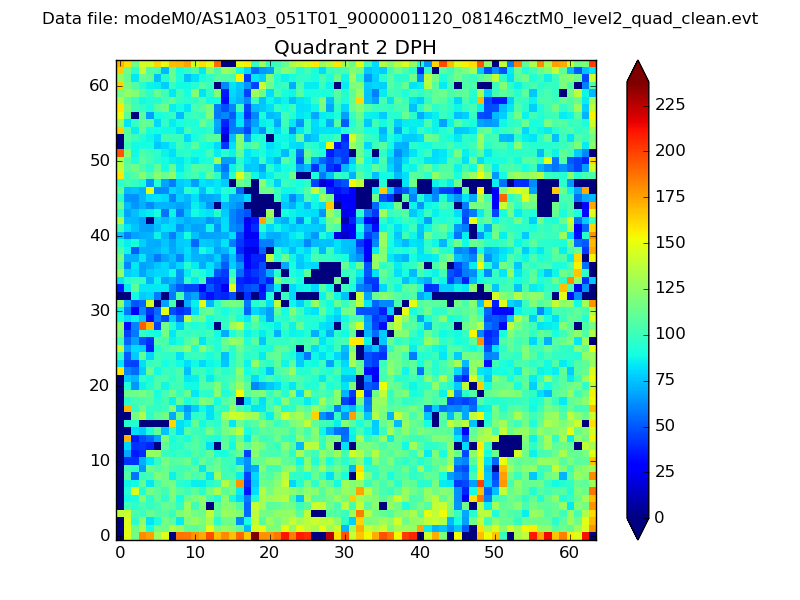 |
Quadrant C |
| Plot type | Count rate plots | Images |
|---|---|---|
| Comparison with Poisson distribution Blue bars denote a histogram of data divided into 1 sec bins. Red curve is a Poisson curve with rate = median count rate of data. |
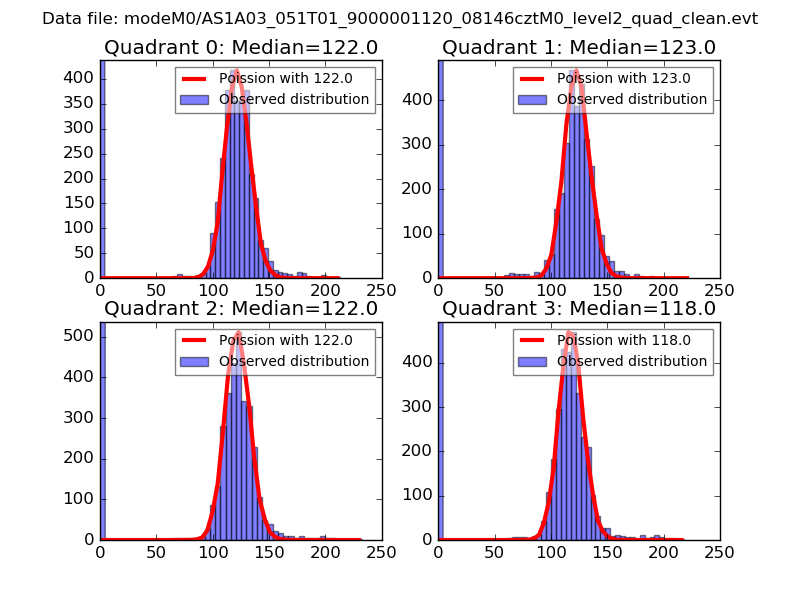 |
 |
| Quadrant-wise count rates Data is divided into 100 sec bins |
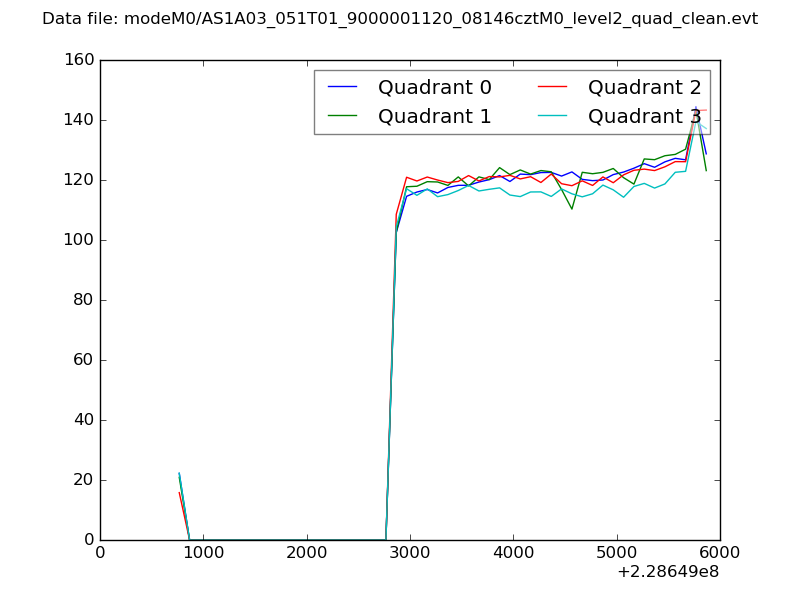 |
|
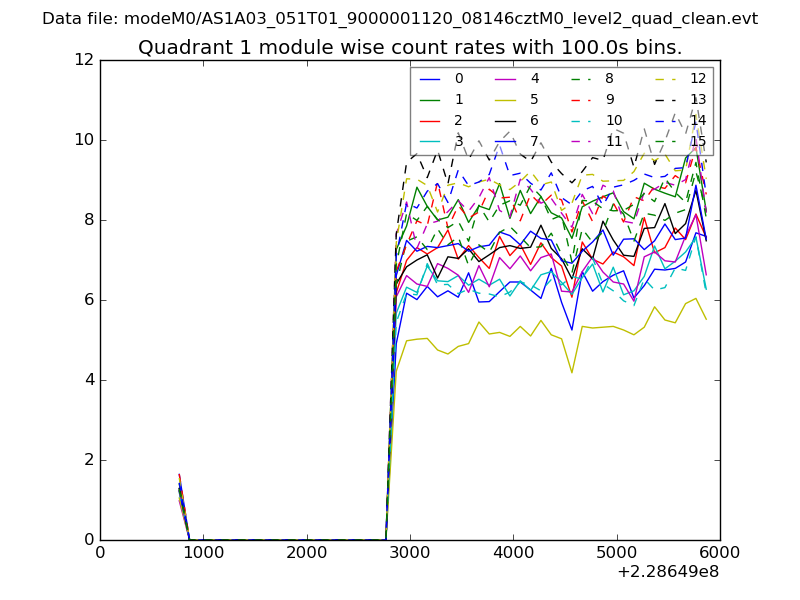
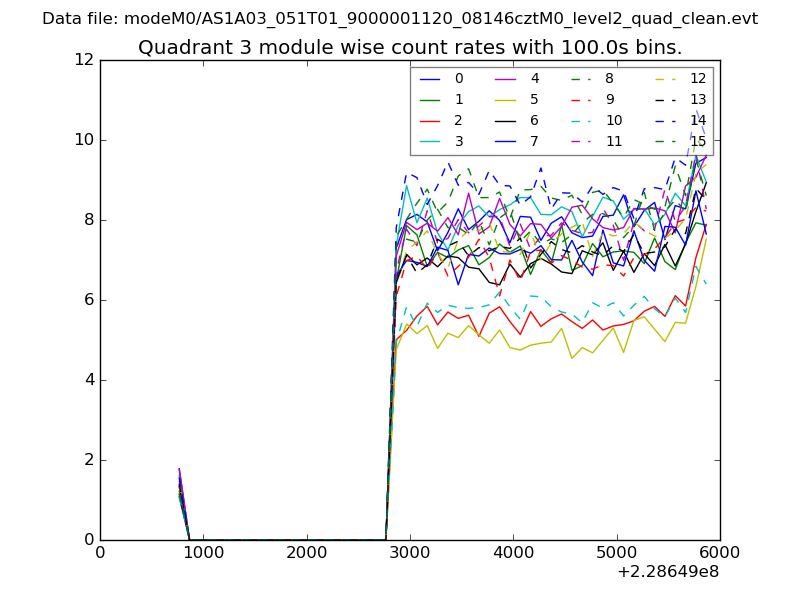
| Module-wise count rates for Quadrant A Data is divided into 100 sec bins |
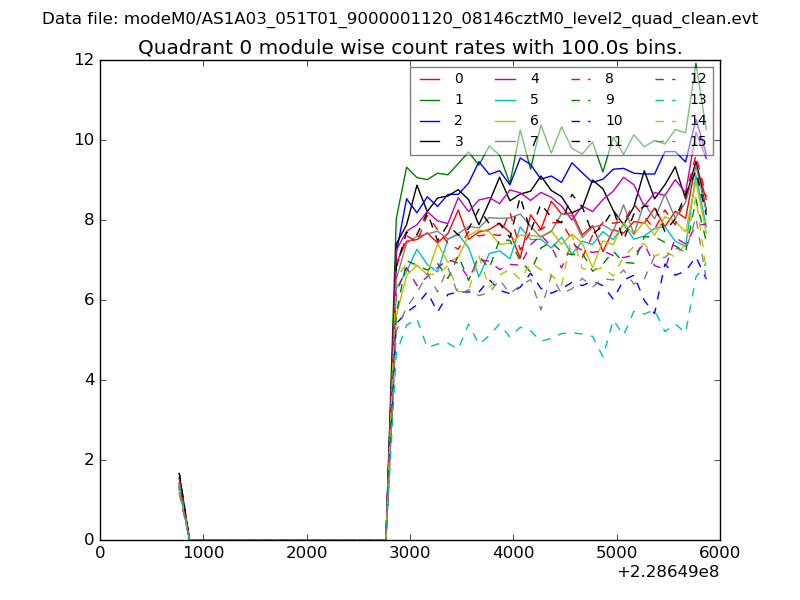 |
 |
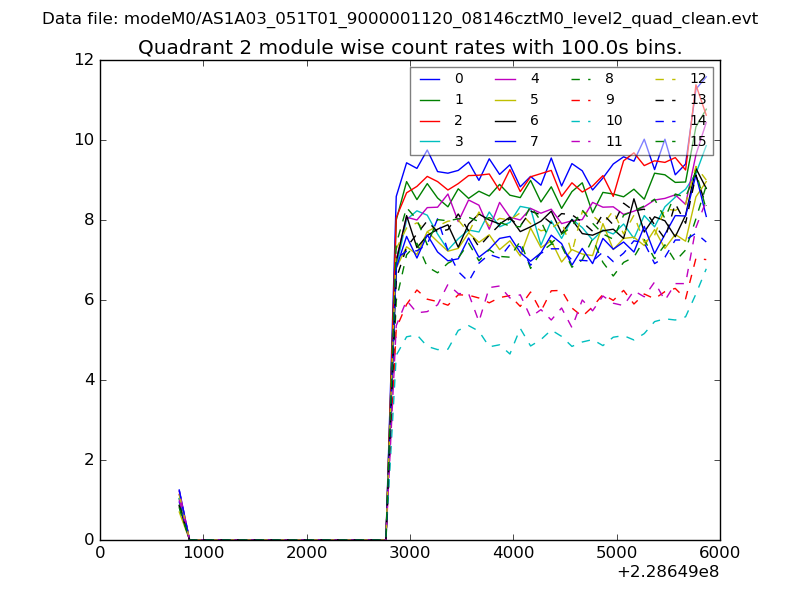
| Module-wise count rates for Quadrant B Data is divided into 100 sec bins |
 |
 |
| Module-wise count rates for Quadrant C Data is divided into 100 sec bins |
 |
 |
| Module-wise count rates for Quadrant D Data is divided into 100 sec bins |
 |
 |
| Parameter | Plot |
|---|---|
| CZT HV Monitor | 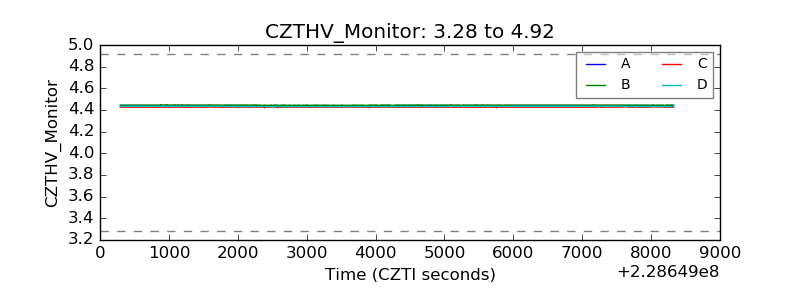 |
| D_VDD | 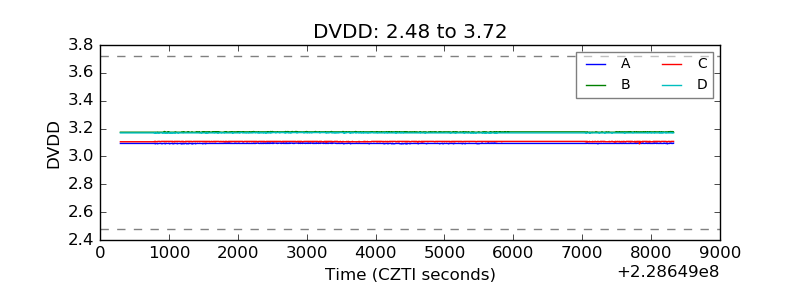 |
| Temperature 1 | 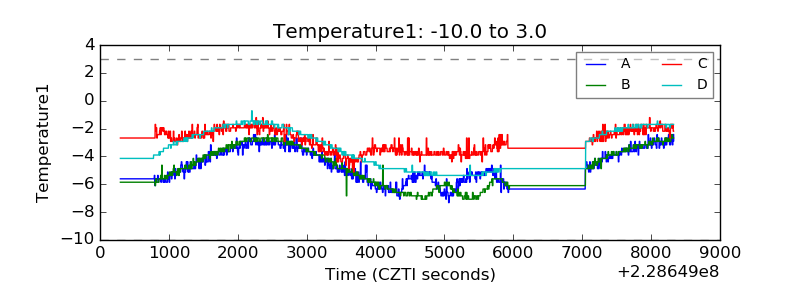 |
| Veto HV Monitor | 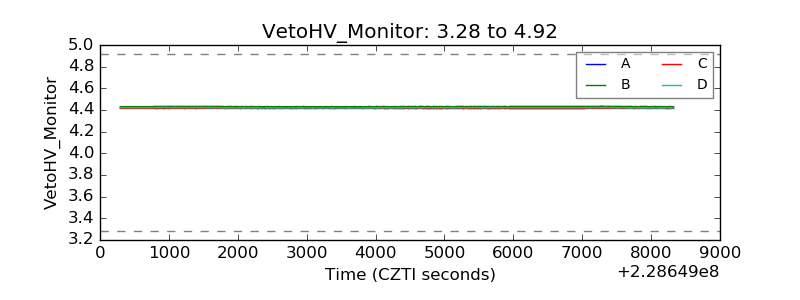 |
| Veto LLD | 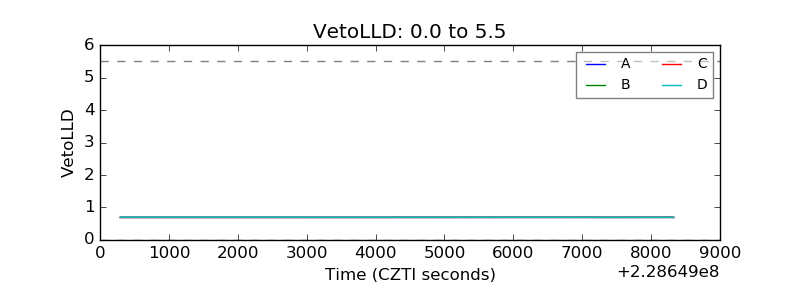 |
| Alpha Counter | 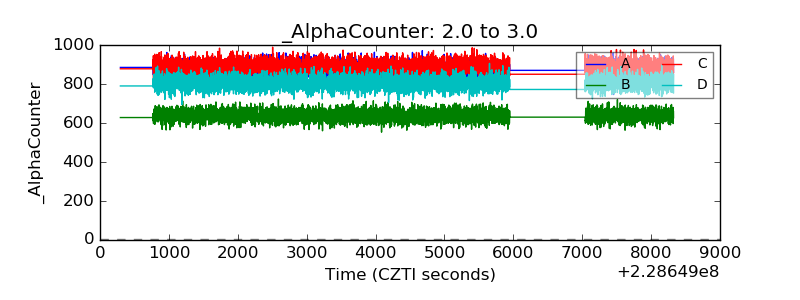 |
| _CPM_Rate | 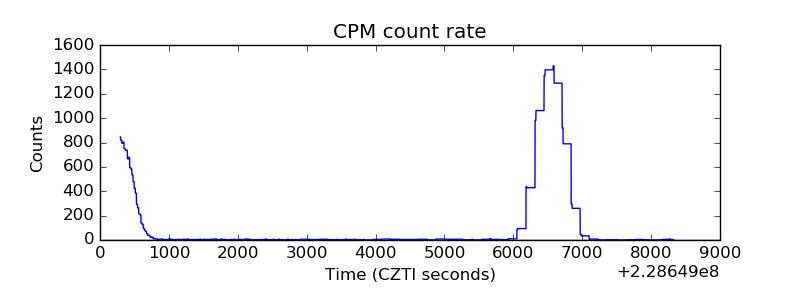 |
| CZT Counter | 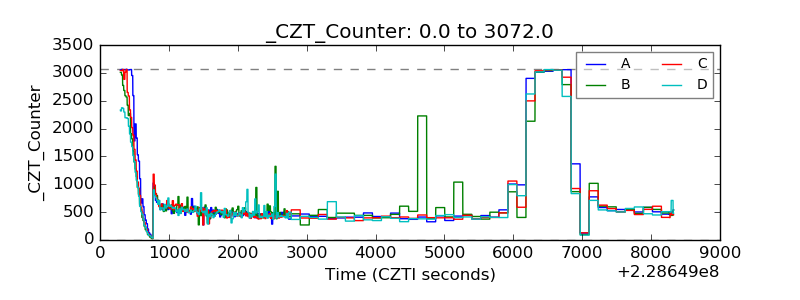 |
| +2.5 Volts monitor |  |
| +5 Volts monitor |  |
| _ROLL_ROT | 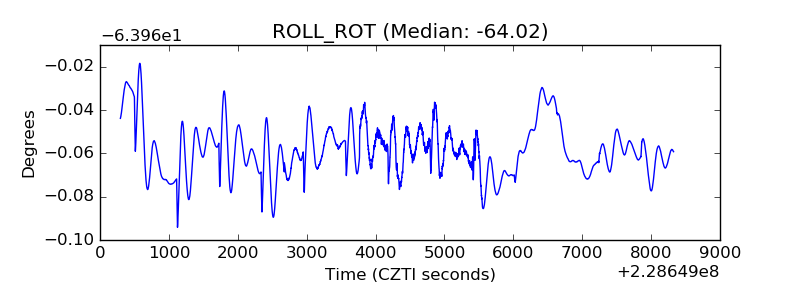 |
| _Roll_DEC | 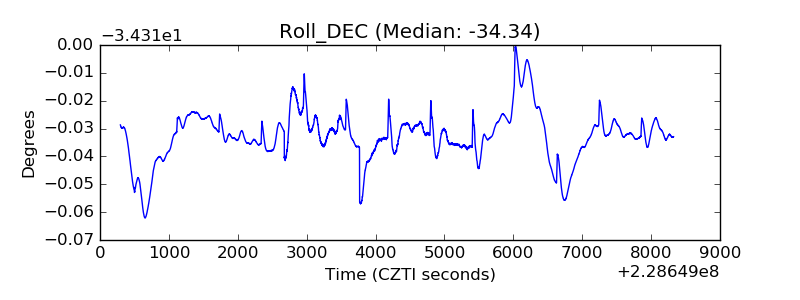 |
| _Roll_RA | 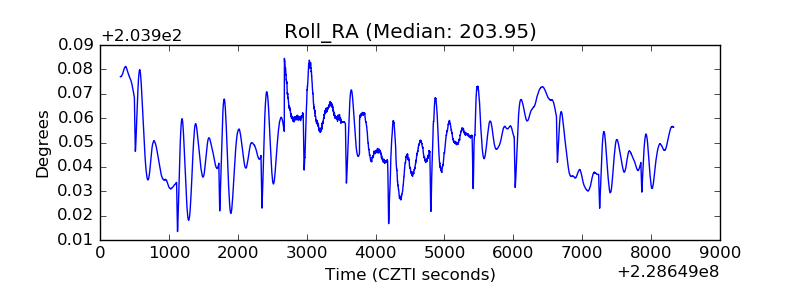 |
| Veto Counter | 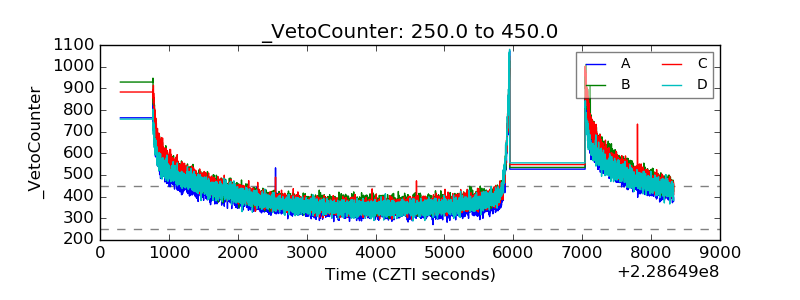 |