| Param | Original file | Final file |
|---|---|---|
| Filename | modeM0/AS1A03_051T01_9000001120_08148cztM0_level2.evt | modeM0/AS1A03_051T01_9000001120_08148cztM0_level2_quad_clean.evt |
| Size (bytes) | 479,511,360 | 92,136,960 |
| Size | 457.3 MB | 87.9 MB |
| Events in quadrant A | 3,301,901 | 589,508 |
| Events in quadrant B | 3,408,021 | 604,166 |
| Events in quadrant C | 3,361,671 | 586,102 |
| Events in quadrant D | 4,002,780 | 551,027 |
| Mode M9 | |||
|---|---|---|---|
| Quadrant | BADHDUFLAG | Total packets | Discarded packets |
| A | 0 | 24 | 0 |
| B | 0 | 24 | 0 |
| C | 0 | 24 | 0 |
| D | 0 | 24 | 0 |
| Mode SS | |||
|---|---|---|---|
| Quadrant | BADHDUFLAG | Total packets | Discarded packets |
| A | 0 | 136 | 0 |
| B | 0 | 136 | 0 |
| C | 0 | 136 | 0 |
| D | 0 | 136 | 0 |
| Mode M0 | |||
|---|---|---|---|
| Quadrant | BADHDUFLAG | Total packets | Discarded packets |
| A | 0 | 14056 | 3 |
| B | 0 | 14385 | 2 |
| C | 0 | 14387 | 2 |
| D | 0 | 16306 | 2 |
| Quadrant | Total seconds | Saturated seconds | Saturation percentage |
|---|---|---|---|
| A | 6585 | 157 | 2.384207% |
| B | 6585 | 161 | 2.444951% |
| C | 6585 | 137 | 2.080486% |
| D | 6585 | 241 | 3.659833% |
Noise dominated data is calculated using 1-second bins in cleaned event files. If a bin has >2000 counts, and if more than 50% of those come from <1% of pixels, then it is considered to be noise-dominated and hence unusable.
| Quadrant | # 1 sec bins | Bins with >0 counts | Bins with >2000 counts | High rate bins dominated by noise | Noise dominated (total time) | Noise dominated (detector-on time) | Marked lightcurve |
|---|---|---|---|---|---|---|---|
| A | 9045 | 6585 | 0 | 0 | 0.00% | 0.00% | 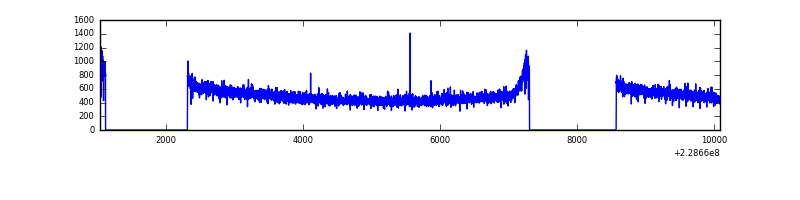 |
| B | 9045 | 6585 | 1 | 1 | 0.01% | 0.02% | 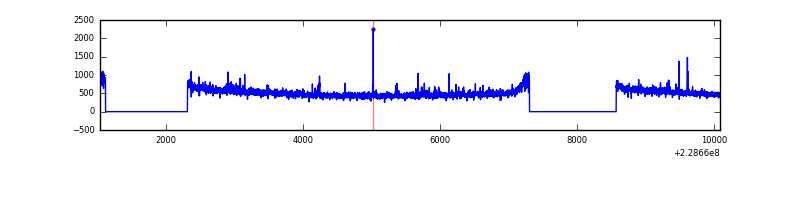 |
| C | 9045 | 6585 | 0 | 0 | 0.00% | 0.00% |  |
| D | 9045 | 6586 | 132 | 132 | 1.46% | 2.00% | 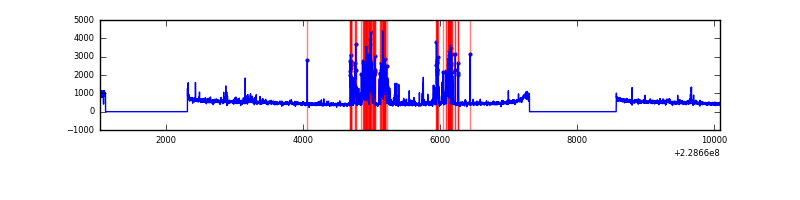 |
Top three noisy pixels from each quadrant. If the there are fewer than three noisy pixels in the level2.evt file, extra rows are filled as -1
| Pixel properties | Quadrant properties | ||||||
|---|---|---|---|---|---|---|---|
| Quadrant | DetID | PixID | Counts | Sigma | Mean | Median | Sigma |
| A | 0 | 226 | 8169 | 42.69 | 855 | 839 | 171.7 |
| A | 12 | 194 | 7679 | 39.84 | 855 | 839 | 171.7 |
| A | 8 | 15 | 4550 | 21.61 | 855 | 839 | 171.7 |
| B | 0 | 214 | 23751 | 142.14 | 859 | 841 | 161.2 |
| B | 4 | 81 | 19417 | 115.25 | 859 | 841 | 161.2 |
| B | 12 | 111 | 17116 | 100.98 | 859 | 841 | 161.2 |
| C | 1 | 16 | 142171 | 746.12 | 825 | 829 | 189.4 |
| C | 13 | 61 | 6322 | 29.0 | 825 | 829 | 189.4 |
| C | 12 | 4 | 2110 | 6.76 | 825 | 829 | 189.4 |
| D | 12 | 233 | 773548 | 3564.88 | 813 | 796 | 216.8 |
| D | 1 | 52 | 57777 | 262.87 | 813 | 796 | 216.8 |
| D | 7 | 71 | 29059 | 130.38 | 813 | 796 | 216.8 |
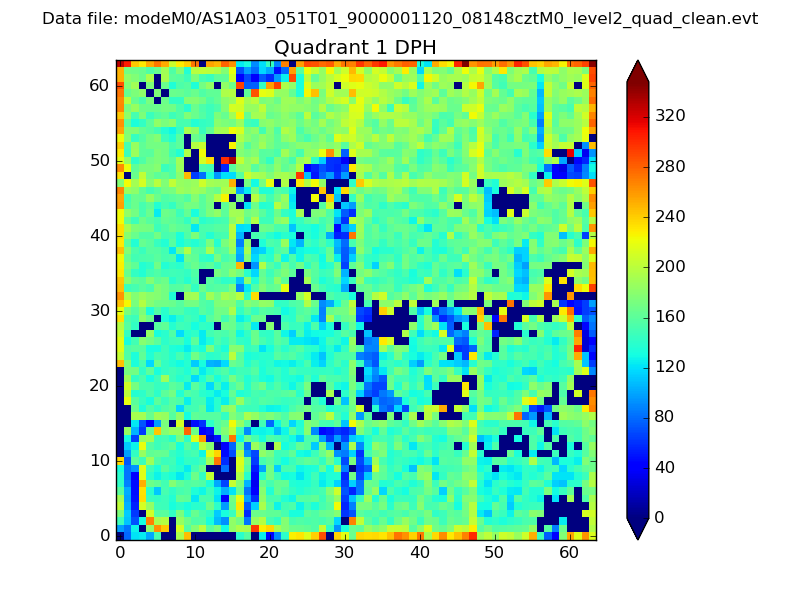
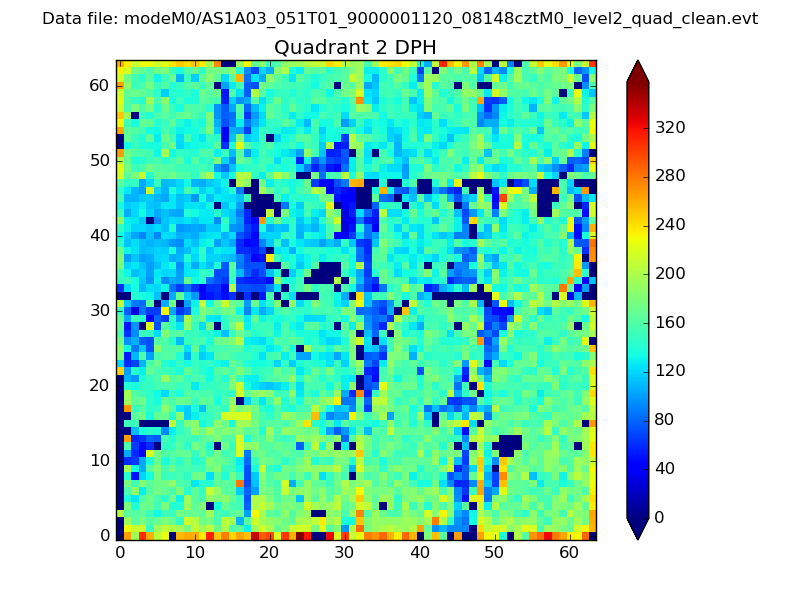
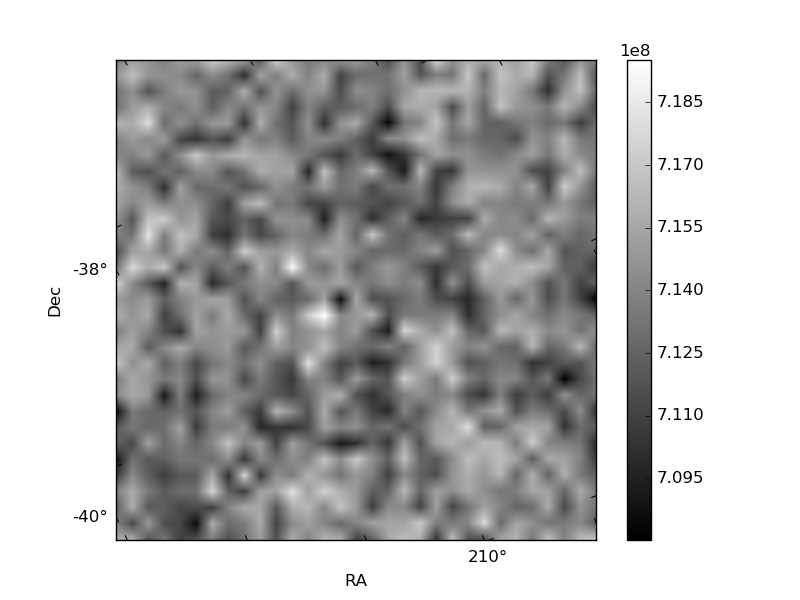
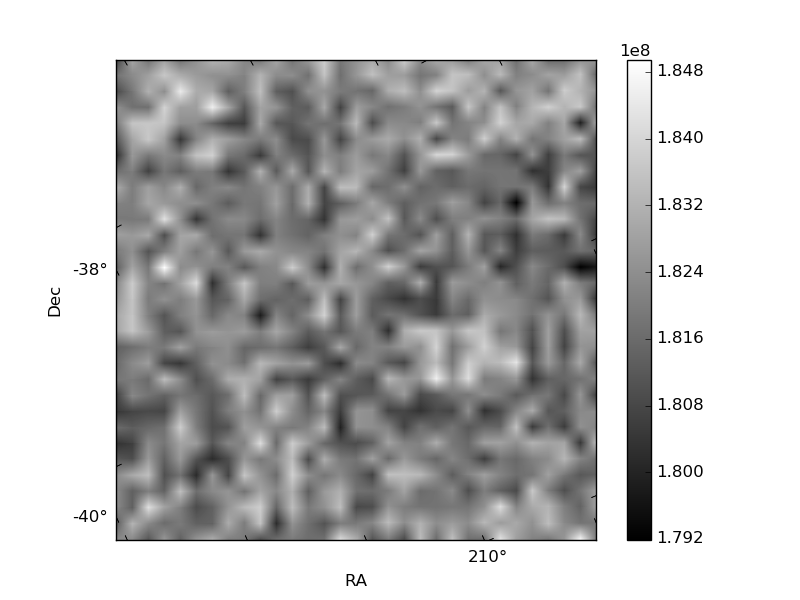
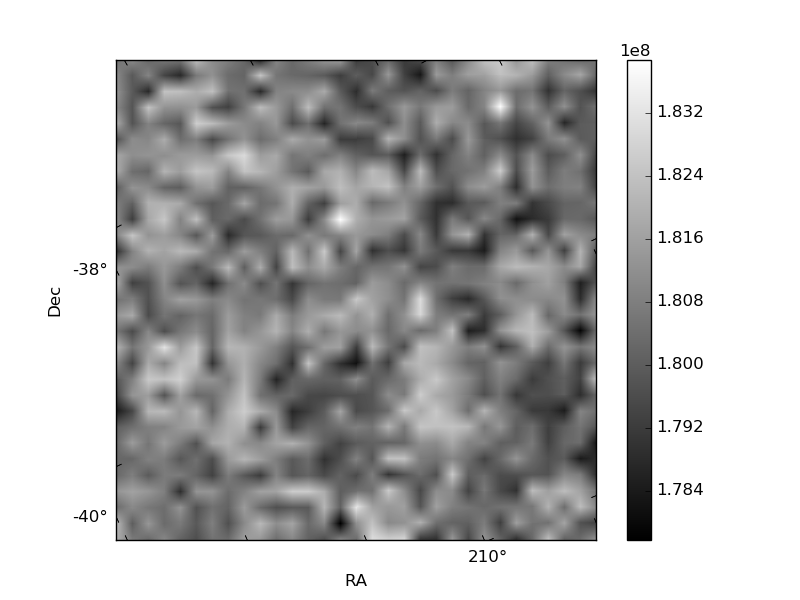
Histogram calculated using DETX and DETY for each event in the final _common_clean file
| Quadrant A | 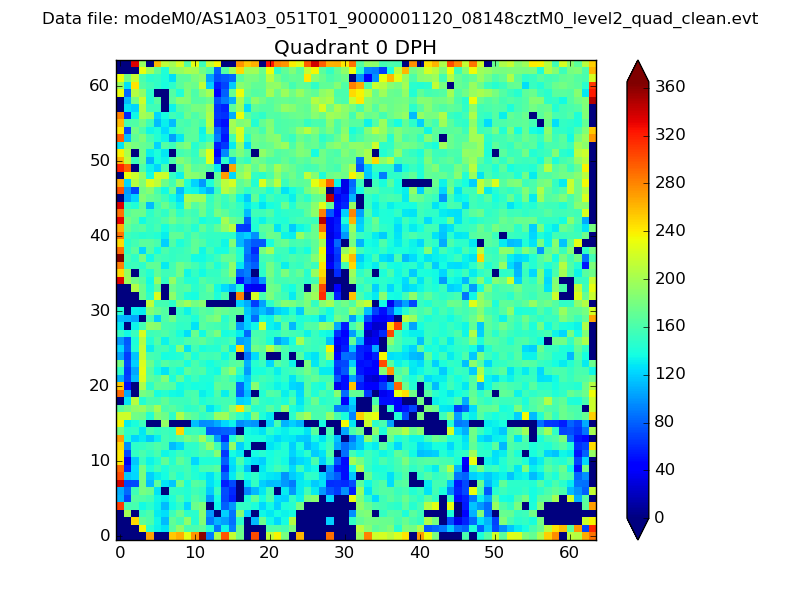 |
 |
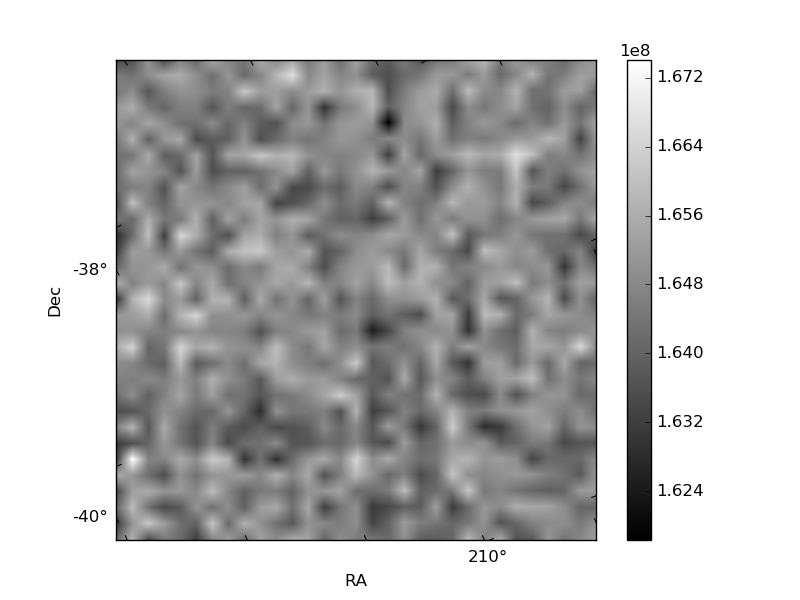
Quadrant B |
|---|---|---|---|
| Quadrant D | 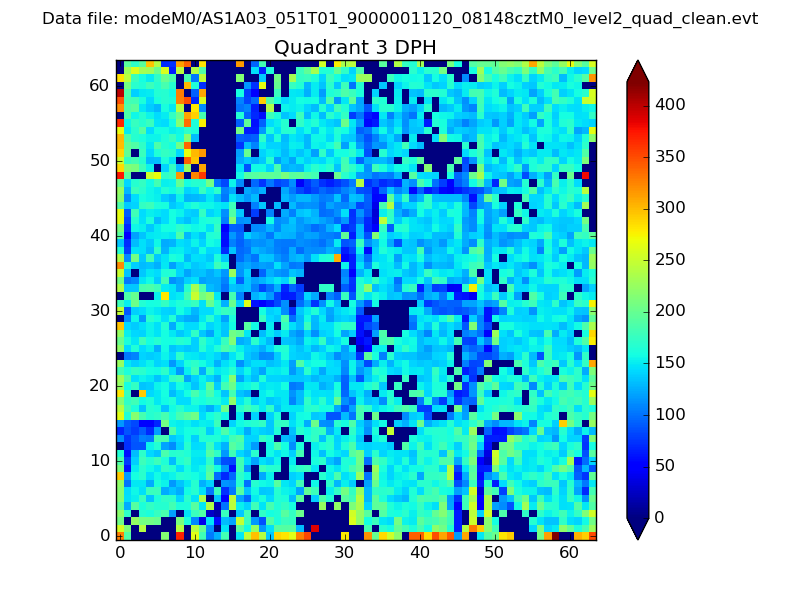 |
 |
Quadrant C |
| Plot type | Count rate plots | Images |
|---|---|---|
| Comparison with Poisson distribution Blue bars denote a histogram of data divided into 1 sec bins. Red curve is a Poisson curve with rate = median count rate of data. |
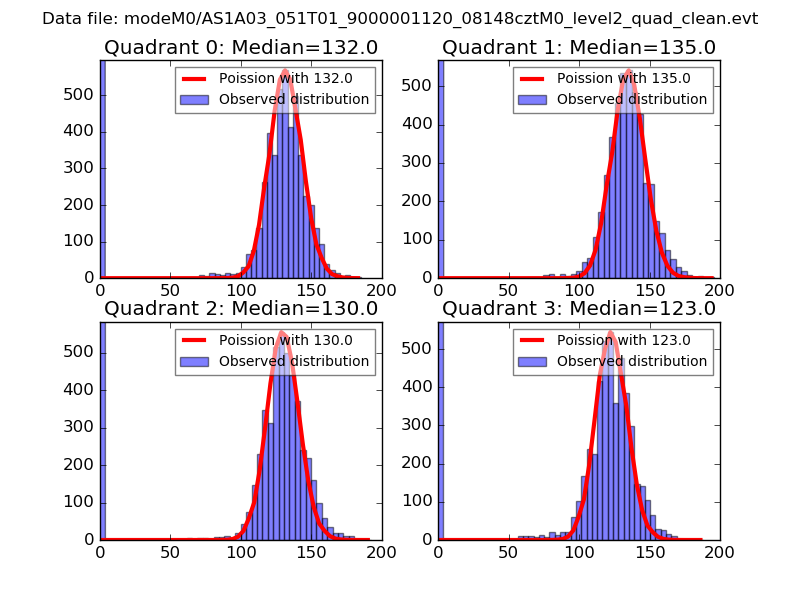 |
 |
| Quadrant-wise count rates Data is divided into 100 sec bins |
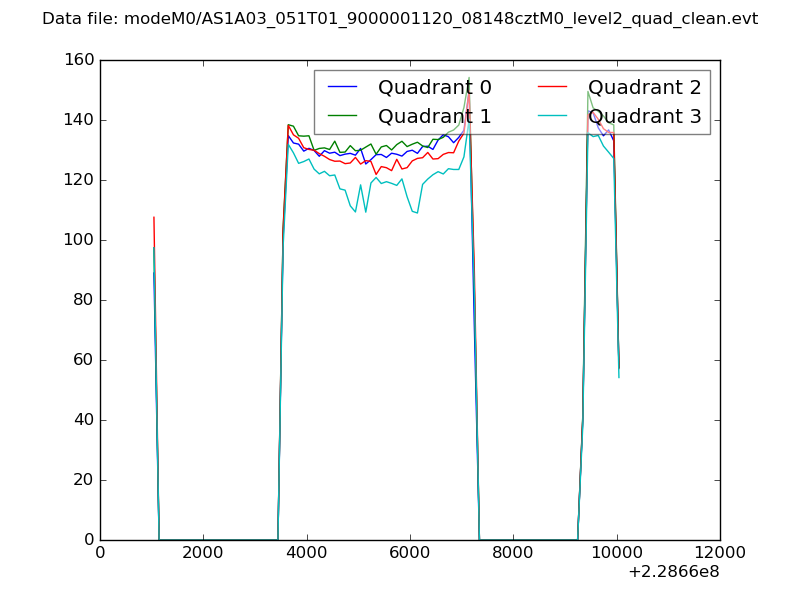 |
|
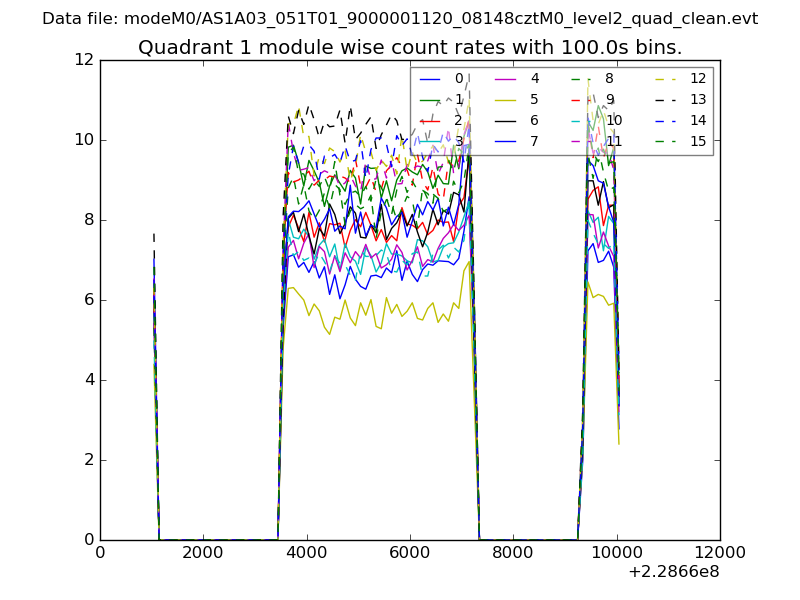
| Module-wise count rates for Quadrant A Data is divided into 100 sec bins |
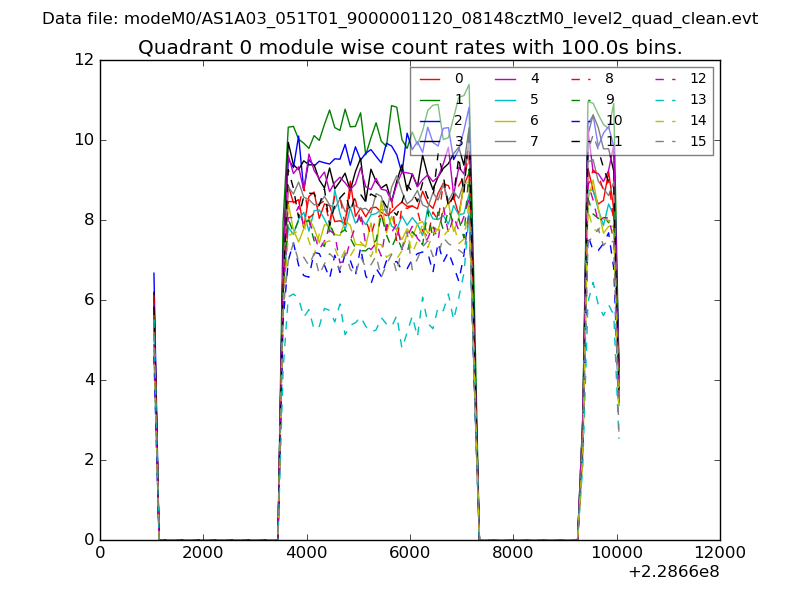 |
 |
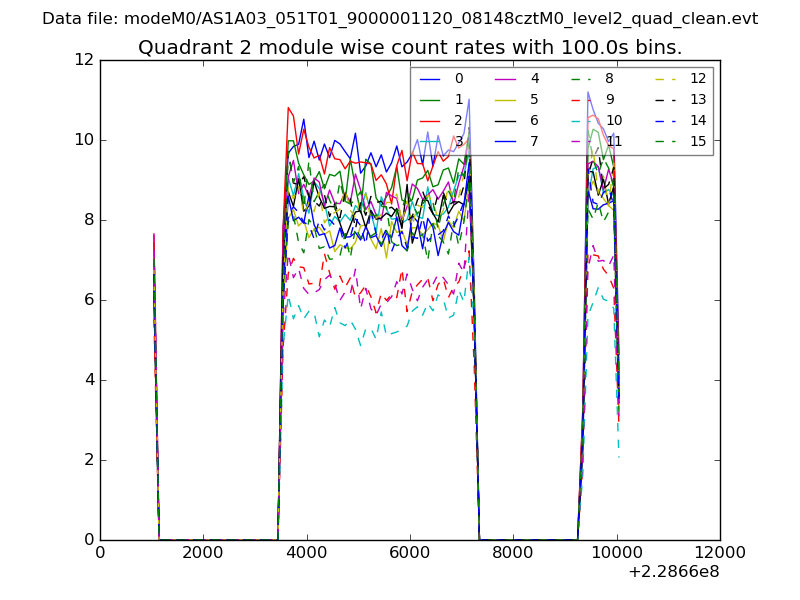
| Module-wise count rates for Quadrant B Data is divided into 100 sec bins |
 |
 |
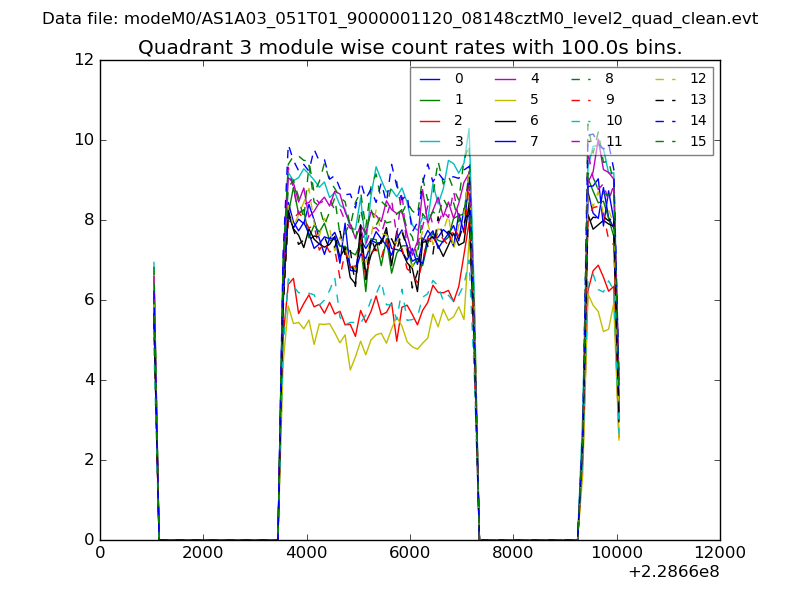
| Module-wise count rates for Quadrant C Data is divided into 100 sec bins |
 |
 |
| Module-wise count rates for Quadrant D Data is divided into 100 sec bins |
 |
 |
| Parameter | Plot |
|---|---|
| CZT HV Monitor | 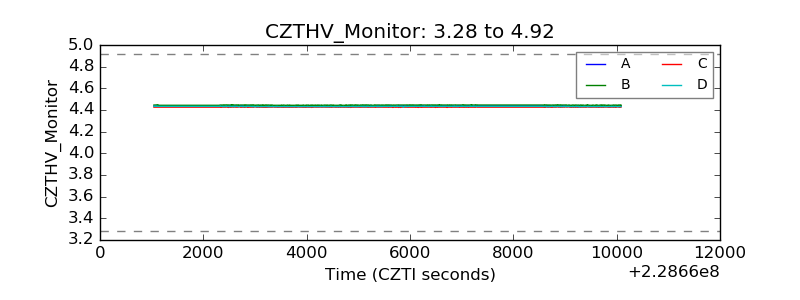 |
| D_VDD | 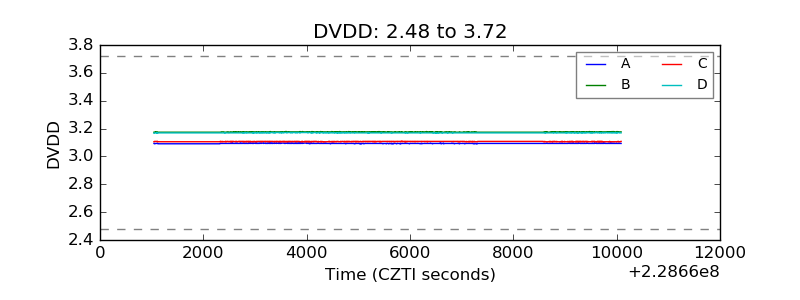 |
| Temperature 1 |  |
| Veto HV Monitor | 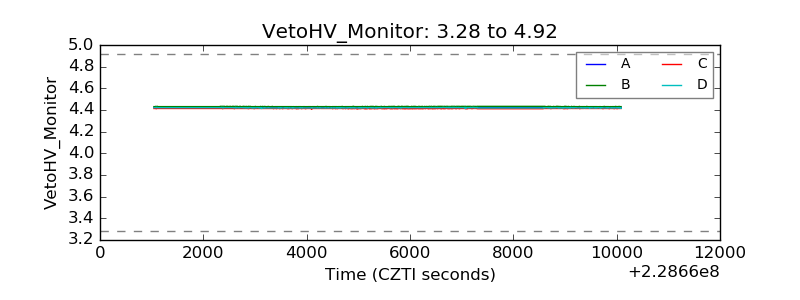 |
| Veto LLD | 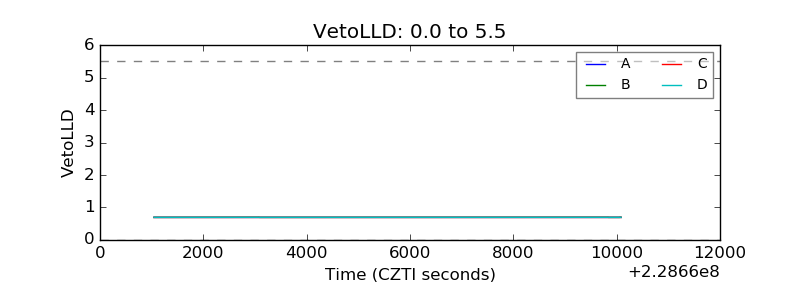 |
| Alpha Counter | 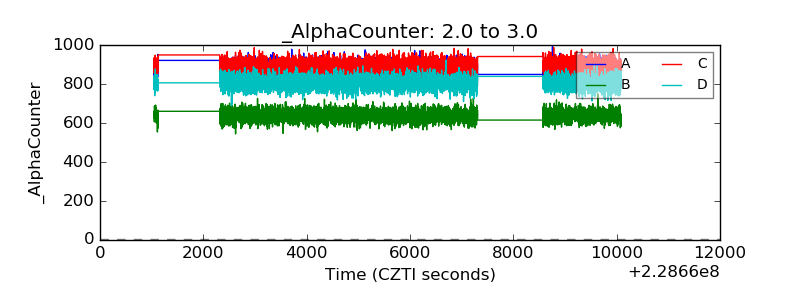 |
| _CPM_Rate | 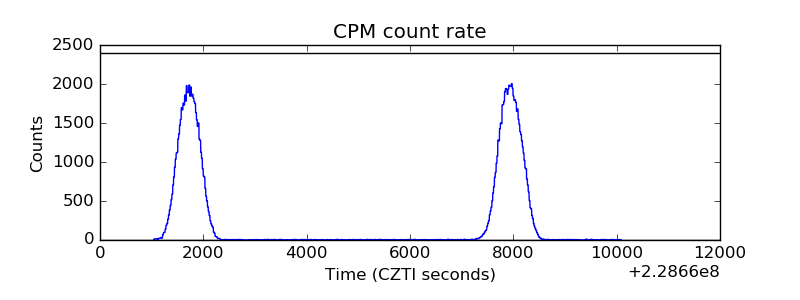 |
| CZT Counter | 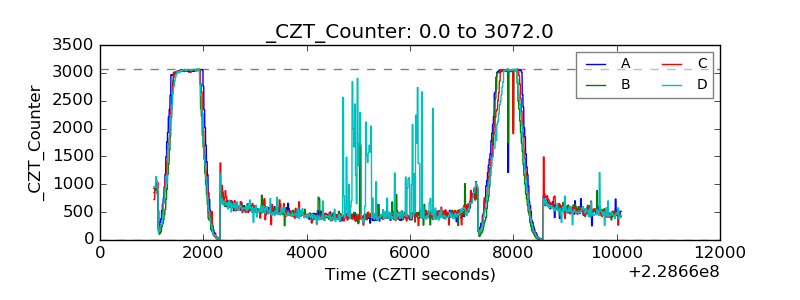 |
| +2.5 Volts monitor |  |
| +5 Volts monitor | 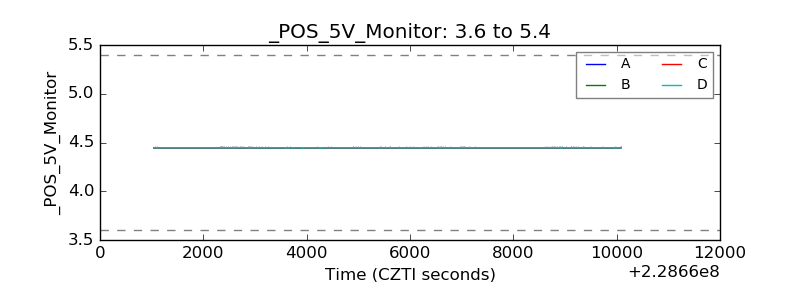 |
| _ROLL_ROT | 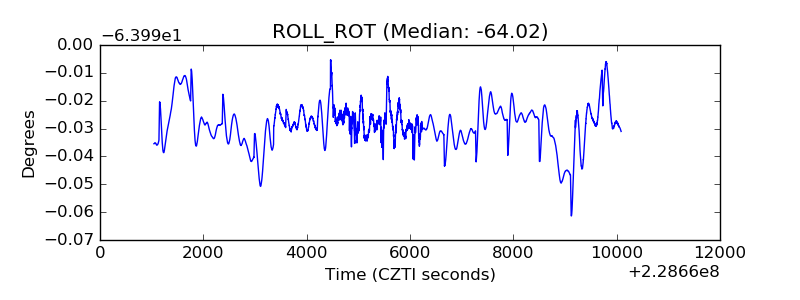 |
| _Roll_DEC | 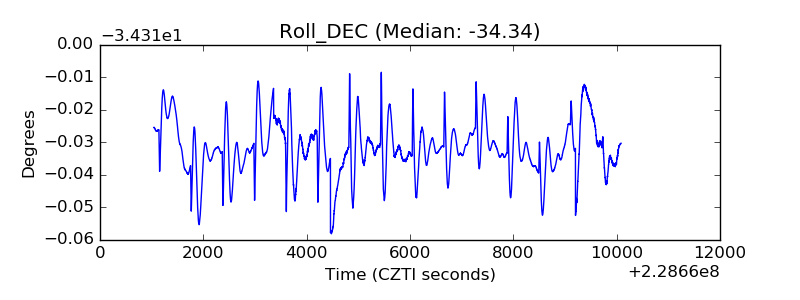 |
| _Roll_RA | 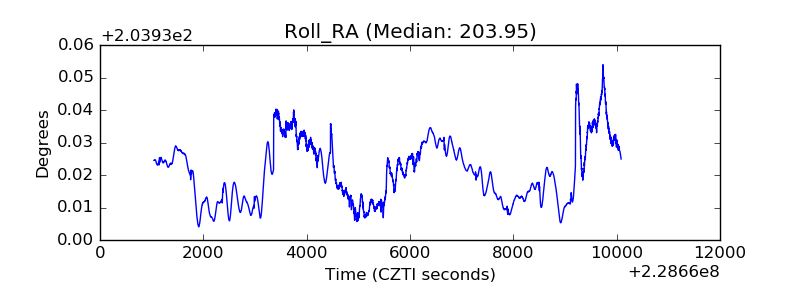 |
| Veto Counter | 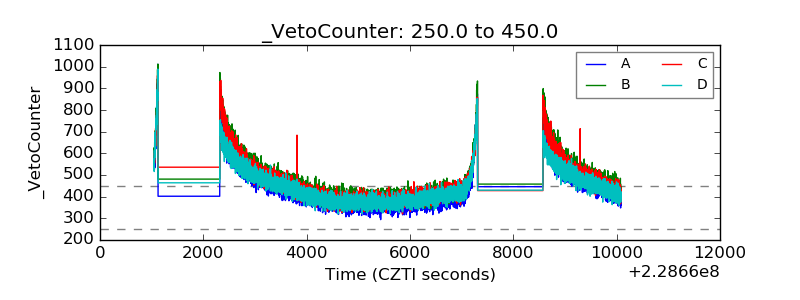 |