| Param | Original file | Final file |
|---|---|---|
| Filename | modeM0/AS1G06_028T01_9000001122cztM0_level2.fits | modeM0/AS1G06_028T01_9000001122cztM0_level2_quad_clean.evt |
| Size (bytes) | 235,739,520 | 253,175,040 |
| Size | 224.8 MB | 241.4 MB |
| Events in quadrant A | 1,430,732 | 1,551,995 |
| Events in quadrant B | 1,367,460 | 1,502,243 |
| Events in quadrant C | 1,417,244 | 1,526,199 |
| Events in quadrant D | 1,231,406 | 1,394,697 |
| Mode M0 | |||
|---|---|---|---|
| Quadrant | BADHDUFLAG | Total packets | Discarded packets |
| A | 0 | 51131 | 0 |
| B | 0 | 57061 | 0 |
| C | 0 | 52460 | 0 |
| D | 0 | 55423 | 0 |
| Mode SS | |||
|---|---|---|---|
| Quadrant | BADHDUFLAG | Total packets | Discarded packets |
| A | 0 | 502 | 0 |
| B | 0 | 502 | 0 |
| C | 0 | 502 | 0 |
| D | 0 | 502 | 0 |
| Mode M9 | |||
|---|---|---|---|
| Quadrant | BADHDUFLAG | Total packets | Discarded packets |
| A | 0 | 42 | 0 |
| B | 0 | 42 | 0 |
| C | 0 | 42 | 0 |
| D | 0 | 42 | 0 |
| Quadrant | Total seconds | Saturated seconds | Saturation percentage |
|---|---|---|---|
| A | 24601 | 330 | 1.341409% |
| B | 24601 | 924 | 3.755945% |
| C | 24601 | 312 | 1.268241% |
| D | 24601 | 390 | 1.585301% |
Noise dominated data is calculated using 1-second bins in cleaned event files. If a bin has >2000 counts, and if more than 50% of those come from <1% of pixels, then it is considered to be noise-dominated and hence unusable.
| Quadrant | # 1 sec bins | Bins with >0 counts | Bins with >2000 counts | High rate bins dominated by noise | Noise dominated (total time) | Noise dominated (detector-on time) | Marked lightcurve |
|---|---|---|---|---|---|---|---|
| A | 28716 | 24601 | 0 | 0 | 0.00% | 0.00% |  |
| B | 28716 | 24599 | 0 | 0 | 0.00% | 0.00% |  |
| C | 28716 | 24600 | 0 | 0 | 0.00% | 0.00% |  |
| D | 28716 | 24601 | 0 | 0 | 0.00% | 0.00% |  |
Top three noisy pixels from each quadrant. If the there are fewer than three noisy pixels in the level2.evt file, extra rows are filled as -1
| Pixel properties | Quadrant properties | ||||||
|---|---|---|---|---|---|---|---|
| Quadrant | DetID | PixID | Counts | Sigma | Mean | Median | Sigma |
| A | 14 | 188 | 1452 | 11.67 | 370 | 347 | 94.7 |
| A | 0 | 29 | 1396 | 11.08 | 370 | 347 | 94.7 |
| A | 14 | 204 | 1207 | 9.08 | 370 | 347 | 94.7 |
| B | 2 | 9 | 1125 | 10.53 | 360 | 343 | 74.2 |
| B | 12 | 226 | 917 | 7.73 | 360 | 343 | 74.2 |
| B | 3 | 80 | 915 | 7.71 | 360 | 343 | 74.2 |
| C | 12 | 241 | 964 | 6.18 | 374 | 348 | 99.7 |
| C | 2 | 191 | 951 | 6.05 | 374 | 348 | 99.7 |
| C | 9 | 233 | 942 | 5.95 | 374 | 348 | 99.7 |
| D | 4 | 246 | 984 | 7.1 | 350 | 318 | 93.8 |
| D | 1 | 19 | 899 | 6.19 | 350 | 318 | 93.8 |
| D | 6 | 231 | 878 | 5.97 | 350 | 318 | 93.8 |
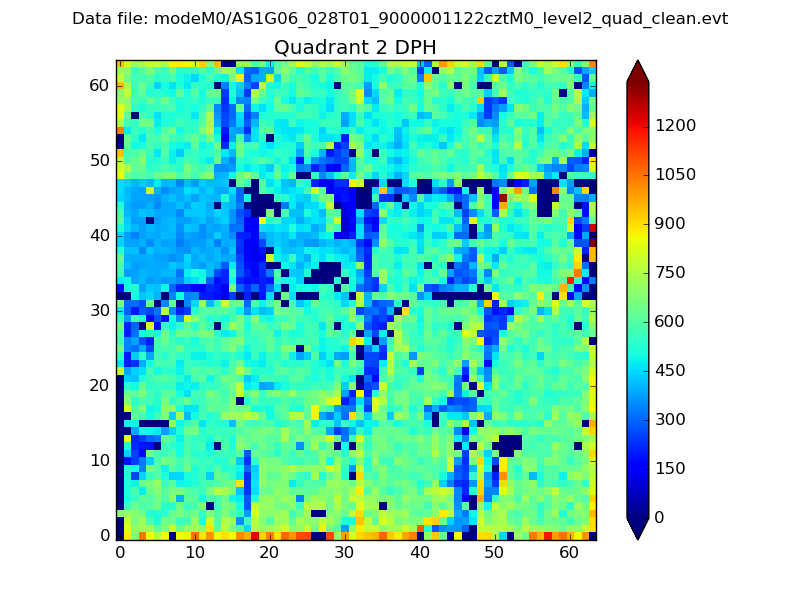
Histogram calculated using DETX and DETY for each event in the final _common_clean file
| Quadrant A |  |
 |
Quadrant B |
|---|---|---|---|
| Quadrant D |  |
 |
Quadrant C |
| Plot type | Count rate plots | Images |
|---|---|---|
| Comparison with Poisson distribution Blue bars denote a histogram of data divided into 1 sec bins. Red curve is a Poisson curve with rate = median count rate of data. |
 |
 |
| Quadrant-wise count rates Data is divided into 100 sec bins |
 |
|
| Module-wise count rates for Quadrant A Data is divided into 100 sec bins |
 |
 |
| Module-wise count rates for Quadrant B Data is divided into 100 sec bins |
 |
 |
| Module-wise count rates for Quadrant C Data is divided into 100 sec bins |
 |
 |
| Module-wise count rates for Quadrant D Data is divided into 100 sec bins |
 |
 |
| Parameter | Plot |
|---|---|
| CZT HV Monitor |  |
| D_VDD | 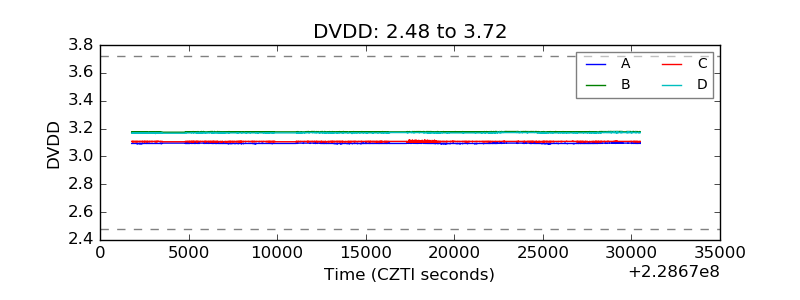 |
| Temperature 1 |  |
| Veto HV Monitor |  |
| Veto LLD |  |
| Alpha Counter |  |
| _CPM_Rate |  |
| CZT Counter |  |
| +2.5 Volts monitor |  |
| +5 Volts monitor |  |
| _ROLL_ROT |  |
| _Roll_DEC |  |
| _Roll_RA | 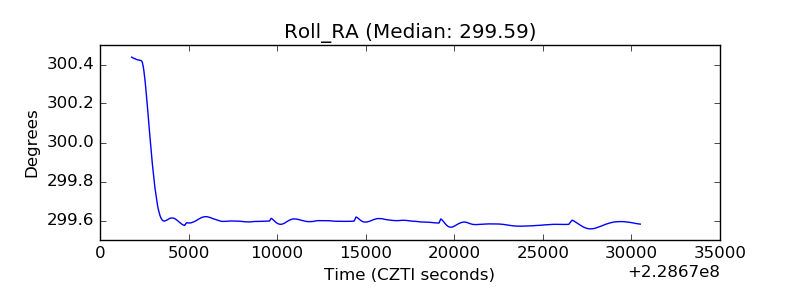 |
| Veto Counter |  |