| Param | Original file | Final file |
|---|---|---|
| Filename | modeM0/AS1G06_028T01_9000001122_08149cztM0_level2.evt | modeM0/AS1G06_028T01_9000001122_08149cztM0_level2_quad_clean.evt |
| Size (bytes) | 246,309,120 | 38,036,160 |
| Size | 234.9 MB | 36.3 MB |
| Events in quadrant A | 1,671,379 | 229,399 |
| Events in quadrant B | 1,773,993 | 232,541 |
| Events in quadrant C | 1,799,864 | 233,113 |
| Events in quadrant D | 1,989,952 | 223,511 |
| Mode M0 | |||
|---|---|---|---|
| Quadrant | BADHDUFLAG | Total packets | Discarded packets |
| A | 0 | 6953 | 2 |
| B | 0 | 7363 | 1 |
| C | 0 | 7601 | 1 |
| D | 0 | 8177 | 1 |
| Mode SS | |||
|---|---|---|---|
| Quadrant | BADHDUFLAG | Total packets | Discarded packets |
| A | 0 | 68 | 0 |
| B | 0 | 68 | 0 |
| C | 0 | 68 | 0 |
| D | 0 | 68 | 0 |
| Mode M9 | |||
|---|---|---|---|
| Quadrant | BADHDUFLAG | Total packets | Discarded packets |
| A | 0 | 13 | 0 |
| B | 0 | 13 | 0 |
| C | 0 | 13 | 0 |
| D | 0 | 13 | 0 |
| Quadrant | Total seconds | Saturated seconds | Saturation percentage |
|---|---|---|---|
| A | 3274 | 77 | 2.351863% |
| B | 3274 | 82 | 2.504582% |
| C | 3274 | 68 | 2.076970% |
| D | 3274 | 108 | 3.298717% |
Noise dominated data is calculated using 1-second bins in cleaned event files. If a bin has >2000 counts, and if more than 50% of those come from <1% of pixels, then it is considered to be noise-dominated and hence unusable.
| Quadrant | # 1 sec bins | Bins with >0 counts | Bins with >2000 counts | High rate bins dominated by noise | Noise dominated (total time) | Noise dominated (detector-on time) | Marked lightcurve |
|---|---|---|---|---|---|---|---|
| A | 4554 | 3275 | 0 | 0 | 0.00% | 0.00% | 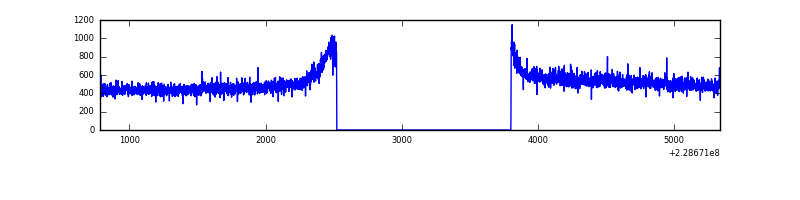 |
| B | 4554 | 3275 | 0 | 0 | 0.00% | 0.00% | 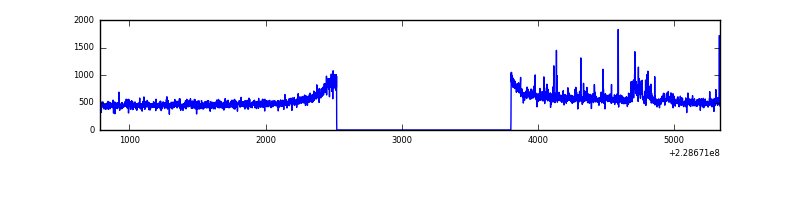 |
| C | 4554 | 3275 | 0 | 0 | 0.00% | 0.00% | 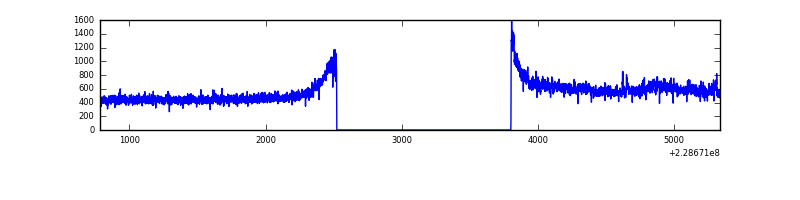 |
| D | 4554 | 3275 | 24 | 24 | 0.53% | 0.73% | 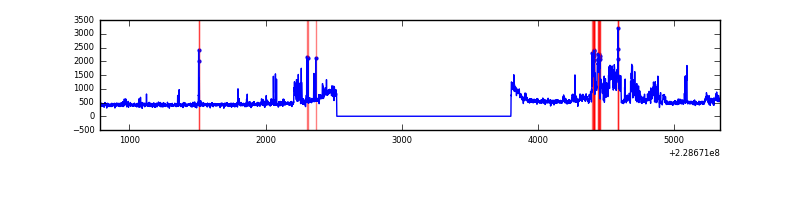 |
Top three noisy pixels from each quadrant. If the there are fewer than three noisy pixels in the level2.evt file, extra rows are filled as -1
| Pixel properties | Quadrant properties | ||||||
|---|---|---|---|---|---|---|---|
| Quadrant | DetID | PixID | Counts | Sigma | Mean | Median | Sigma |
| A | 0 | 226 | 4105 | 41.48 | 433 | 424 | 88.7 |
| A | 12 | 194 | 3933 | 39.54 | 433 | 424 | 88.7 |
| A | 13 | 254 | 2206 | 20.08 | 433 | 424 | 88.7 |
| B | 0 | 219 | 27360 | 320.84 | 434 | 425 | 84.0 |
| B | 0 | 213 | 24230 | 283.56 | 434 | 425 | 84.0 |
| B | 4 | 173 | 10371 | 118.47 | 434 | 425 | 84.0 |
| C | 1 | 16 | 158401 | 1617.58 | 420 | 423 | 97.7 |
| C | 13 | 61 | 3260 | 29.05 | 420 | 423 | 97.7 |
| C | 14 | 234 | 1220 | 8.16 | 420 | 423 | 97.7 |
| D | 1 | 52 | 293108 | 2836.57 | 418 | 408 | 103.2 |
| D | 2 | 136 | 53935 | 518.73 | 418 | 408 | 103.2 |
| D | 7 | 71 | 31495 | 301.27 | 418 | 408 | 103.2 |
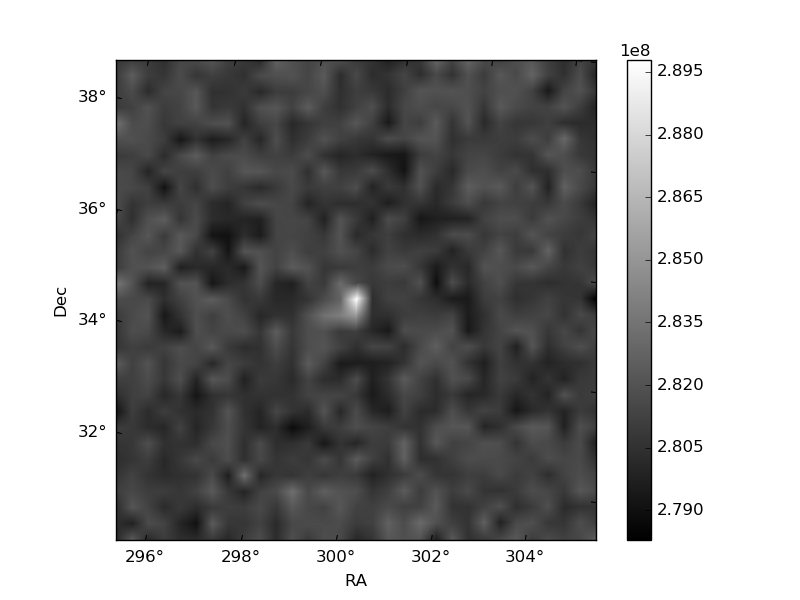
Histogram calculated using DETX and DETY for each event in the final _common_clean file
| Quadrant A | 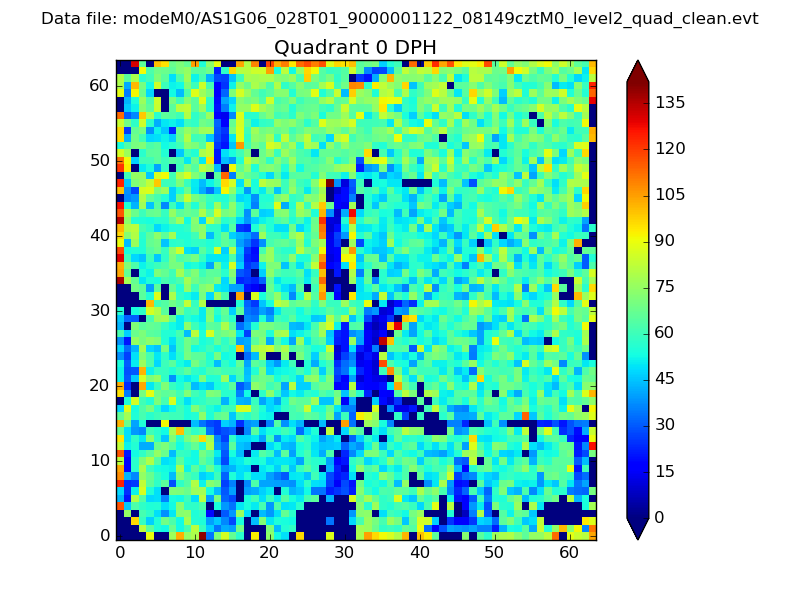 |
 |
Quadrant B |
|---|---|---|---|
| Quadrant D | 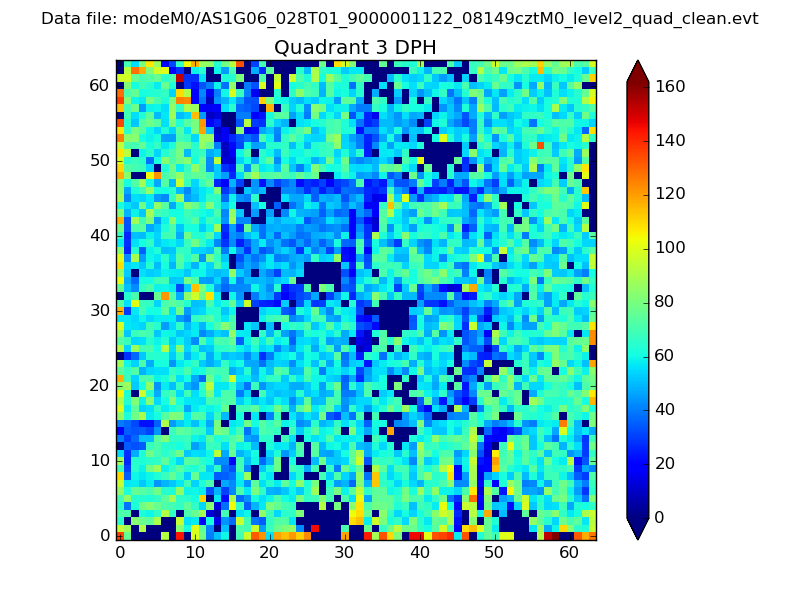 |
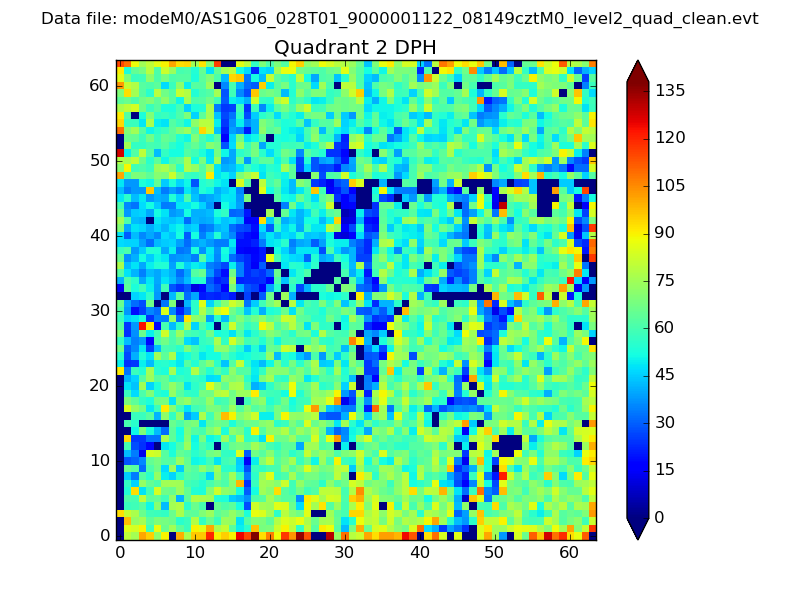 |
Quadrant C |
| Plot type | Count rate plots | Images |
|---|---|---|
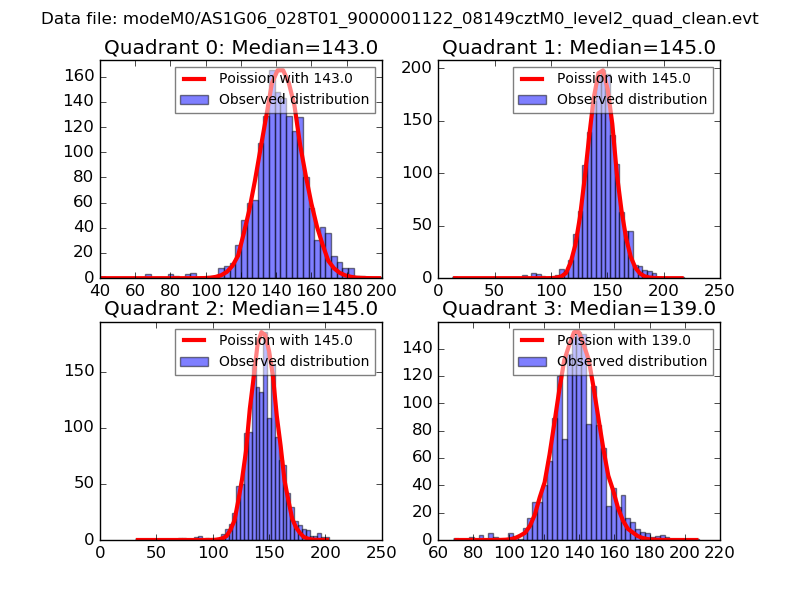
| Comparison with Poisson distribution Blue bars denote a histogram of data divided into 1 sec bins. Red curve is a Poisson curve with rate = median count rate of data. |
 |
 |
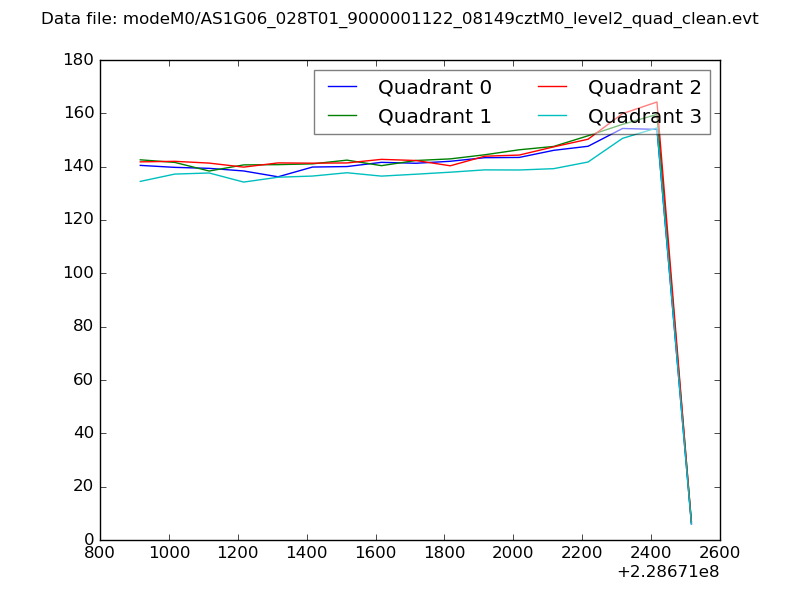
| Quadrant-wise count rates Data is divided into 100 sec bins |
 |
|
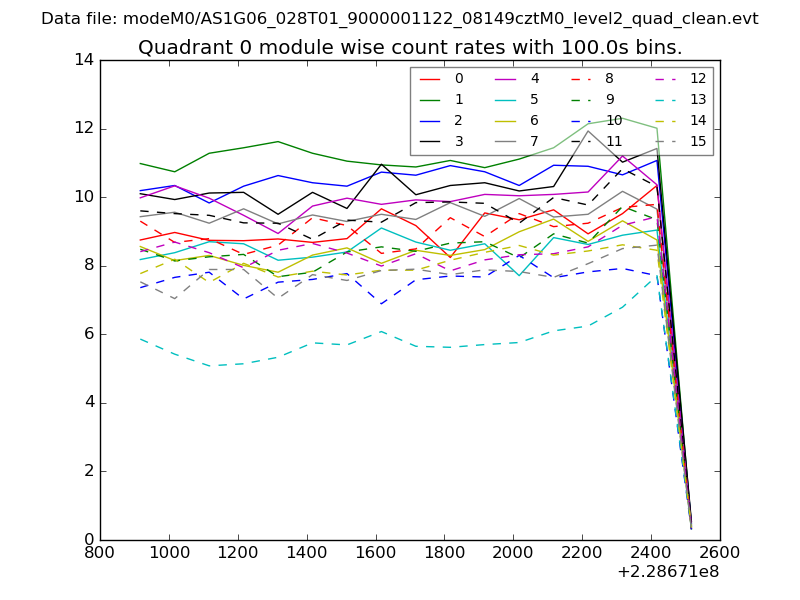
| Module-wise count rates for Quadrant A Data is divided into 100 sec bins |
 |
 |
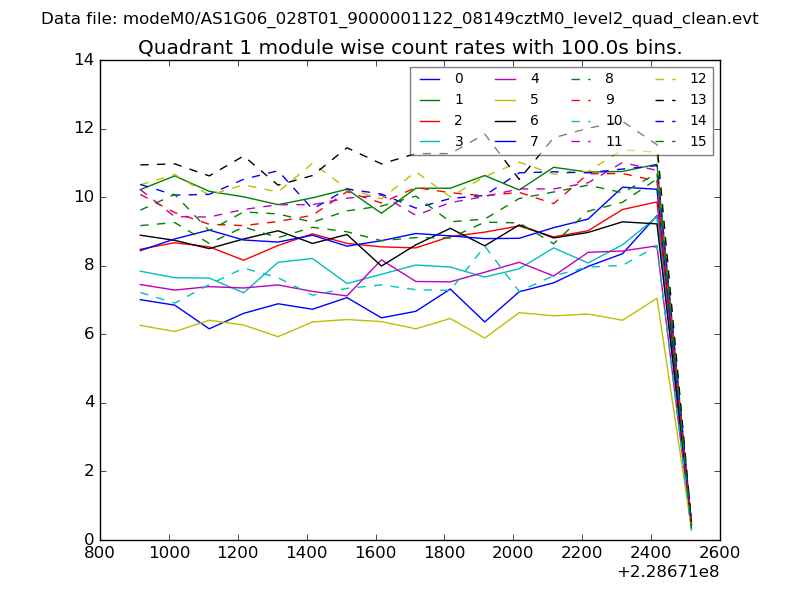
| Module-wise count rates for Quadrant B Data is divided into 100 sec bins |
 |
 |
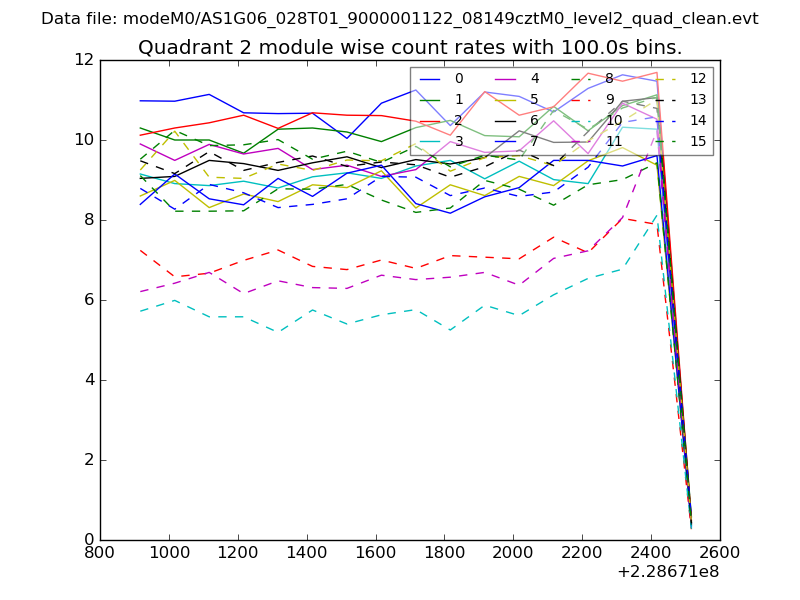
| Module-wise count rates for Quadrant C Data is divided into 100 sec bins |
 |
 |
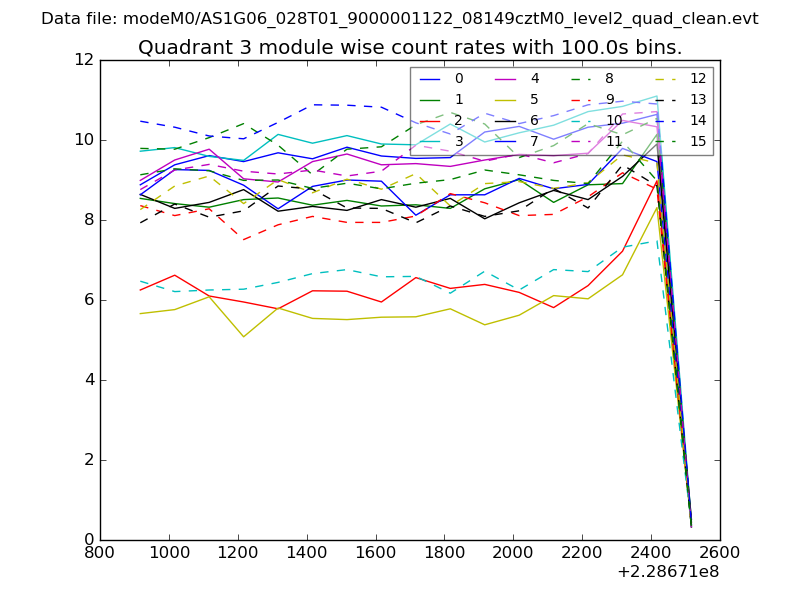
| Module-wise count rates for Quadrant D Data is divided into 100 sec bins |
 |
 |
| Parameter | Plot |
|---|---|
| CZT HV Monitor | 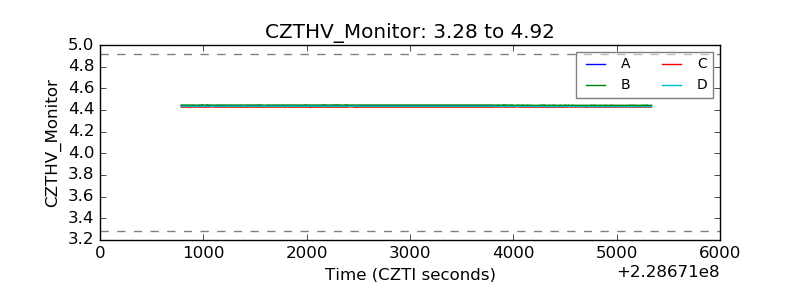 |
| D_VDD | 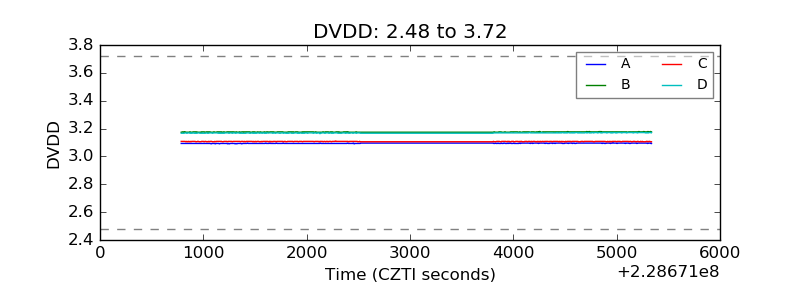 |
| Temperature 1 | 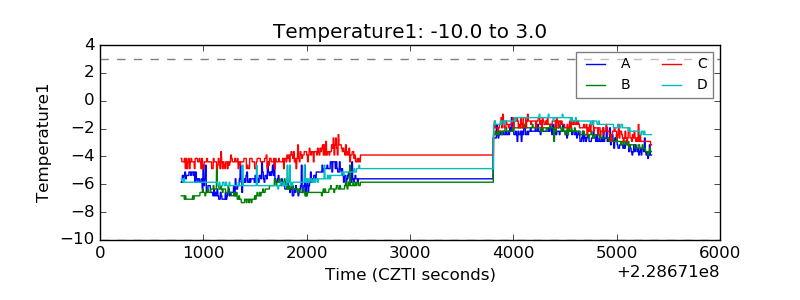 |
| Veto HV Monitor | 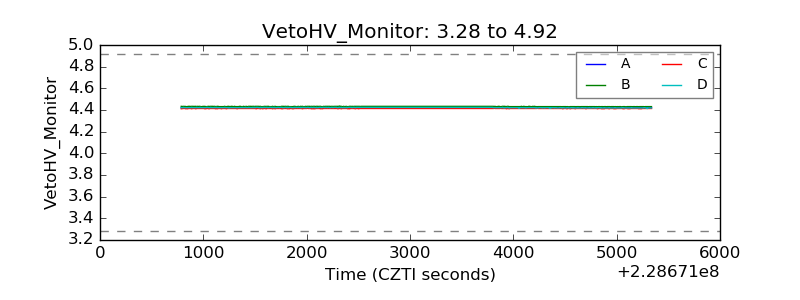 |
| Veto LLD | 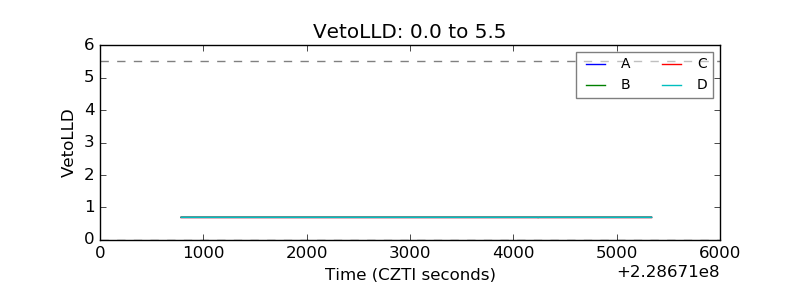 |
| Alpha Counter | 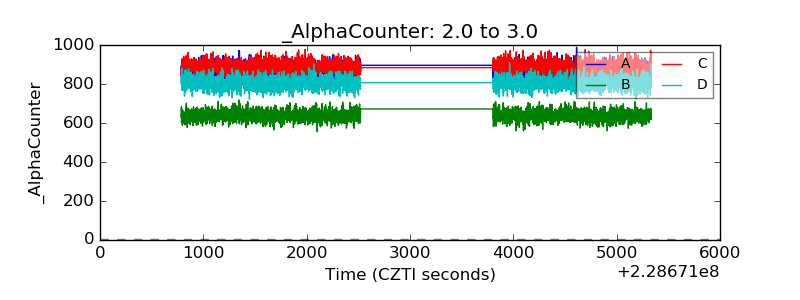 |
| _CPM_Rate | 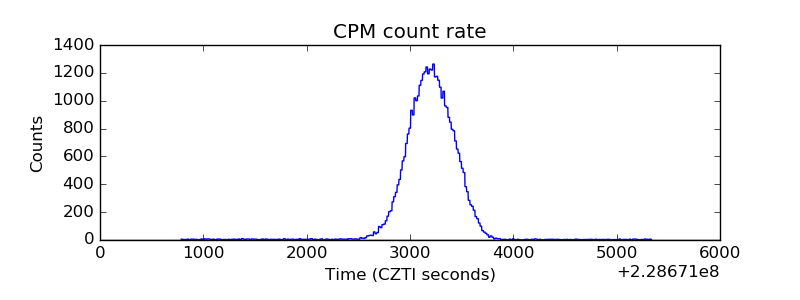 |
| CZT Counter | 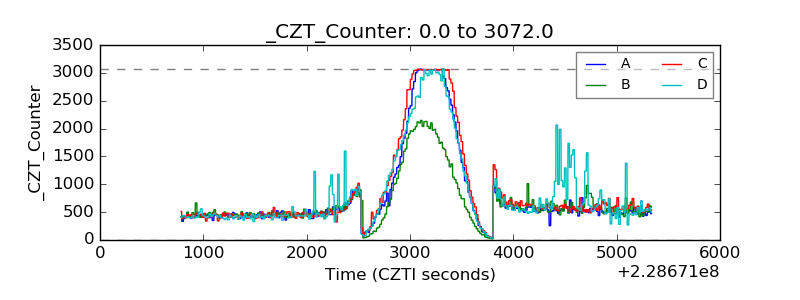 |
| +2.5 Volts monitor | 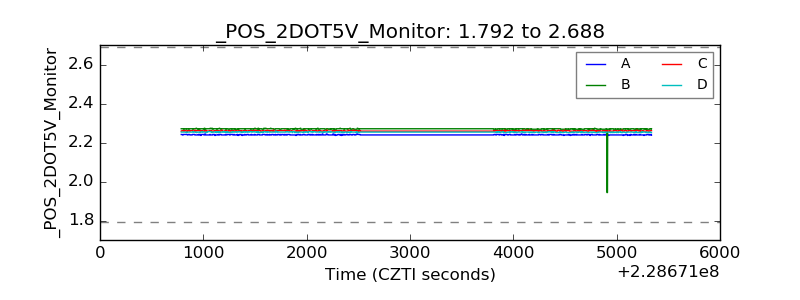 |
| +5 Volts monitor |  |
| _ROLL_ROT | 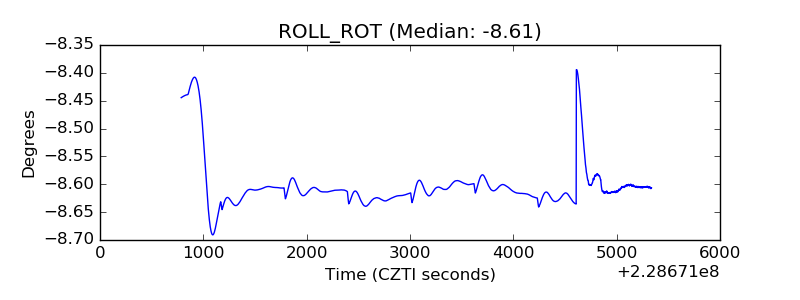 |
| _Roll_DEC | 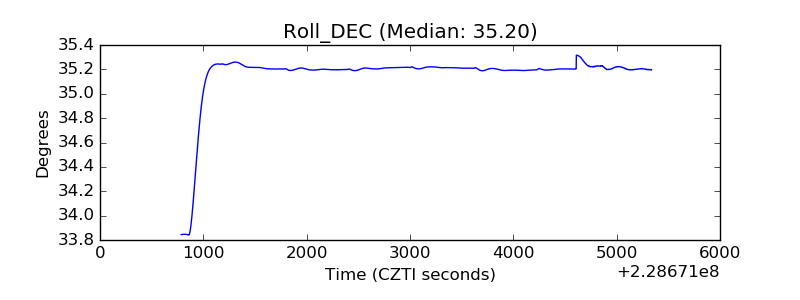 |
| _Roll_RA |  |
| Veto Counter | 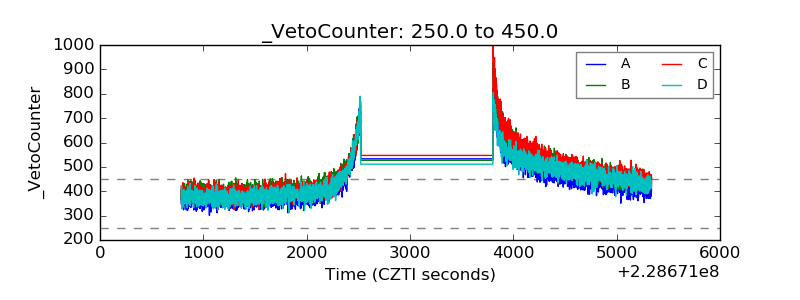 |