| Param | Original file | Final file |
|---|---|---|
| Filename | modeM0/AS1G06_028T01_9000001122_08150cztM0_level2.evt | modeM0/AS1G06_028T01_9000001122_08150cztM0_level2_quad_clean.evt |
| Size (bytes) | 479,514,240 | 73,647,360 |
| Size | 457.3 MB | 70.2 MB |
| Events in quadrant A | 3,243,760 | 443,641 |
| Events in quadrant B | 3,489,609 | 448,772 |
| Events in quadrant C | 3,477,487 | 452,714 |
| Events in quadrant D | 3,870,191 | 431,999 |
| Mode M0 | |||
|---|---|---|---|
| Quadrant | BADHDUFLAG | Total packets | Discarded packets |
| A | 0 | 13684 | 3 |
| B | 0 | 14572 | 2 |
| C | 0 | 14634 | 2 |
| D | 0 | 15957 | 2 |
| Mode SS | |||
|---|---|---|---|
| Quadrant | BADHDUFLAG | Total packets | Discarded packets |
| A | 0 | 130 | 0 |
| B | 0 | 130 | 0 |
| C | 0 | 130 | 0 |
| D | 0 | 130 | 0 |
| Mode M9 | |||
|---|---|---|---|
| Quadrant | BADHDUFLAG | Total packets | Discarded packets |
| A | 0 | 17 | 0 |
| B | 0 | 17 | 0 |
| C | 0 | 17 | 0 |
| D | 0 | 18 | 0 |
| Quadrant | Total seconds | Saturated seconds | Saturation percentage |
|---|---|---|---|
| A | 6498 | 124 | 1.908279% |
| B | 6498 | 145 | 2.231456% |
| C | 6498 | 136 | 2.092952% |
| D | 6498 | 154 | 2.369960% |
Noise dominated data is calculated using 1-second bins in cleaned event files. If a bin has >2000 counts, and if more than 50% of those come from <1% of pixels, then it is considered to be noise-dominated and hence unusable.
| Quadrant | # 1 sec bins | Bins with >0 counts | Bins with >2000 counts | High rate bins dominated by noise | Noise dominated (total time) | Noise dominated (detector-on time) | Marked lightcurve |
|---|---|---|---|---|---|---|---|
| A | 7663 | 6499 | 0 | 0 | 0.00% | 0.00% |  |
| B | 7663 | 6499 | 1 | 1 | 0.01% | 0.02% | 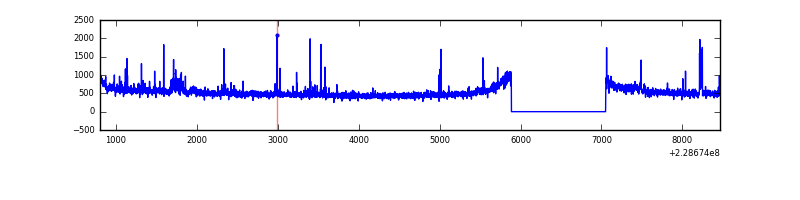 |
| C | 7663 | 6498 | 0 | 0 | 0.00% | 0.00% | 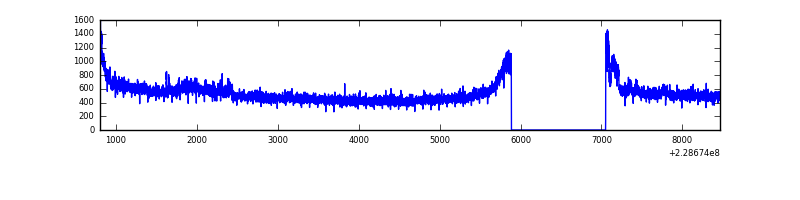 |
| D | 7663 | 6499 | 25 | 25 | 0.33% | 0.38% | 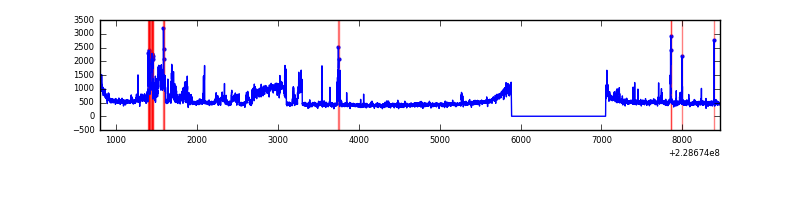 |
Top three noisy pixels from each quadrant. If the there are fewer than three noisy pixels in the level2.evt file, extra rows are filled as -1
| Pixel properties | Quadrant properties | ||||||
|---|---|---|---|---|---|---|---|
| Quadrant | DetID | PixID | Counts | Sigma | Mean | Median | Sigma |
| A | 0 | 226 | 7982 | 41.78 | 839 | 821 | 171.4 |
| A | 12 | 194 | 7511 | 39.03 | 839 | 821 | 171.4 |
| A | 13 | 251 | 6679 | 34.18 | 839 | 821 | 171.4 |
| B | 0 | 219 | 77759 | 482.98 | 841 | 824 | 159.3 |
| B | 0 | 213 | 47017 | 289.99 | 841 | 824 | 159.3 |
| B | 10 | 16 | 29898 | 182.52 | 841 | 824 | 159.3 |
| C | 1 | 16 | 283410 | 1500.3 | 819 | 824 | 188.4 |
| C | 13 | 61 | 6293 | 29.04 | 819 | 824 | 188.4 |
| C | 3 | 202 | 2065 | 6.59 | 819 | 824 | 188.4 |
| D | 1 | 52 | 661069 | 3102.81 | 814 | 796 | 212.8 |
| D | 7 | 71 | 40737 | 187.69 | 814 | 796 | 212.8 |
| D | 5 | 233 | 26607 | 121.29 | 814 | 796 | 212.8 |
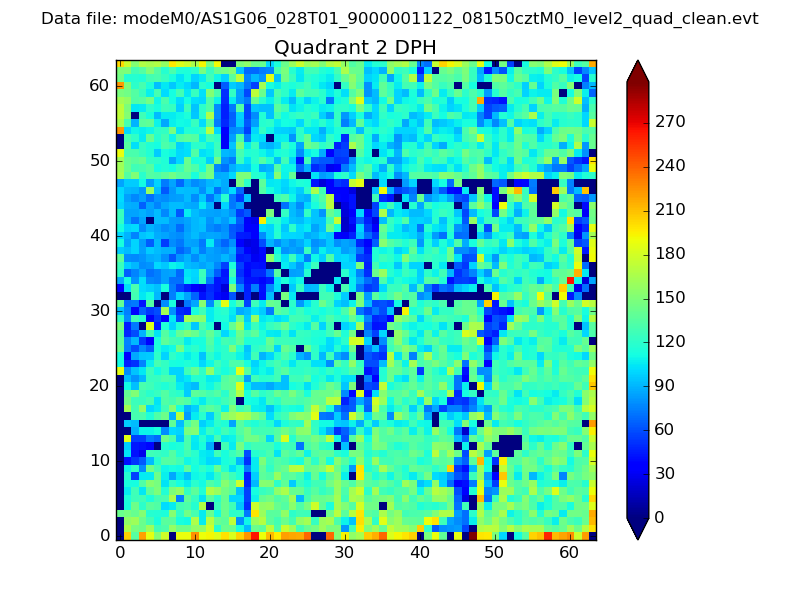
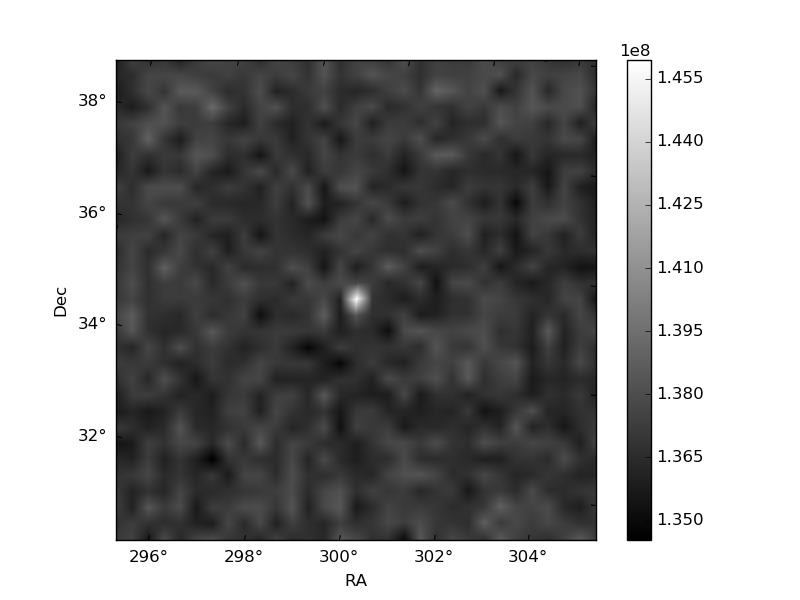
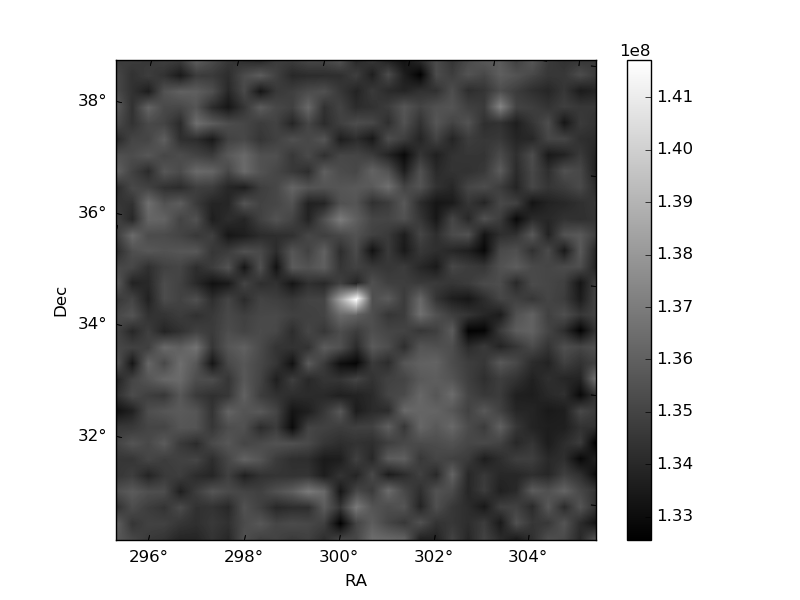
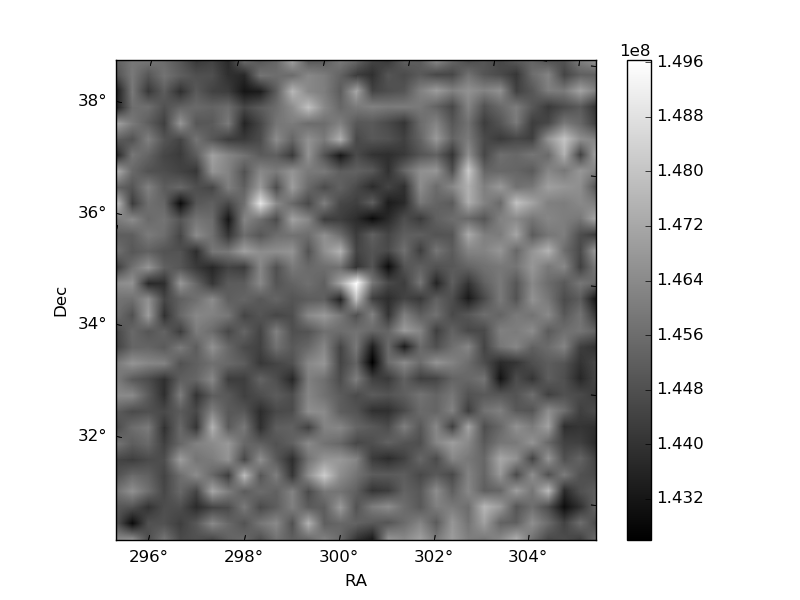
Histogram calculated using DETX and DETY for each event in the final _common_clean file
| Quadrant A | 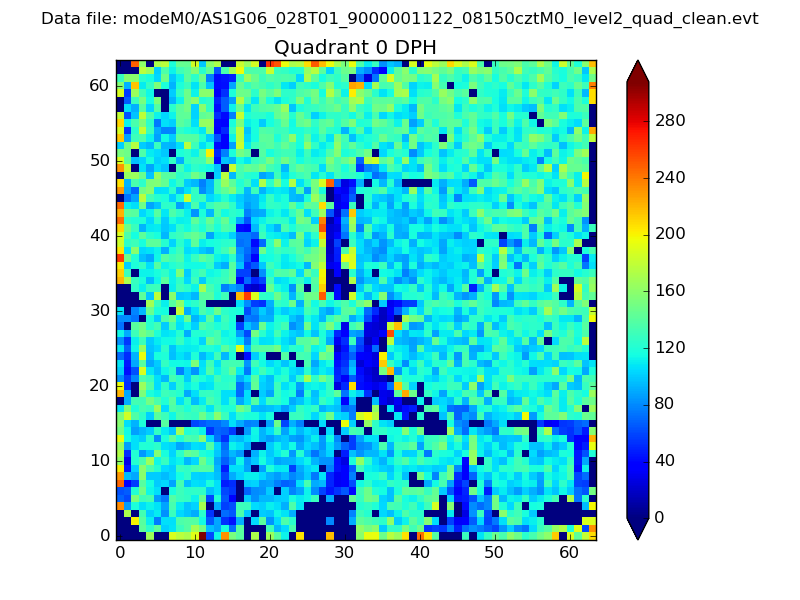 |
 |
Quadrant B |
|---|---|---|---|
| Quadrant D | 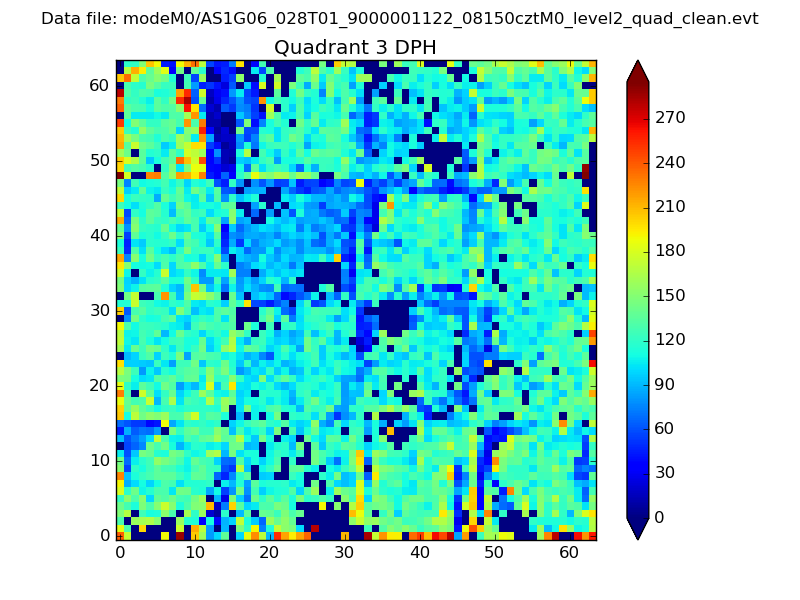 |
 |
Quadrant C |
| Plot type | Count rate plots | Images |
|---|---|---|
| Comparison with Poisson distribution Blue bars denote a histogram of data divided into 1 sec bins. Red curve is a Poisson curve with rate = median count rate of data. |
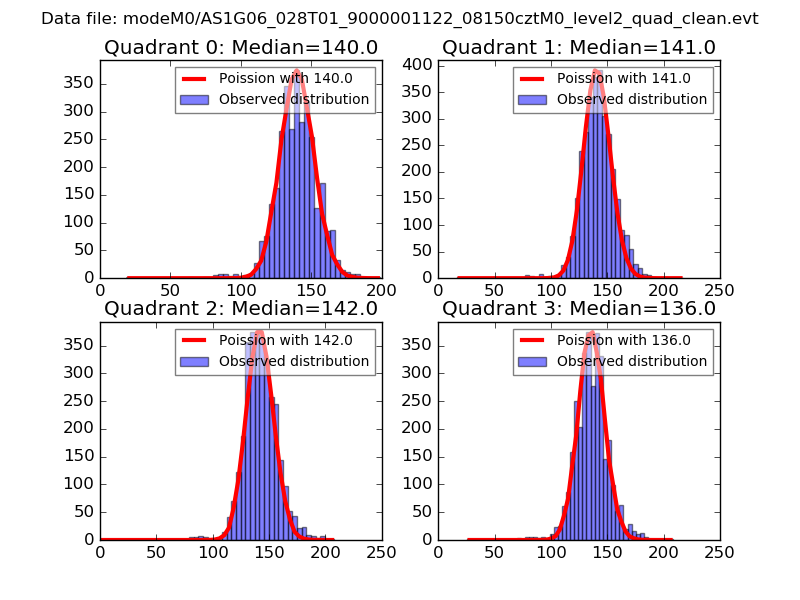 |
 |
| Quadrant-wise count rates Data is divided into 100 sec bins |
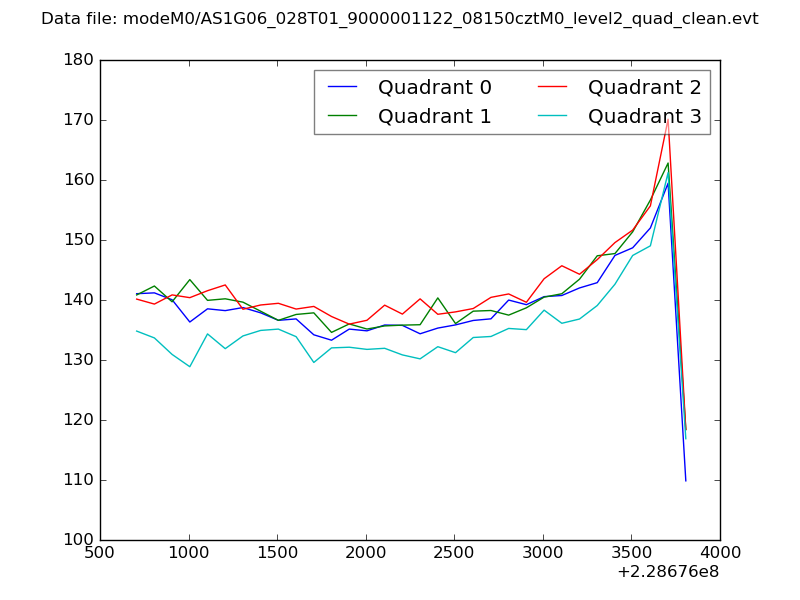 |
|
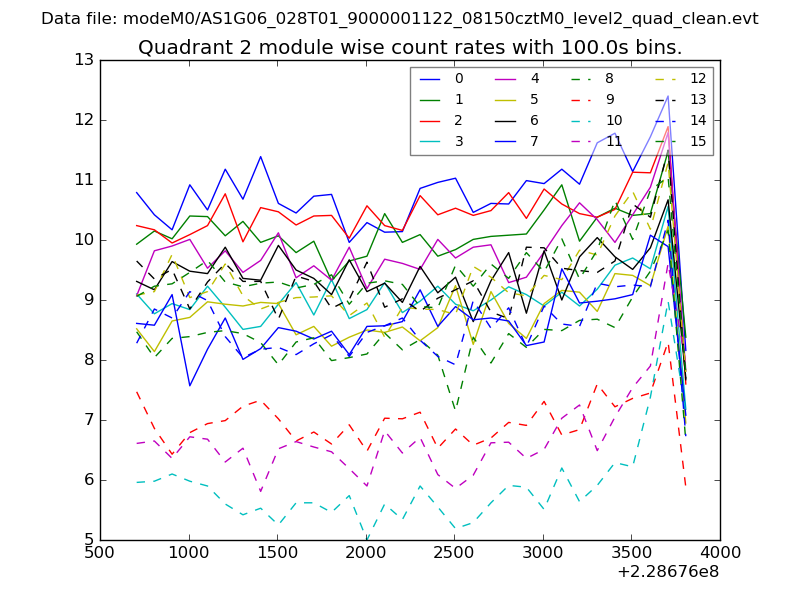
| Module-wise count rates for Quadrant A Data is divided into 100 sec bins |
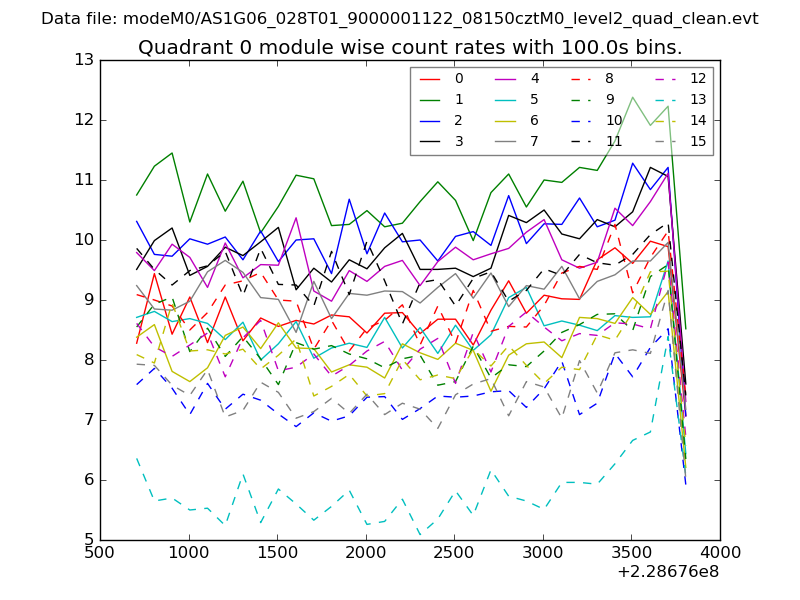 |
 |
| Module-wise count rates for Quadrant B Data is divided into 100 sec bins |
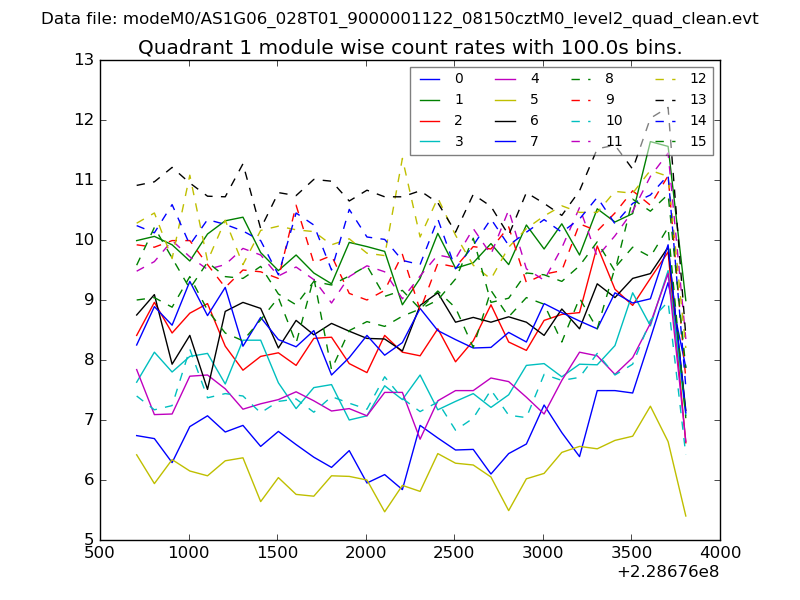 |
 |
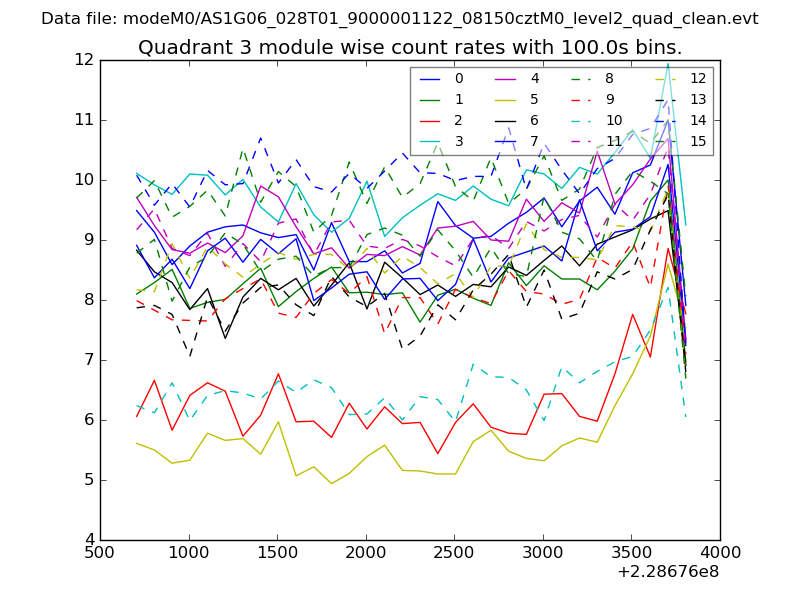
| Module-wise count rates for Quadrant C Data is divided into 100 sec bins |
 |
 |
| Module-wise count rates for Quadrant D Data is divided into 100 sec bins |
 |
 |
| Parameter | Plot |
|---|---|
| CZT HV Monitor | 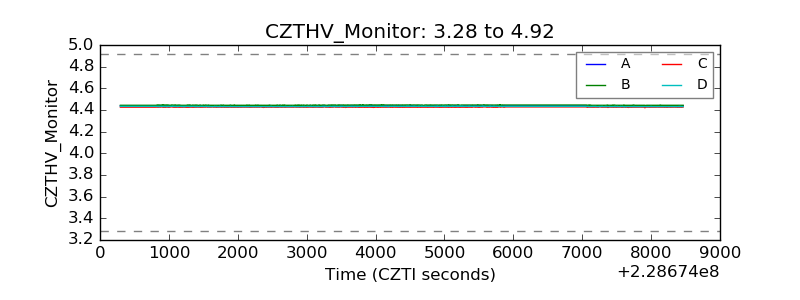 |
| D_VDD | 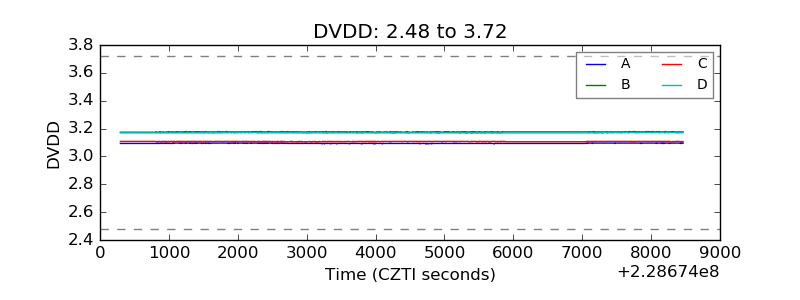 |
| Temperature 1 | 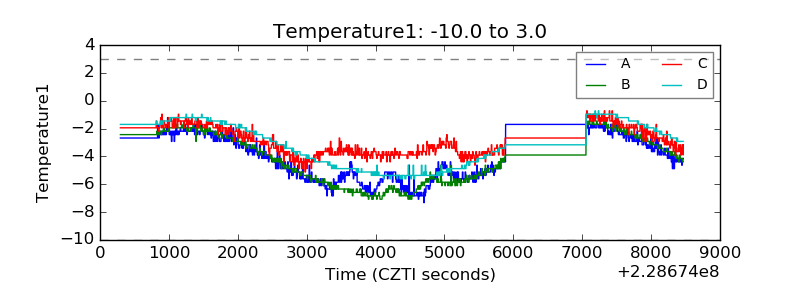 |
| Veto HV Monitor | 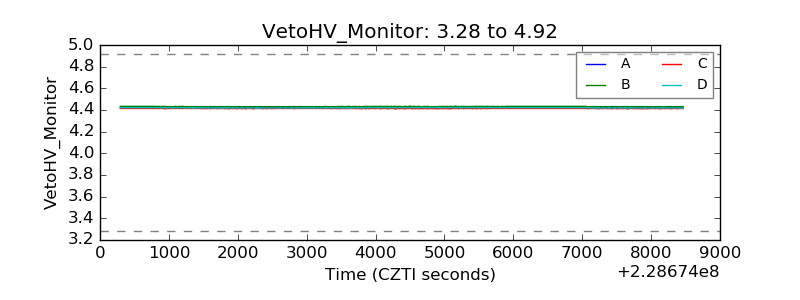 |
| Veto LLD | 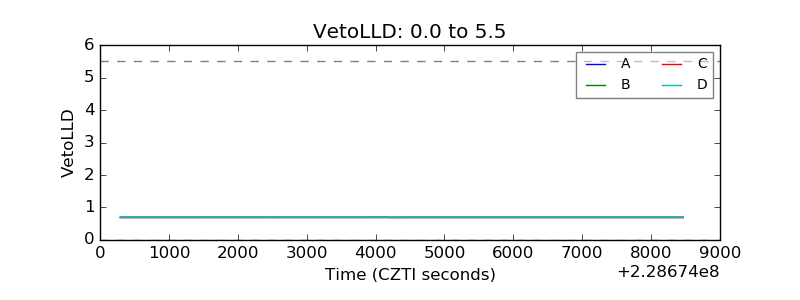 |
| Alpha Counter | 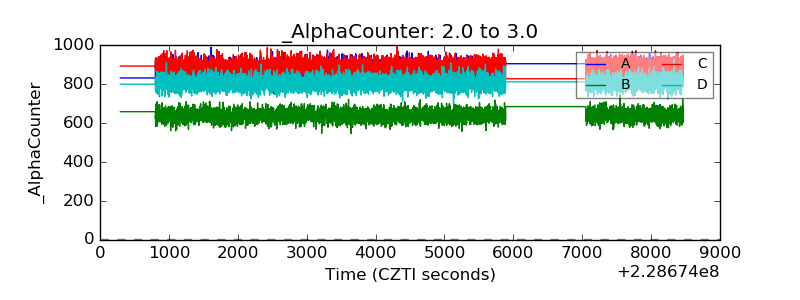 |
| _CPM_Rate | 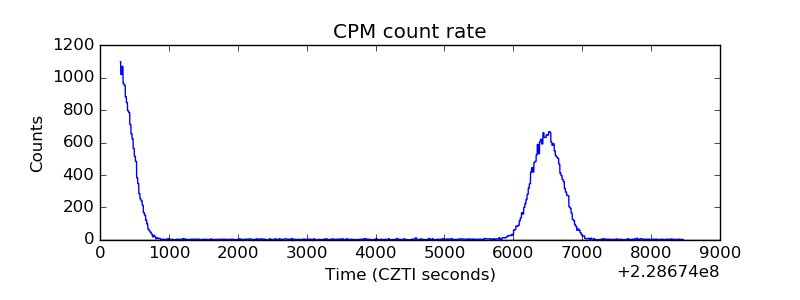 |
| CZT Counter | 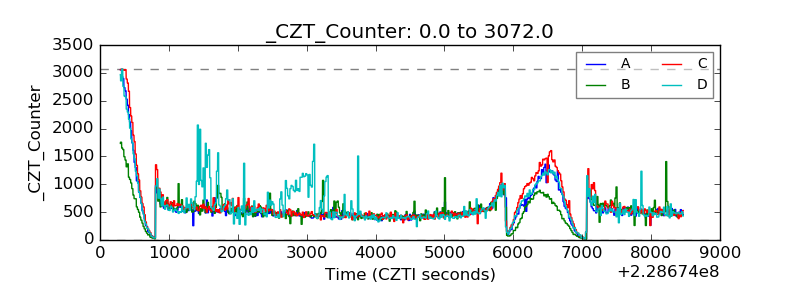 |
| +2.5 Volts monitor |  |
| +5 Volts monitor |  |
| _ROLL_ROT | 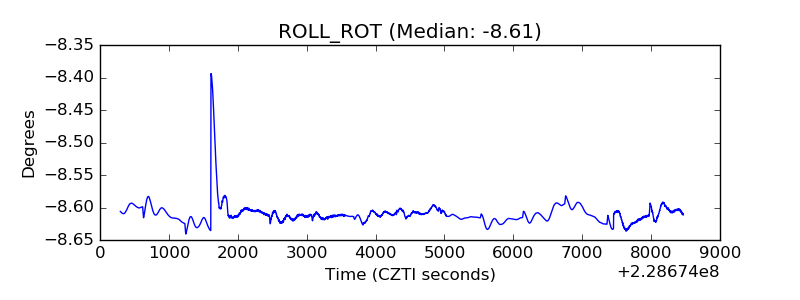 |
| _Roll_DEC |  |
| _Roll_RA | 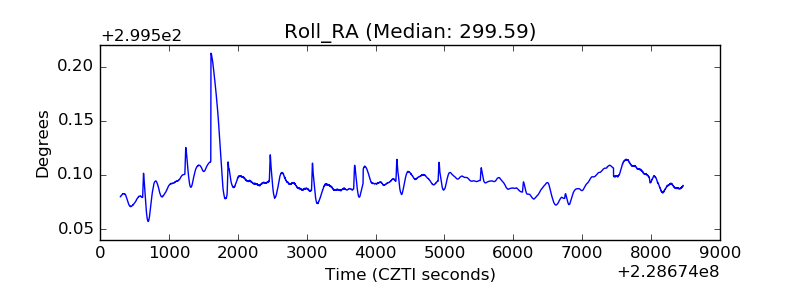 |
| Veto Counter | 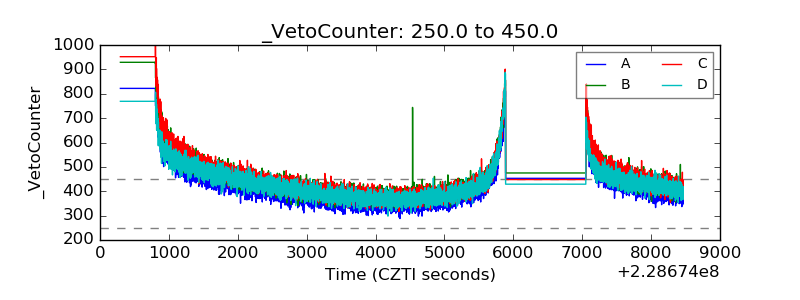 |