| Param | Original file | Final file |
|---|---|---|
| Filename | modeM0/AS1G06_028T01_9000001122_08152cztM0_level2.evt | modeM0/AS1G06_028T01_9000001122_08152cztM0_level2_quad_clean.evt |
| Size (bytes) | 503,277,120 | 99,455,040 |
| Size | 480.0 MB | 94.8 MB |
| Events in quadrant A | 3,535,867 | 625,884 |
| Events in quadrant B | 3,868,514 | 629,023 |
| Events in quadrant C | 3,649,265 | 634,982 |
| Events in quadrant D | 3,686,510 | 608,129 |
| Mode M0 | |||
|---|---|---|---|
| Quadrant | BADHDUFLAG | Total packets | Discarded packets |
| A | 0 | 15388 | 3 |
| B | 0 | 16282 | 2 |
| C | 0 | 15697 | 2 |
| D | 0 | 16040 | 2 |
| Mode SS | |||
|---|---|---|---|
| Quadrant | BADHDUFLAG | Total packets | Discarded packets |
| A | 0 | 152 | 0 |
| B | 0 | 152 | 0 |
| C | 0 | 152 | 0 |
| D | 0 | 152 | 0 |
| Mode M9 | |||
|---|---|---|---|
| Quadrant | BADHDUFLAG | Total packets | Discarded packets |
| A | 0 | 15 | 0 |
| B | 0 | 15 | 0 |
| C | 0 | 15 | 0 |
| D | 0 | 15 | 0 |
| Quadrant | Total seconds | Saturated seconds | Saturation percentage |
|---|---|---|---|
| A | 7383 | 87 | 1.178383% |
| B | 7383 | 174 | 2.356766% |
| C | 7383 | 84 | 1.137749% |
| D | 7383 | 119 | 1.611811% |
Noise dominated data is calculated using 1-second bins in cleaned event files. If a bin has >2000 counts, and if more than 50% of those come from <1% of pixels, then it is considered to be noise-dominated and hence unusable.
| Quadrant | # 1 sec bins | Bins with >0 counts | Bins with >2000 counts | High rate bins dominated by noise | Noise dominated (total time) | Noise dominated (detector-on time) | Marked lightcurve |
|---|---|---|---|---|---|---|---|
| A | 8858 | 7385 | 0 | 0 | 0.00% | 0.00% |  |
| B | 8858 | 7385 | 11 | 11 | 0.12% | 0.15% | 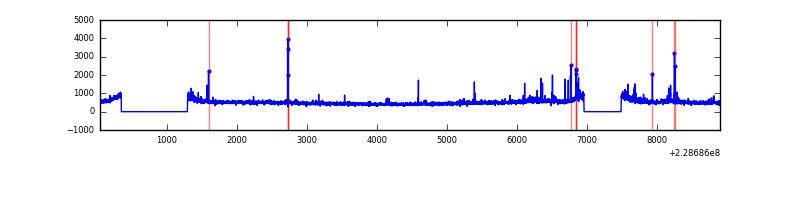 |
| C | 8858 | 7385 | 0 | 0 | 0.00% | 0.00% | 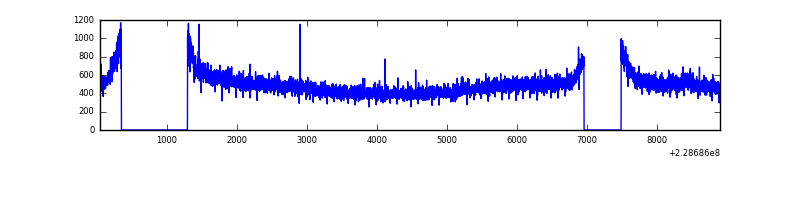 |
| D | 8858 | 7385 | 21 | 21 | 0.24% | 0.28% | 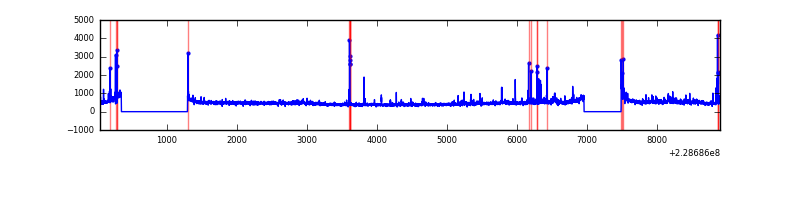 |
Top three noisy pixels from each quadrant. If the there are fewer than three noisy pixels in the level2.evt file, extra rows are filled as -1
| Pixel properties | Quadrant properties | ||||||
|---|---|---|---|---|---|---|---|
| Quadrant | DetID | PixID | Counts | Sigma | Mean | Median | Sigma |
| A | 0 | 226 | 8523 | 40.54 | 915 | 896 | 188.1 |
| A | 12 | 194 | 8089 | 38.24 | 915 | 896 | 188.1 |
| A | 13 | 254 | 7478 | 34.99 | 915 | 896 | 188.1 |
| B | 4 | 173 | 95423 | 539.79 | 917 | 896 | 175.1 |
| B | 0 | 219 | 76746 | 433.13 | 917 | 896 | 175.1 |
| B | 0 | 214 | 40244 | 224.69 | 917 | 896 | 175.1 |
| C | 1 | 16 | 145633 | 694.52 | 896 | 903 | 208.4 |
| C | 13 | 61 | 6653 | 27.59 | 896 | 903 | 208.4 |
| C | 8 | 128 | 5382 | 21.49 | 896 | 903 | 208.4 |
| D | 12 | 233 | 70872 | 320.33 | 893 | 868 | 218.5 |
| D | 1 | 52 | 55335 | 249.24 | 893 | 868 | 218.5 |
| D | 2 | 152 | 49323 | 221.73 | 893 | 868 | 218.5 |
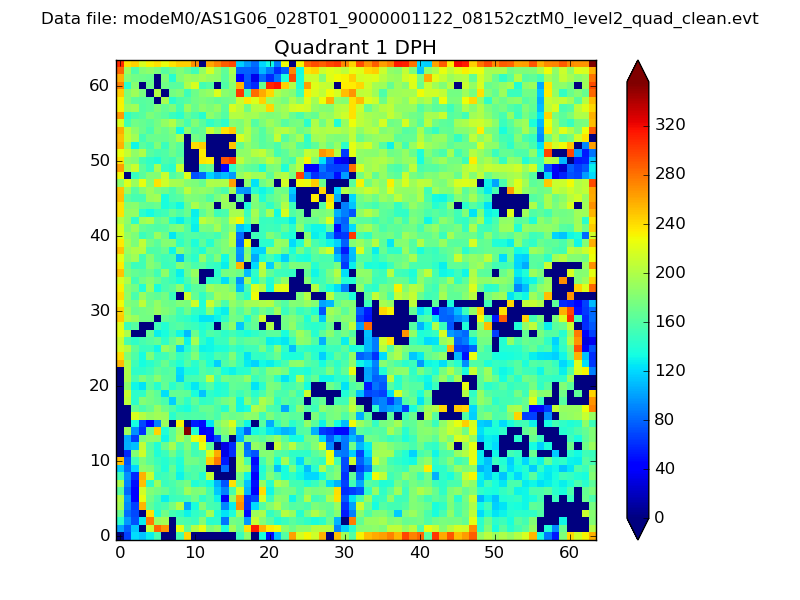
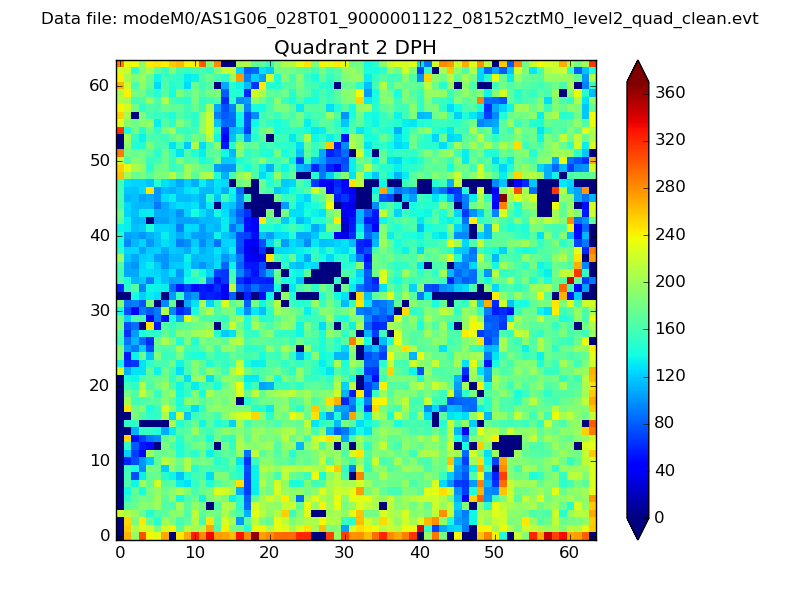
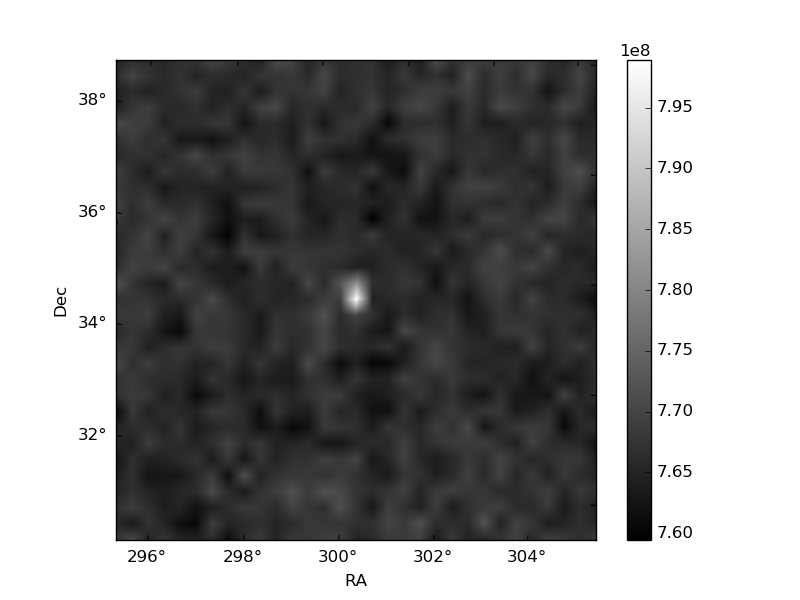
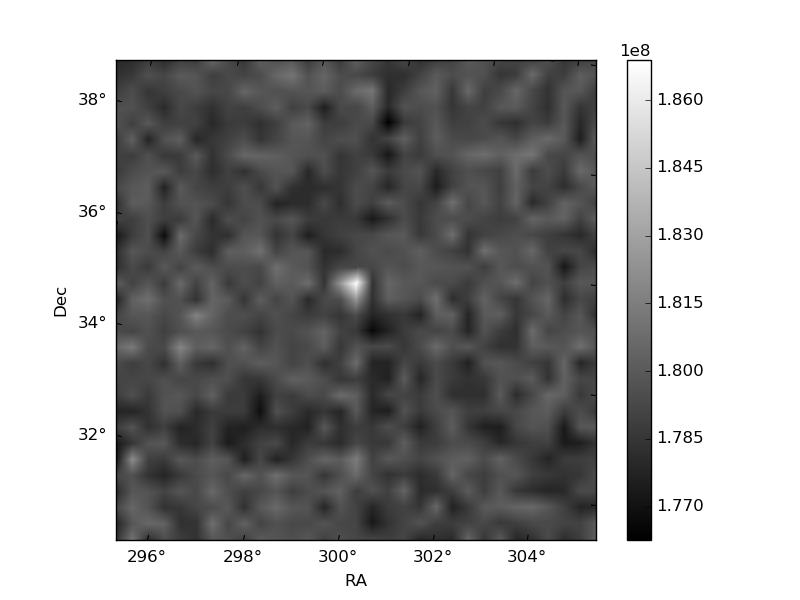
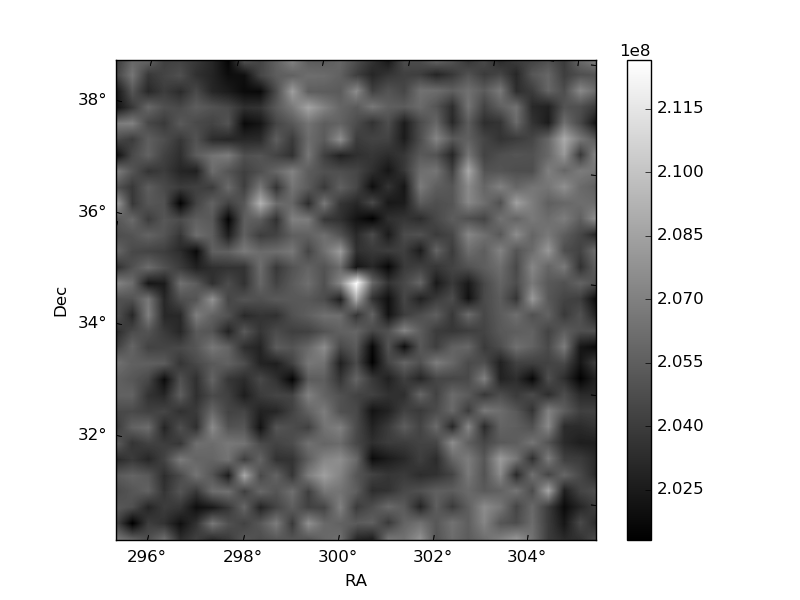
Histogram calculated using DETX and DETY for each event in the final _common_clean file
| Quadrant A | 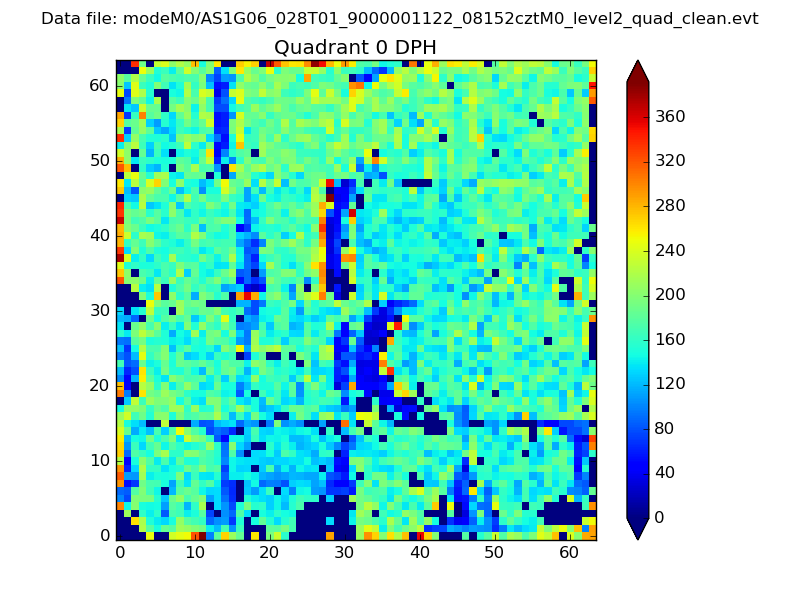 |
 |
Quadrant B |
|---|---|---|---|
| Quadrant D | 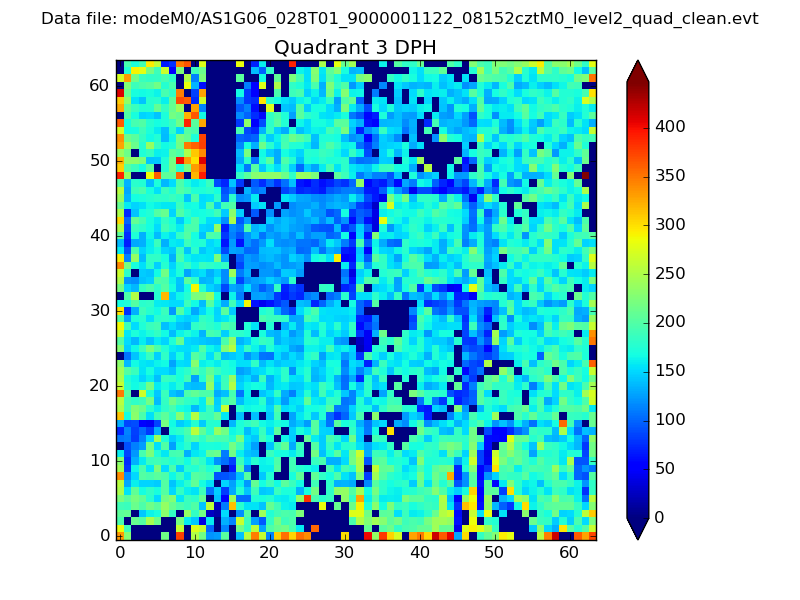 |
 |
Quadrant C |
| Plot type | Count rate plots | Images |
|---|---|---|
| Comparison with Poisson distribution Blue bars denote a histogram of data divided into 1 sec bins. Red curve is a Poisson curve with rate = median count rate of data. |
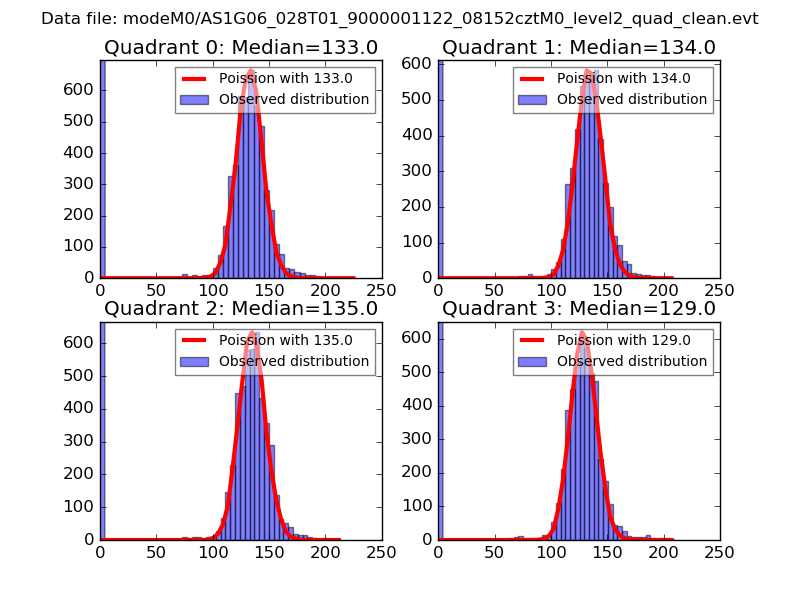 |
 |
| Quadrant-wise count rates Data is divided into 100 sec bins |
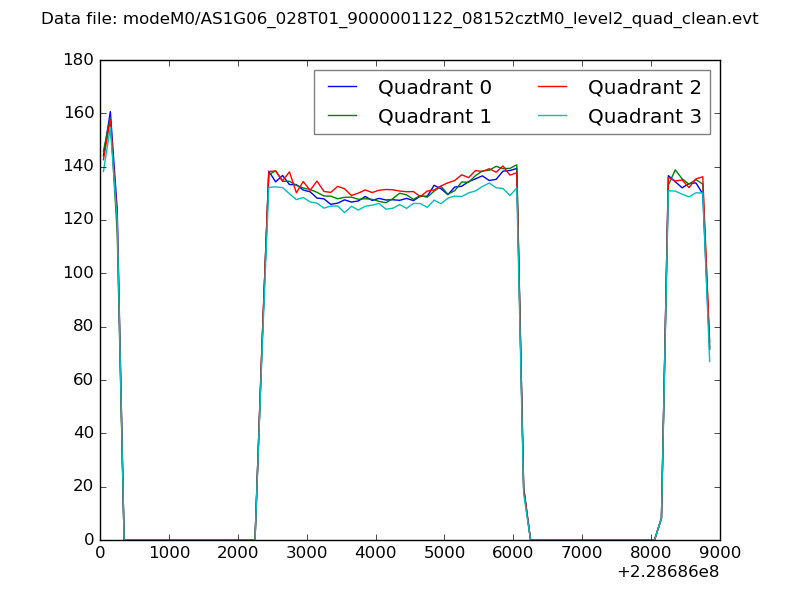 |
|
| Module-wise count rates for Quadrant A Data is divided into 100 sec bins |
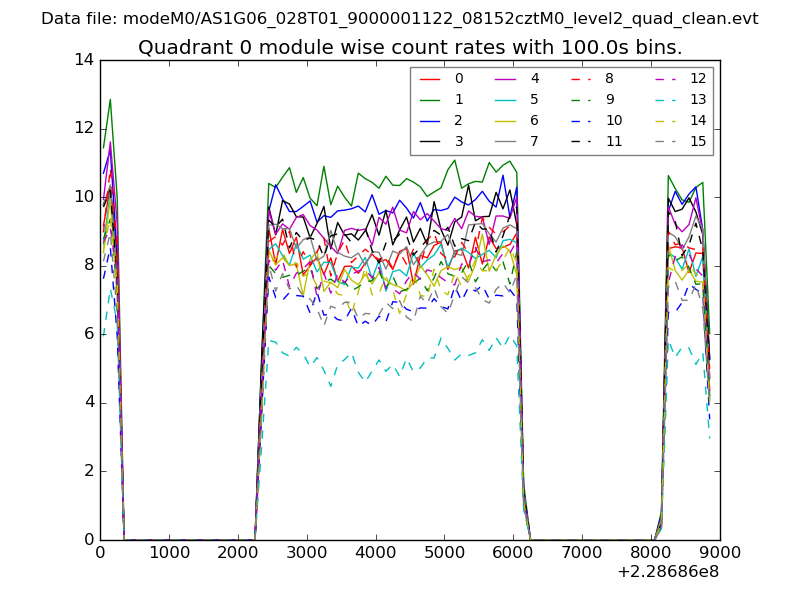 |
 |
| Module-wise count rates for Quadrant B Data is divided into 100 sec bins |
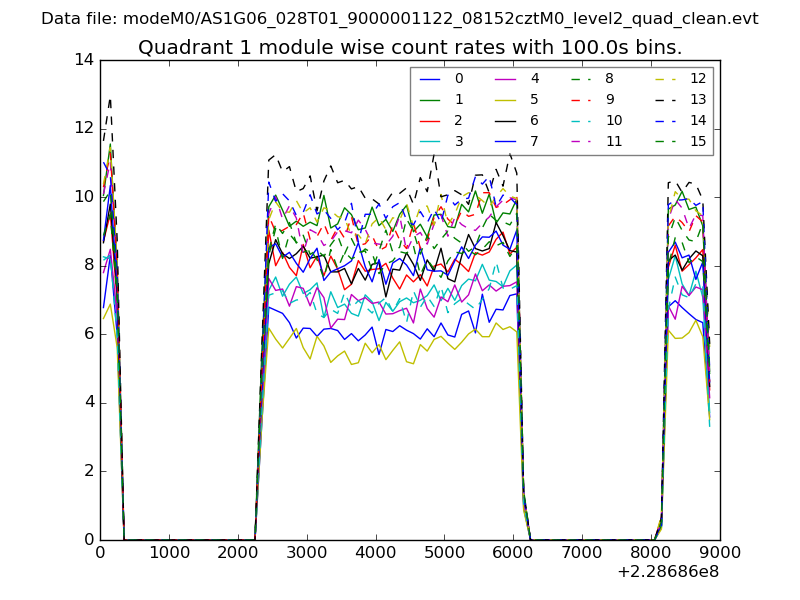 |
 |
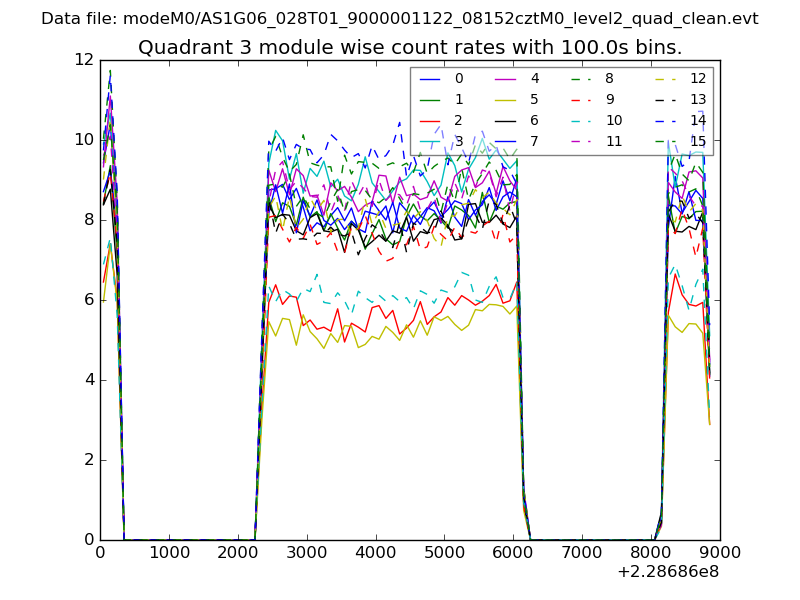
| Module-wise count rates for Quadrant C Data is divided into 100 sec bins |
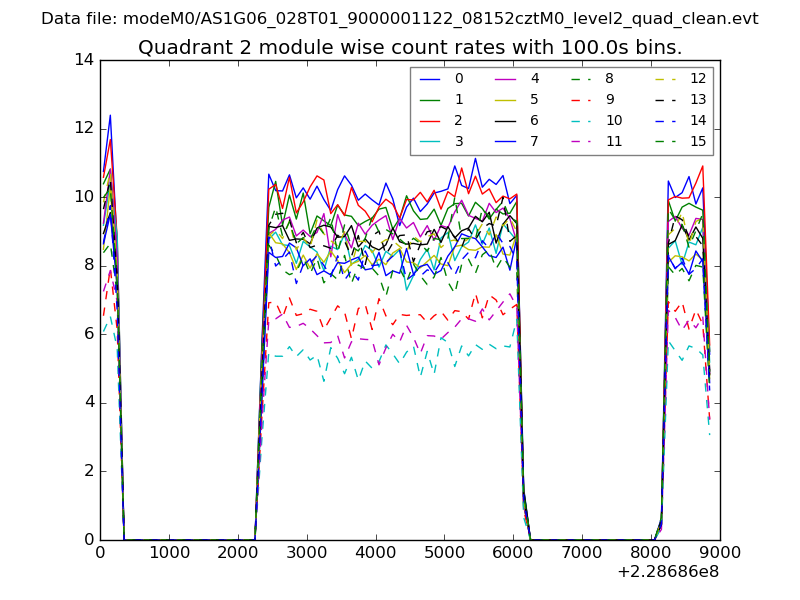 |
 |
| Module-wise count rates for Quadrant D Data is divided into 100 sec bins |
 |
 |
| Parameter | Plot |
|---|---|
| CZT HV Monitor | 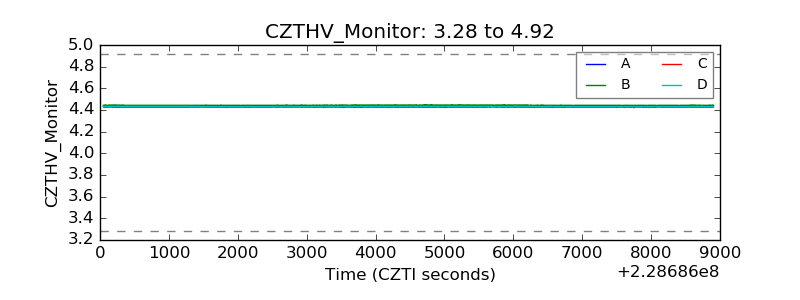 |
| D_VDD |  |
| Temperature 1 | 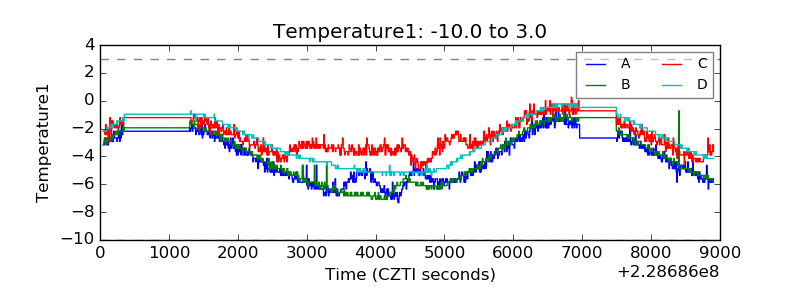 |
| Veto HV Monitor | 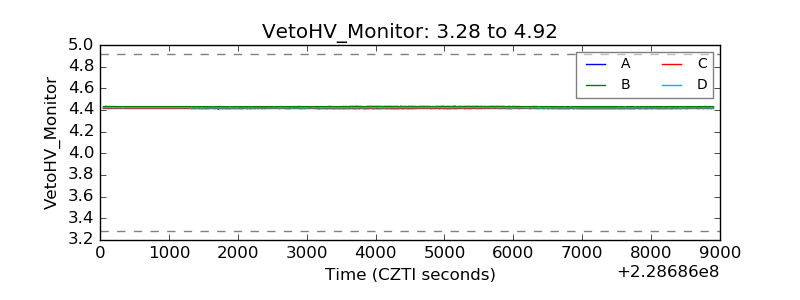 |
| Veto LLD | 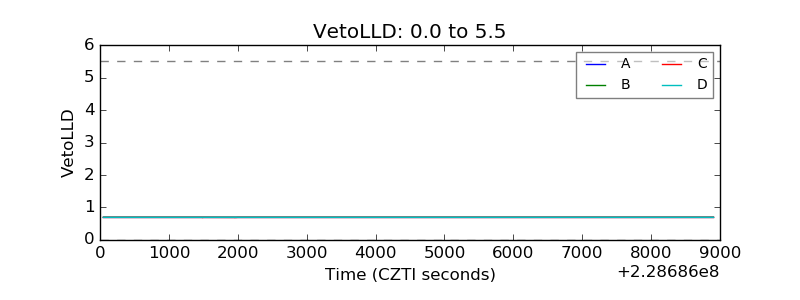 |
| Alpha Counter | 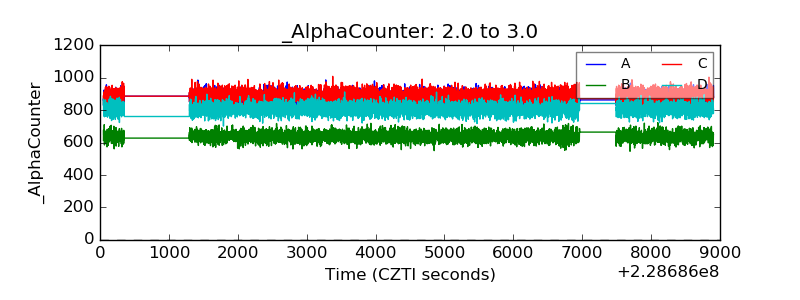 |
| _CPM_Rate | 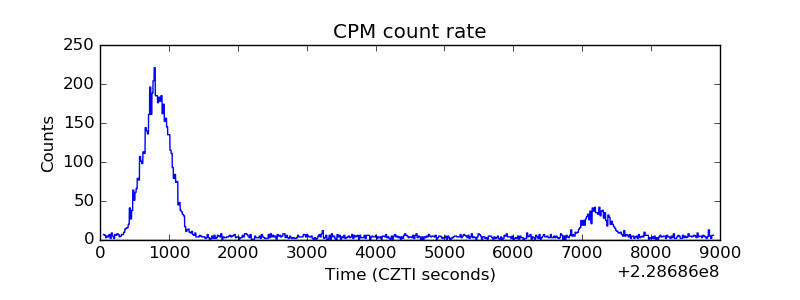 |
| CZT Counter | 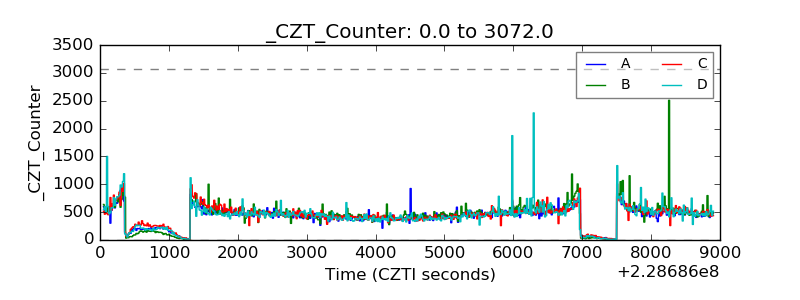 |
| +2.5 Volts monitor |  |
| +5 Volts monitor | 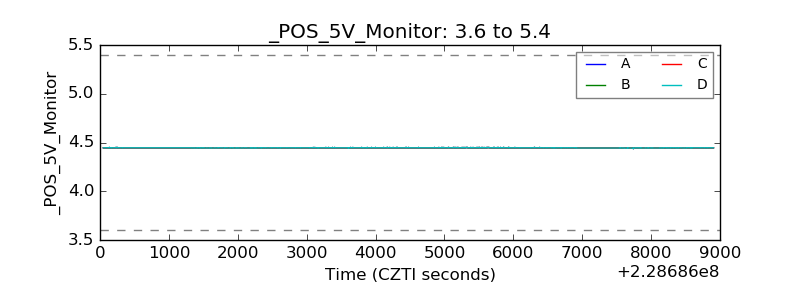 |
| _ROLL_ROT | 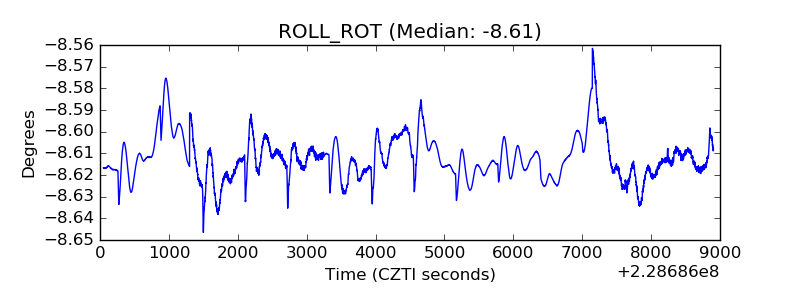 |
| _Roll_DEC | 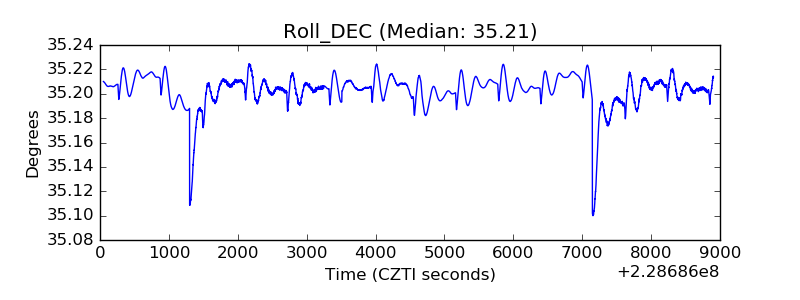 |
| _Roll_RA | 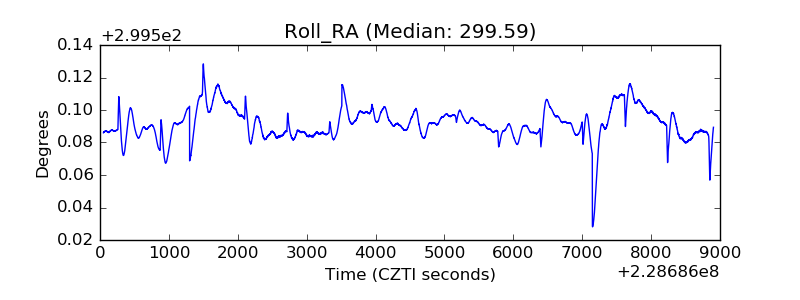 |
| Veto Counter | 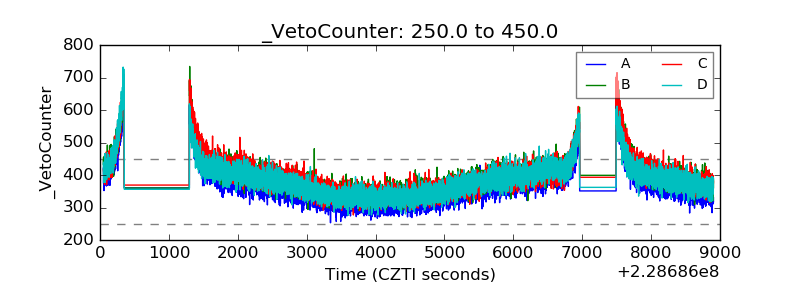 |