| Param | Original file | Final file |
|---|---|---|
| Filename | modeM0/AS1G07_043T01_9000001126cztM0_level2.fits | modeM0/AS1G07_043T01_9000001126cztM0_level2_quad_clean.evt |
| Size (bytes) | 746,294,400 | 731,338,560 |
| Size | 711.7 MB | 697.5 MB |
| Events in quadrant A | 4,483,566 | 4,287,234 |
| Events in quadrant B | 4,325,308 | 4,299,062 |
| Events in quadrant C | 4,475,212 | 4,237,303 |
| Events in quadrant D | 3,875,744 | 3,884,914 |
| Mode M0 | |||
|---|---|---|---|
| Quadrant | BADHDUFLAG | Total packets | Discarded packets |
| A | 0 | 166179 | 0 |
| B | 0 | 171358 | 0 |
| C | 0 | 165910 | 0 |
| D | 0 | 173624 | 0 |
| Mode SS | |||
|---|---|---|---|
| Quadrant | BADHDUFLAG | Total packets | Discarded packets |
| A | 0 | 1628 | 0 |
| B | 0 | 1624 | 0 |
| C | 0 | 1623 | 0 |
| D | 0 | 1620 | 0 |
| Mode M9 | |||
|---|---|---|---|
| Quadrant | BADHDUFLAG | Total packets | Discarded packets |
| A | 0 | 130 | 0 |
| B | 0 | 130 | 0 |
| C | 0 | 130 | 0 |
| D | 0 | 130 | 0 |
| Quadrant | Total seconds | Saturated seconds | Saturation percentage |
|---|---|---|---|
| A | 79299 | 1005 | 1.267355% |
| B | 79349 | 1591 | 2.005066% |
| C | 79369 | 897 | 1.130164% |
| D | 79344 | 1294 | 1.630873% |
Noise dominated data is calculated using 1-second bins in cleaned event files. If a bin has >2000 counts, and if more than 50% of those come from <1% of pixels, then it is considered to be noise-dominated and hence unusable.
| Quadrant | # 1 sec bins | Bins with >0 counts | Bins with >2000 counts | High rate bins dominated by noise | Noise dominated (total time) | Noise dominated (detector-on time) | Marked lightcurve |
|---|---|---|---|---|---|---|---|
| A | 93375 | 79590 | 0 | 0 | 0.00% | 0.00% | 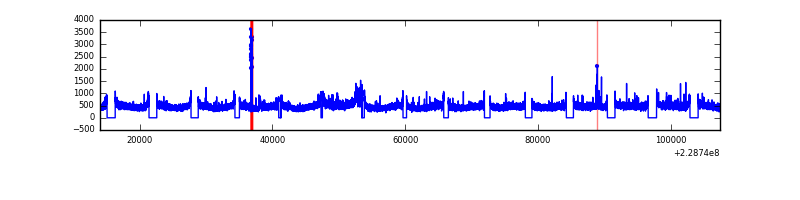 |
| B | 93375 | 79619 | 0 | 0 | 0.00% | 0.00% | 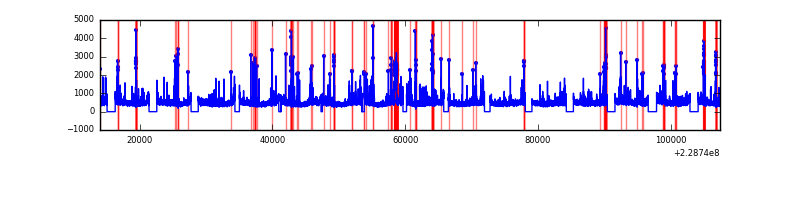 |
| C | 93375 | 79677 | 0 | 0 | 0.00% | 0.00% | 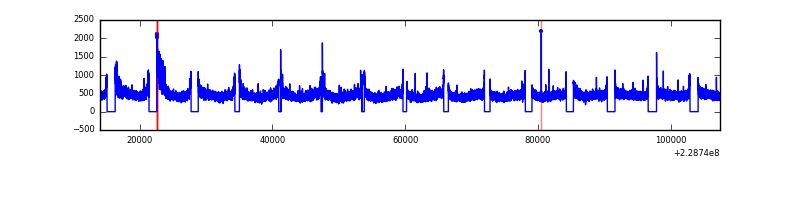 |
| D | 93375 | 79625 | 0 | 0 | 0.00% | 0.00% | 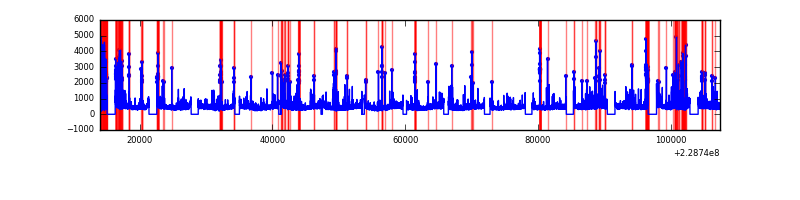 |
Top three noisy pixels from each quadrant. If the there are fewer than three noisy pixels in the level2.evt file, extra rows are filled as -1
| Pixel properties | Quadrant properties | ||||||
|---|---|---|---|---|---|---|---|
| Quadrant | DetID | PixID | Counts | Sigma | Mean | Median | Sigma |
| A | 0 | 29 | 4302 | 10.96 | 1165 | 1087 | 293.3 |
| A | 7 | 110 | 3696 | 8.9 | 1165 | 1087 | 293.3 |
| A | 0 | 30 | 3359 | 7.75 | 1165 | 1087 | 293.3 |
| B | 2 | 9 | 3764 | 11.67 | 1141 | 1083 | 229.8 |
| B | 3 | 17 | 2918 | 7.99 | 1141 | 1083 | 229.8 |
| B | 12 | 226 | 2918 | 7.99 | 1141 | 1083 | 229.8 |
| C | 1 | 80 | 3380 | 7.43 | 1180 | 1096 | 307.6 |
| C | 1 | 81 | 3339 | 7.29 | 1180 | 1096 | 307.6 |
| C | 1 | 65 | 3105 | 6.53 | 1180 | 1096 | 307.6 |
| D | 3 | 14 | 2889 | 6.48 | 1102 | 1004 | 290.7 |
| D | 6 | 231 | 2792 | 6.15 | 1102 | 1004 | 290.7 |
| D | 7 | 5 | 2751 | 6.01 | 1102 | 1004 | 290.7 |
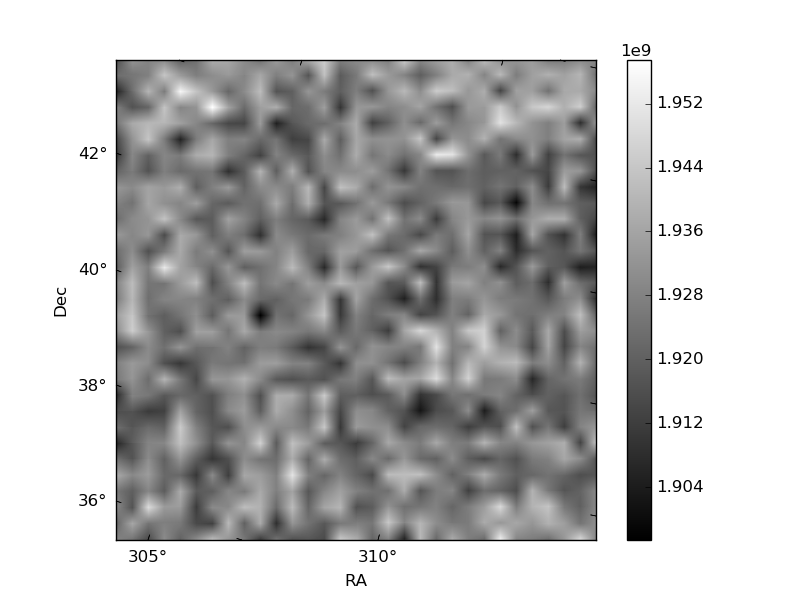
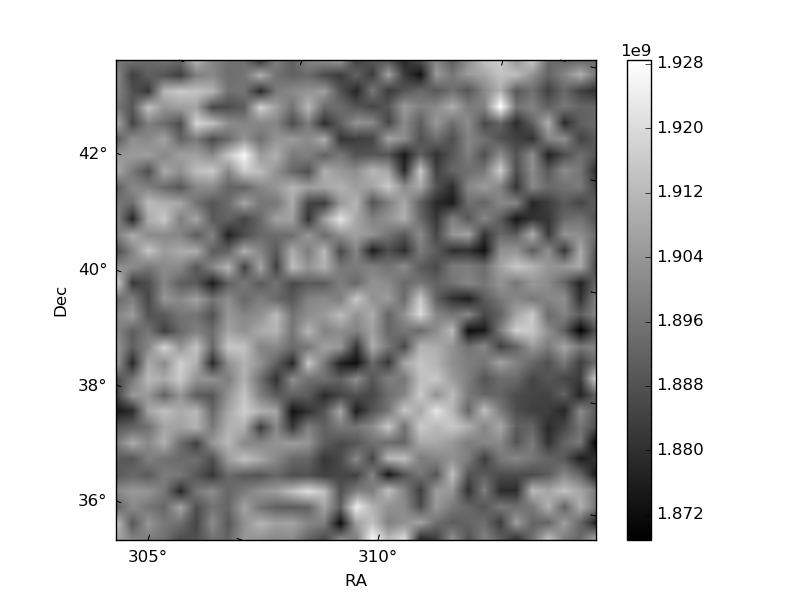
Histogram calculated using DETX and DETY for each event in the final _common_clean file
| Quadrant A | 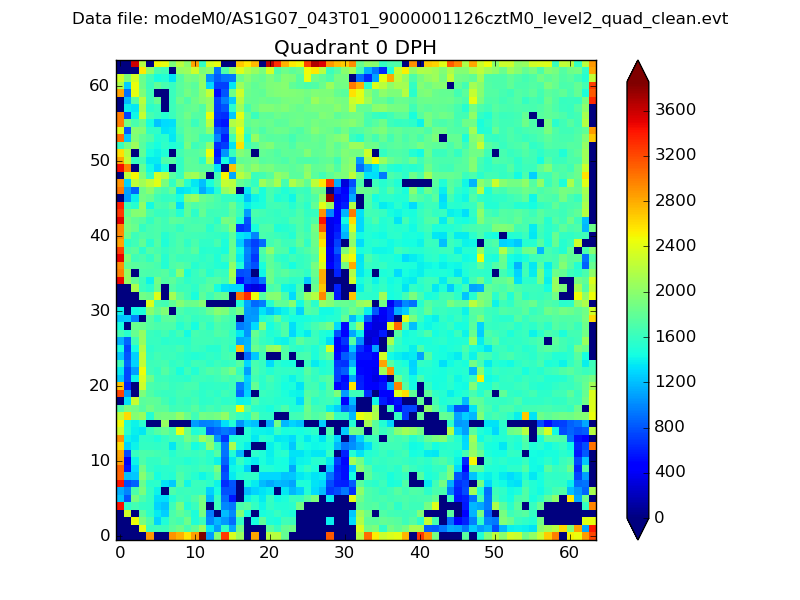 |
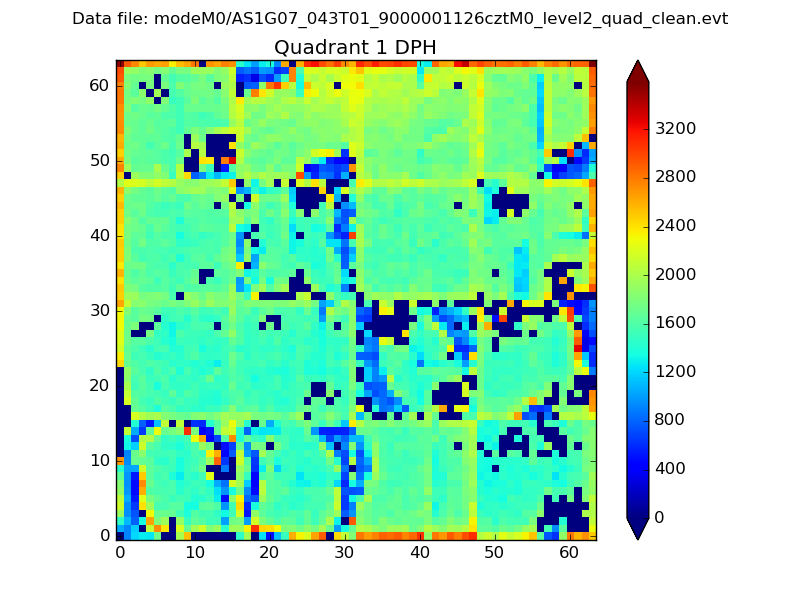 |
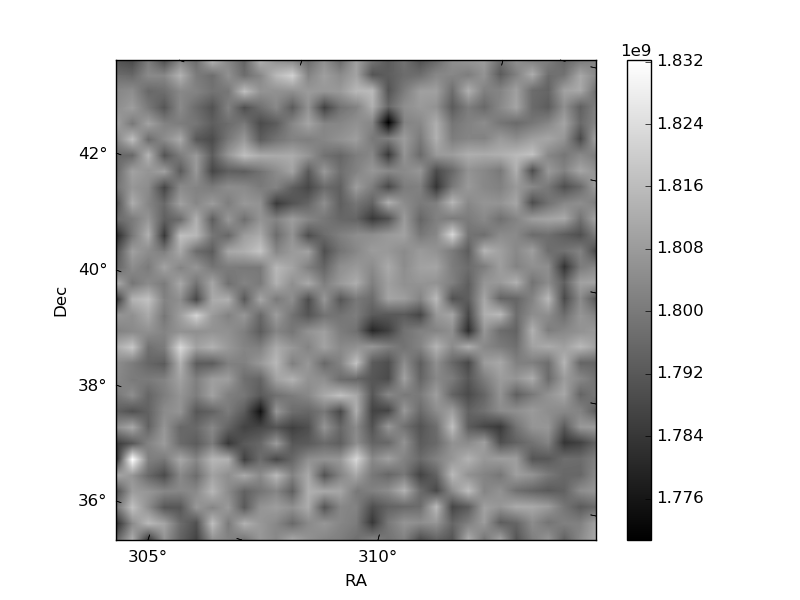
Quadrant B |
|---|---|---|---|
| Quadrant D | 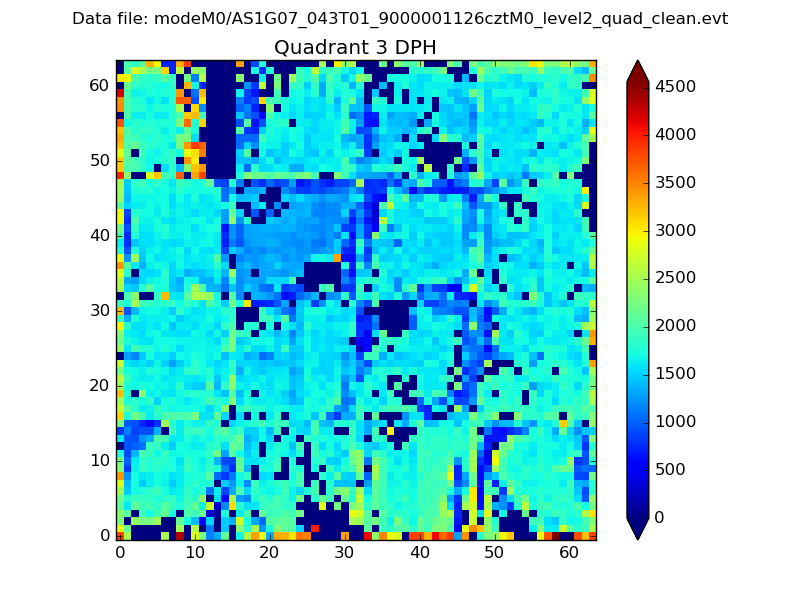 |
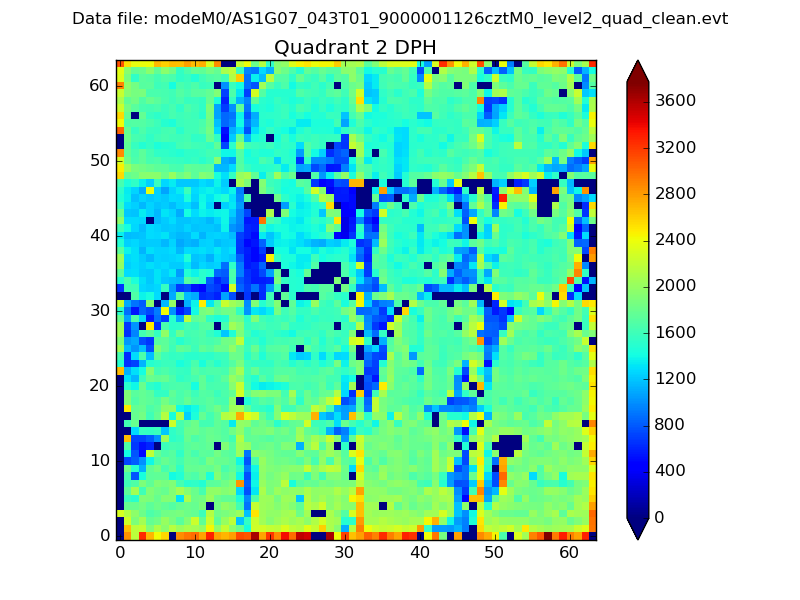 |
Quadrant C |
| Plot type | Count rate plots | Images |
|---|---|---|
| Comparison with Poisson distribution Blue bars denote a histogram of data divided into 1 sec bins. Red curve is a Poisson curve with rate = median count rate of data. |
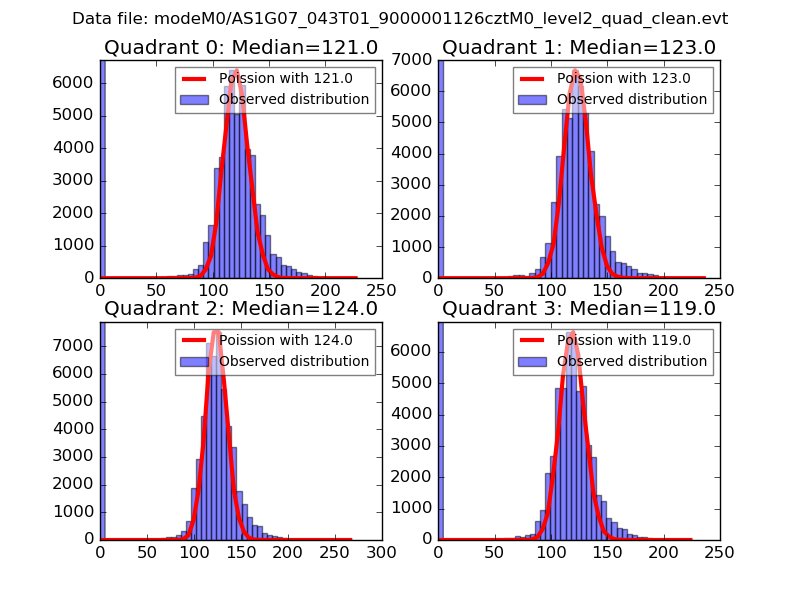 |
 |
| Quadrant-wise count rates Data is divided into 100 sec bins |
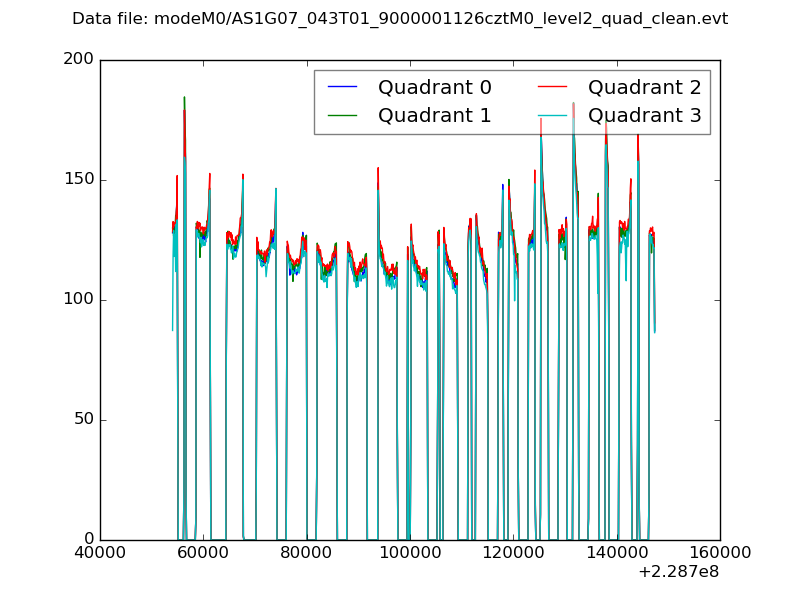 |
|
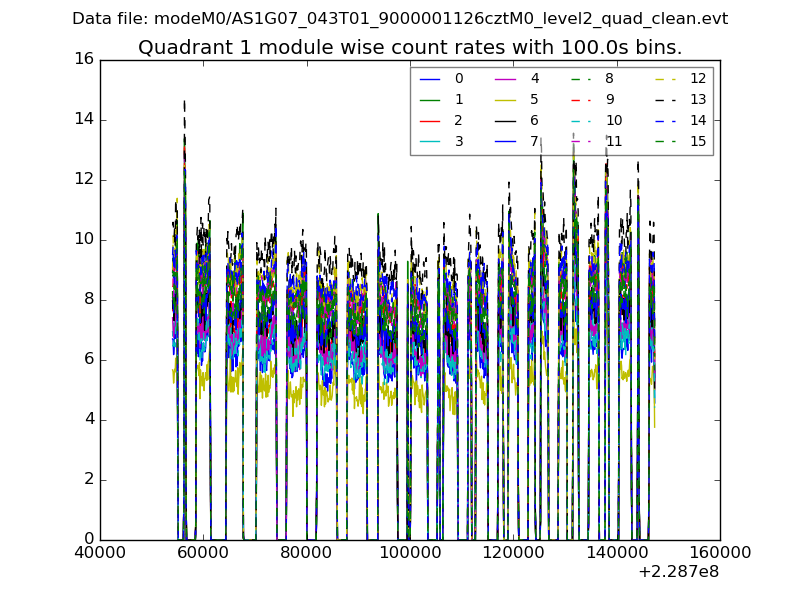
| Module-wise count rates for Quadrant A Data is divided into 100 sec bins |
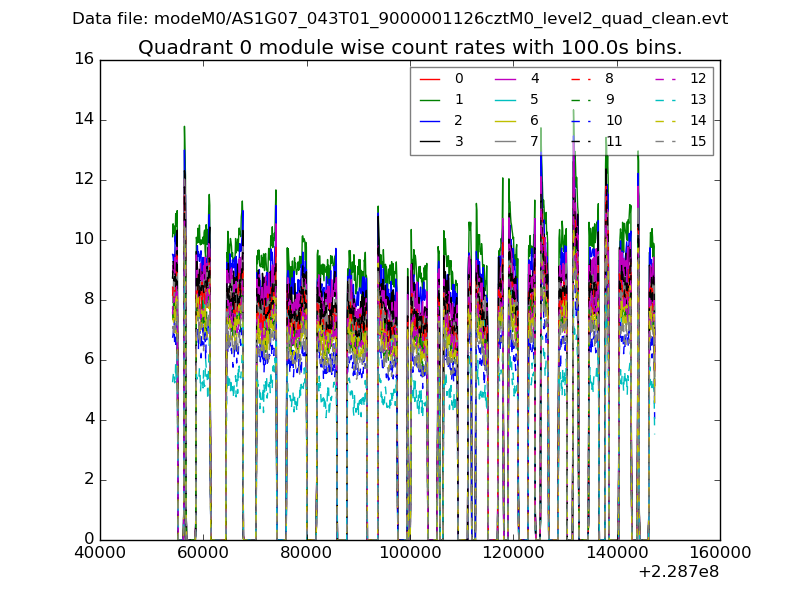 |
 |
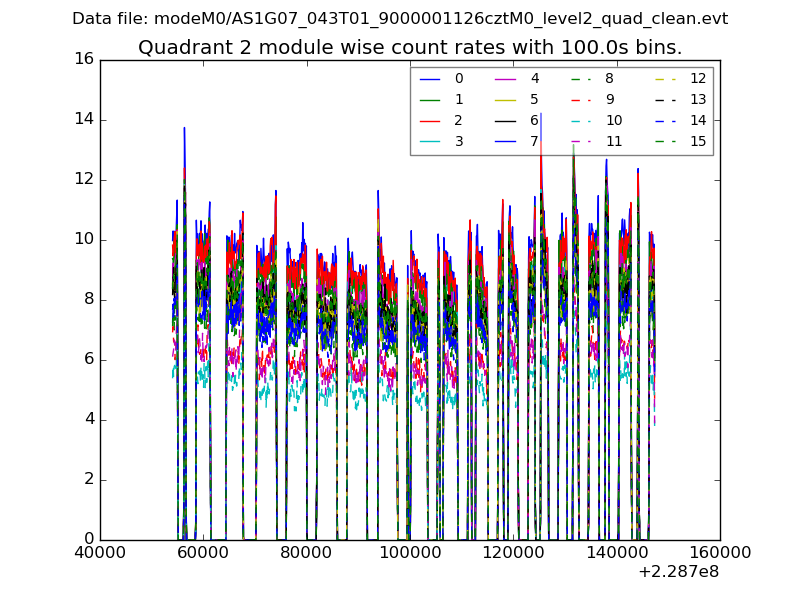
| Module-wise count rates for Quadrant B Data is divided into 100 sec bins |
 |
 |
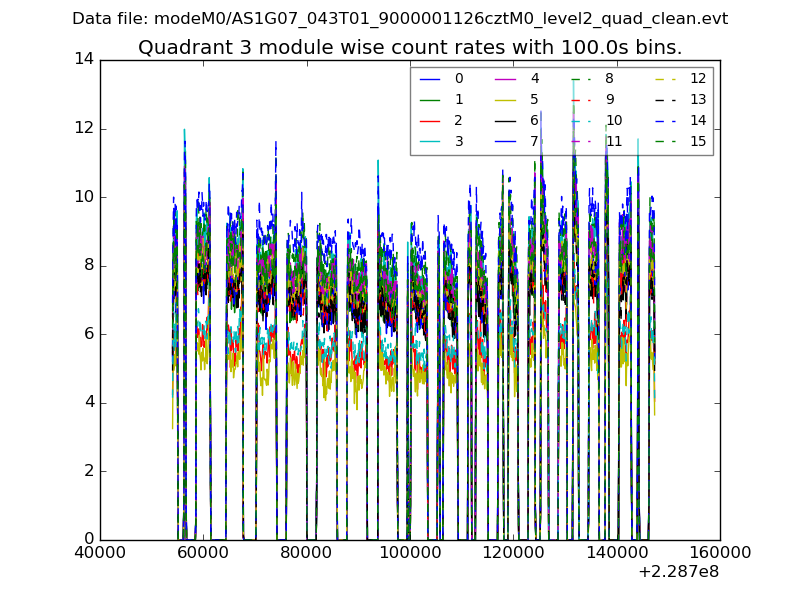
| Module-wise count rates for Quadrant C Data is divided into 100 sec bins |
 |
 |
| Module-wise count rates for Quadrant D Data is divided into 100 sec bins |
 |
 |
| Parameter | Plot |
|---|---|
| CZT HV Monitor |  |
| D_VDD | 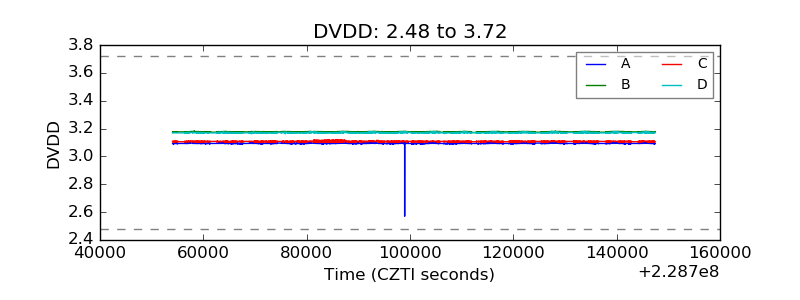 |
| Temperature 1 | 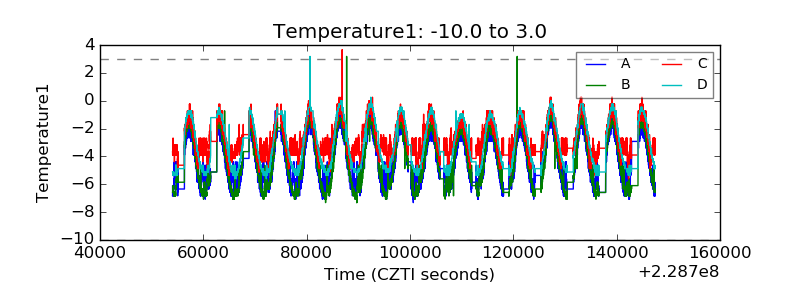 |
| Veto HV Monitor | 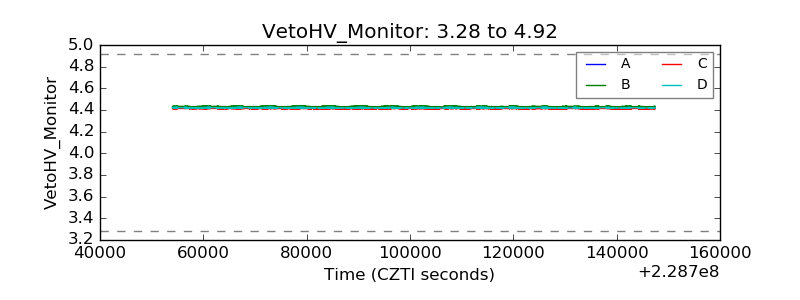 |
| Veto LLD | 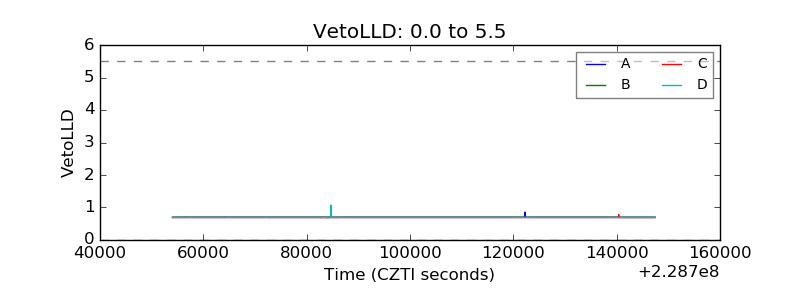 |
| Alpha Counter | 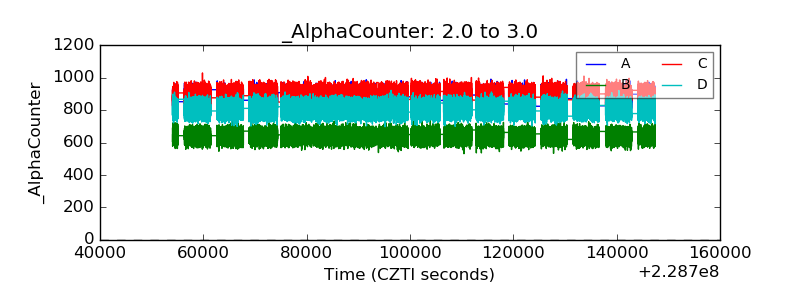 |
| _CPM_Rate | 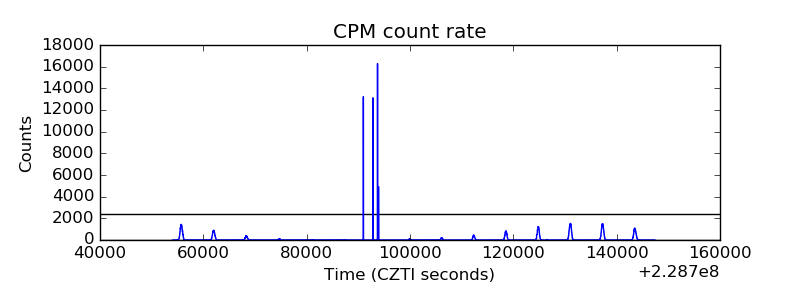 |
| CZT Counter |  |
| +2.5 Volts monitor | 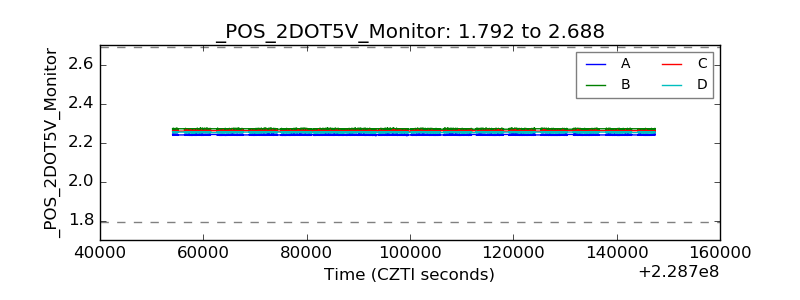 |
| +5 Volts monitor | 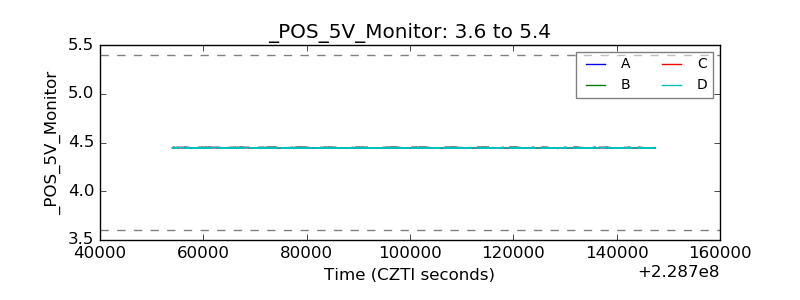 |
| _ROLL_ROT | 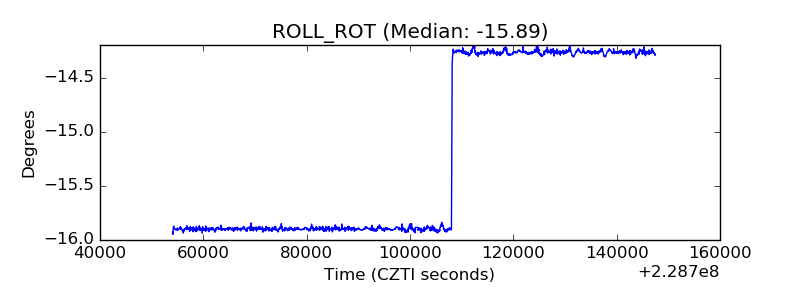 |
| _Roll_DEC | 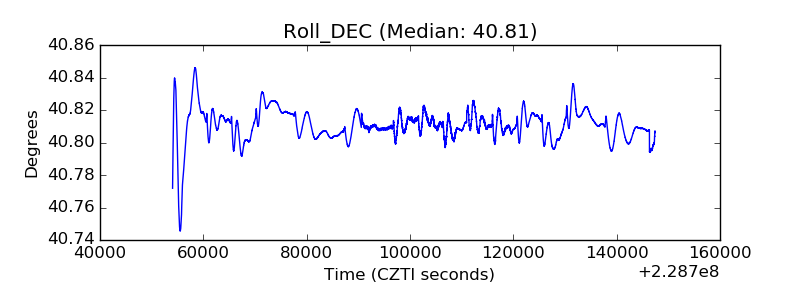 |
| _Roll_RA | 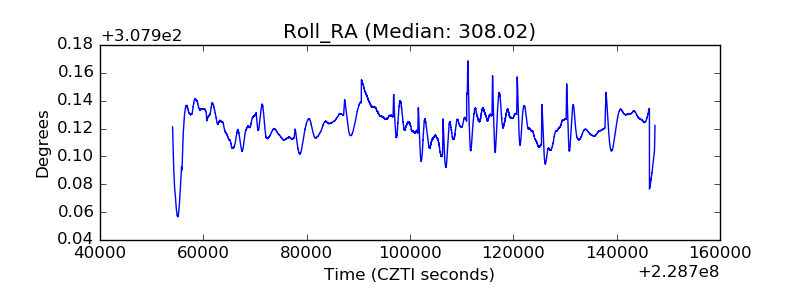 |
| Veto Counter | 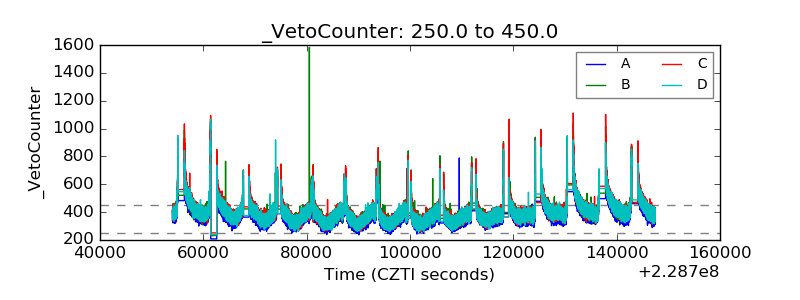 |