| Param | Original file | Final file |
|---|---|---|
| Filename | modeM0/AS1G07_043T01_9000001126_08165cztM0_level2.evt | modeM0/AS1G07_043T01_9000001126_08165cztM0_level2_quad_clean.evt |
| Size (bytes) | 453,116,160 | 69,264,000 |
| Size | 432.1 MB | 66.1 MB |
| Events in quadrant A | 3,074,195 | 408,943 |
| Events in quadrant B | 3,208,550 | 412,641 |
| Events in quadrant C | 3,849,013 | 419,437 |
| Events in quadrant D | 3,151,277 | 404,893 |
| Mode M0 | |||
|---|---|---|---|
| Quadrant | BADHDUFLAG | Total packets | Discarded packets |
| A | 0 | 13392 | 3 |
| B | 0 | 13645 | 2 |
| C | 0 | 15812 | 2 |
| D | 0 | 13735 | 2 |
| Mode SS | |||
|---|---|---|---|
| Quadrant | BADHDUFLAG | Total packets | Discarded packets |
| A | 0 | 132 | 0 |
| B | 0 | 132 | 0 |
| C | 0 | 132 | 0 |
| D | 0 | 132 | 0 |
| Mode M9 | |||
|---|---|---|---|
| Quadrant | BADHDUFLAG | Total packets | Discarded packets |
| A | 0 | 11 | 0 |
| B | 0 | 11 | 0 |
| C | 0 | 11 | 0 |
| D | 0 | 12 | 0 |
| Quadrant | Total seconds | Saturated seconds | Saturation percentage |
|---|---|---|---|
| A | 6466 | 46 | 0.711414% |
| B | 6466 | 69 | 1.067120% |
| C | 6466 | 126 | 1.948655% |
| D | 6466 | 69 | 1.067120% |
Noise dominated data is calculated using 1-second bins in cleaned event files. If a bin has >2000 counts, and if more than 50% of those come from <1% of pixels, then it is considered to be noise-dominated and hence unusable.
| Quadrant | # 1 sec bins | Bins with >0 counts | Bins with >2000 counts | High rate bins dominated by noise | Noise dominated (total time) | Noise dominated (detector-on time) | Marked lightcurve |
|---|---|---|---|---|---|---|---|
| A | 7556 | 6467 | 0 | 0 | 0.00% | 0.00% | 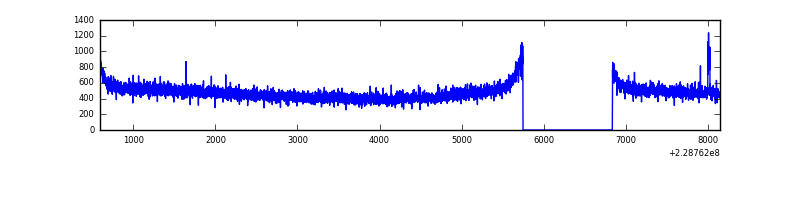 |
| B | 7556 | 6467 | 6 | 6 | 0.08% | 0.09% | 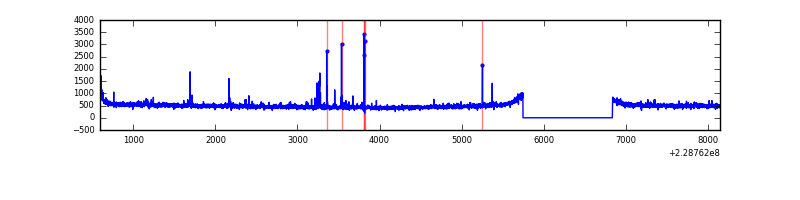 |
| C | 7556 | 6467 | 5 | 5 | 0.07% | 0.08% | 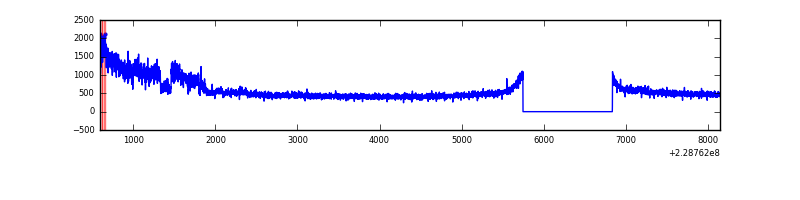 |
| D | 7556 | 6467 | 16 | 16 | 0.21% | 0.25% | 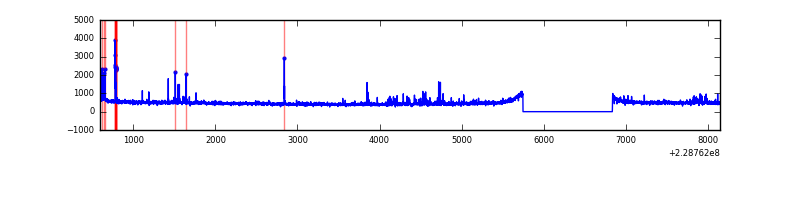 |
Top three noisy pixels from each quadrant. If the there are fewer than three noisy pixels in the level2.evt file, extra rows are filled as -1
| Pixel properties | Quadrant properties | ||||||
|---|---|---|---|---|---|---|---|
| Quadrant | DetID | PixID | Counts | Sigma | Mean | Median | Sigma |
| A | 15 | 79 | 12614 | 73.02 | 793 | 776 | 162.1 |
| A | 0 | 226 | 7548 | 41.77 | 793 | 776 | 162.1 |
| A | 12 | 194 | 7365 | 40.64 | 793 | 776 | 162.1 |
| B | 10 | 16 | 52994 | 346.45 | 797 | 780 | 150.7 |
| B | 0 | 219 | 14946 | 93.99 | 797 | 780 | 150.7 |
| B | 12 | 111 | 14880 | 93.56 | 797 | 780 | 150.7 |
| C | 1 | 16 | 814769 | 4538.24 | 778 | 783 | 179.4 |
| C | 13 | 61 | 5874 | 28.38 | 778 | 783 | 179.4 |
| C | 14 | 67 | 2678 | 10.57 | 778 | 783 | 179.4 |
| D | 5 | 233 | 72881 | 377.48 | 781 | 759 | 191.1 |
| D | 7 | 71 | 52254 | 269.52 | 781 | 759 | 191.1 |
| D | 2 | 234 | 24251 | 122.96 | 781 | 759 | 191.1 |
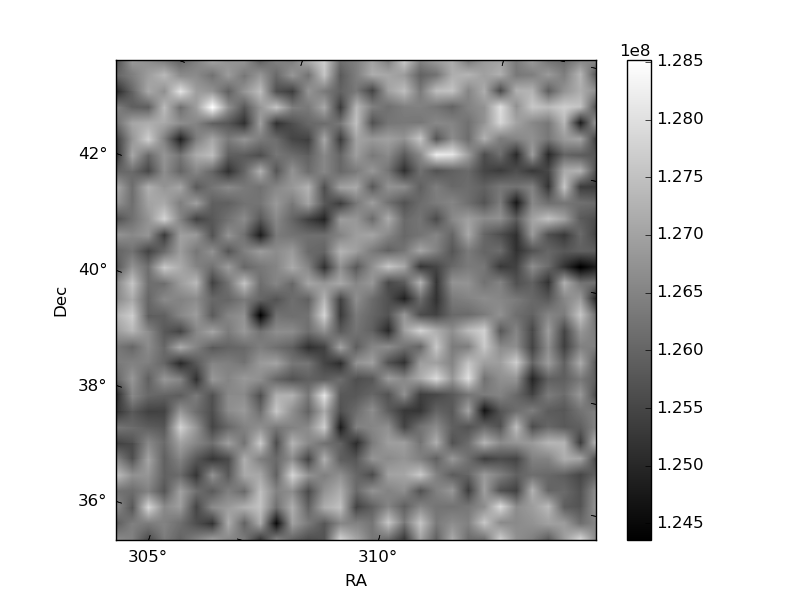
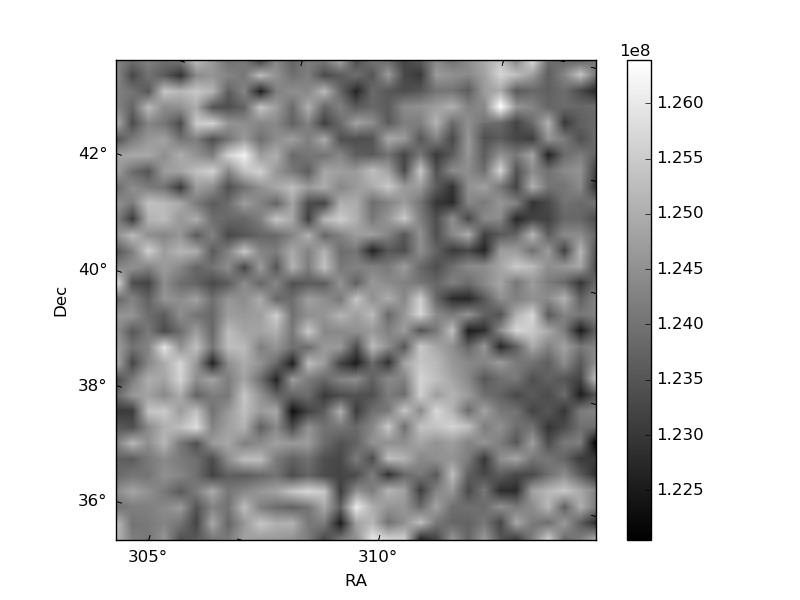
Histogram calculated using DETX and DETY for each event in the final _common_clean file
| Quadrant A | 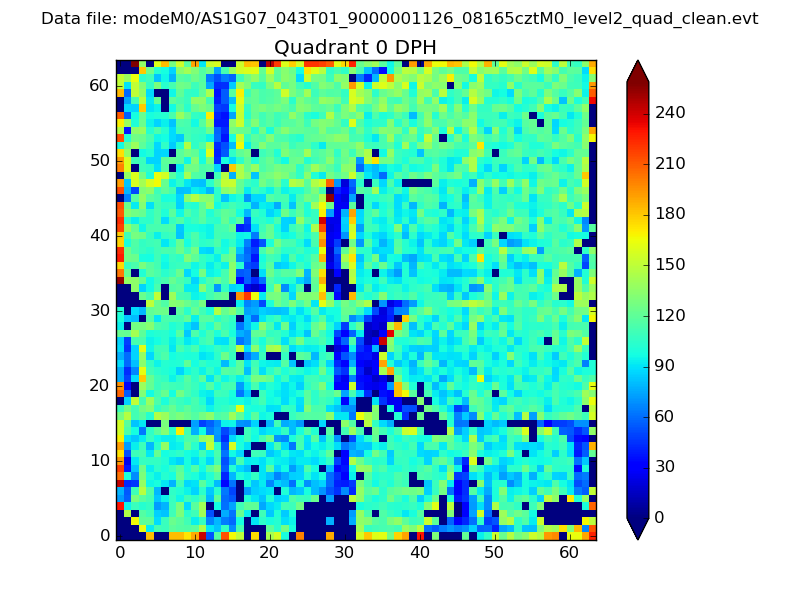 |
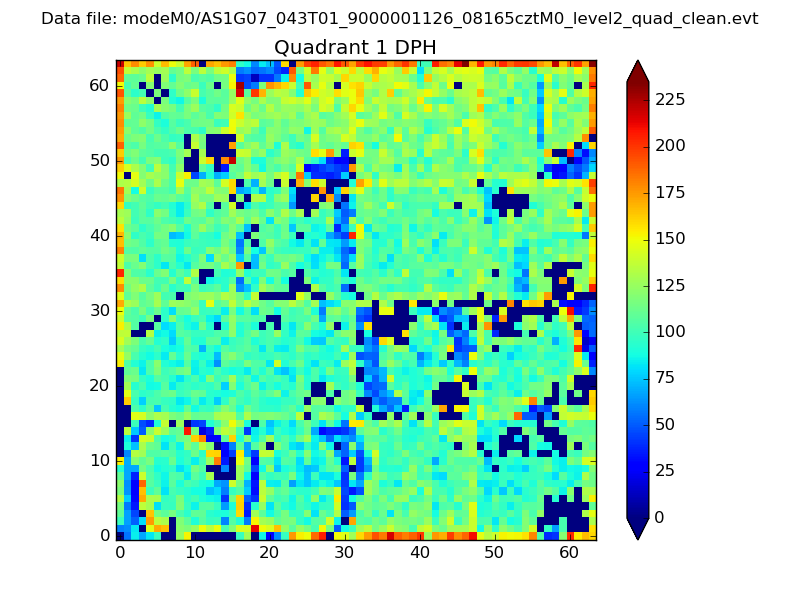 |
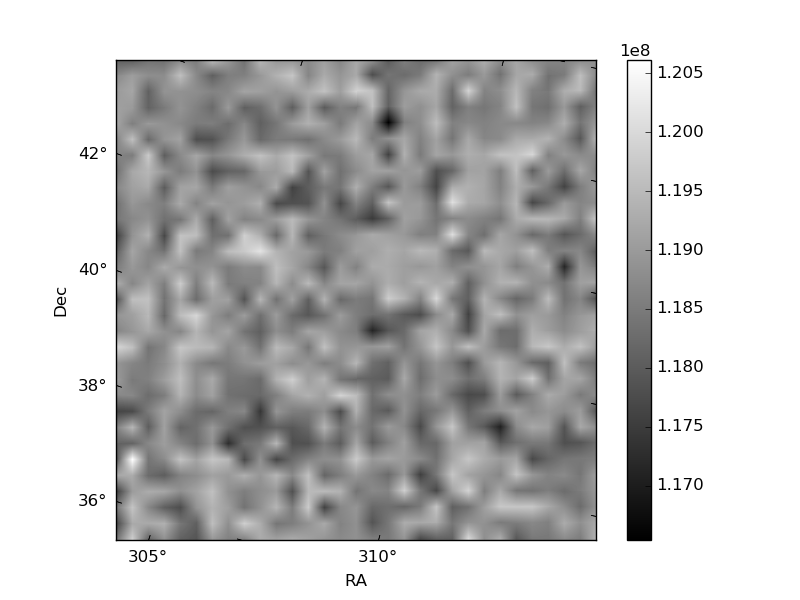
Quadrant B |
|---|---|---|---|
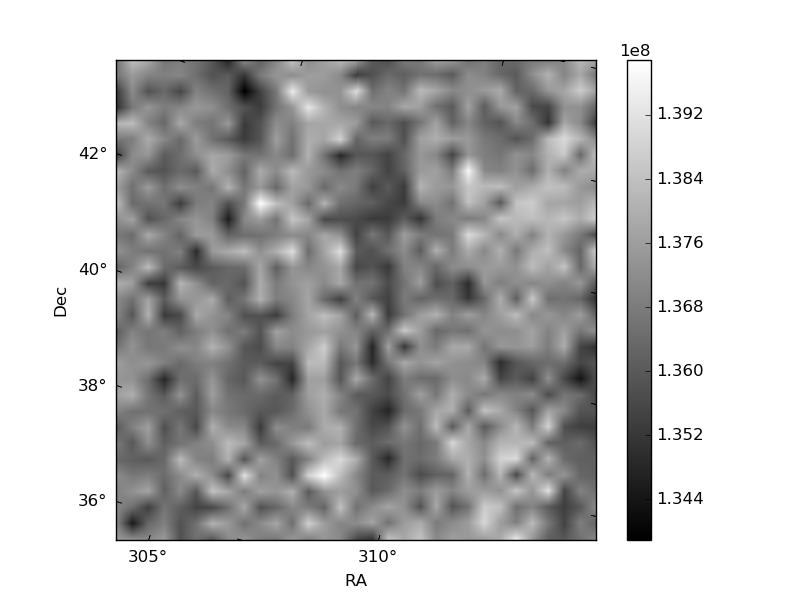
| Quadrant D | 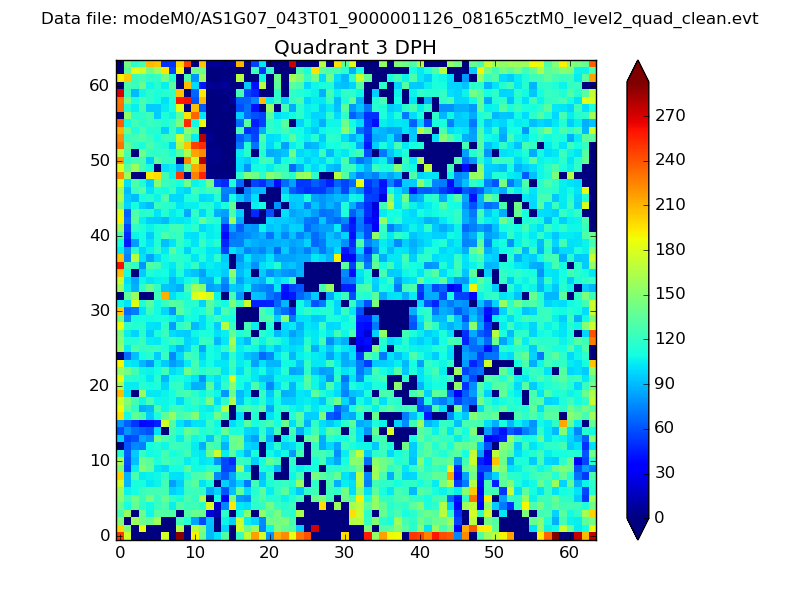 |
 |
Quadrant C |
| Plot type | Count rate plots | Images |
|---|---|---|
| Comparison with Poisson distribution Blue bars denote a histogram of data divided into 1 sec bins. Red curve is a Poisson curve with rate = median count rate of data. |
 |
 |
| Quadrant-wise count rates Data is divided into 100 sec bins |
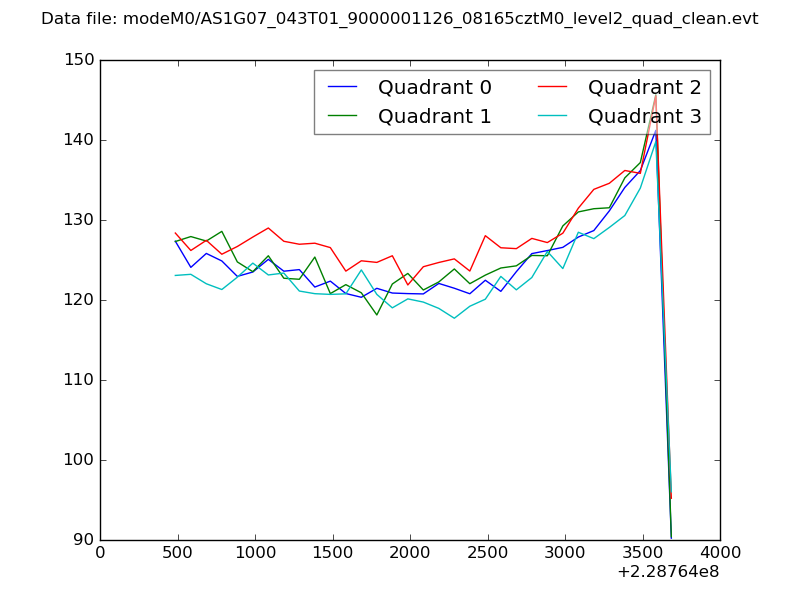 |
|
| Module-wise count rates for Quadrant A Data is divided into 100 sec bins |
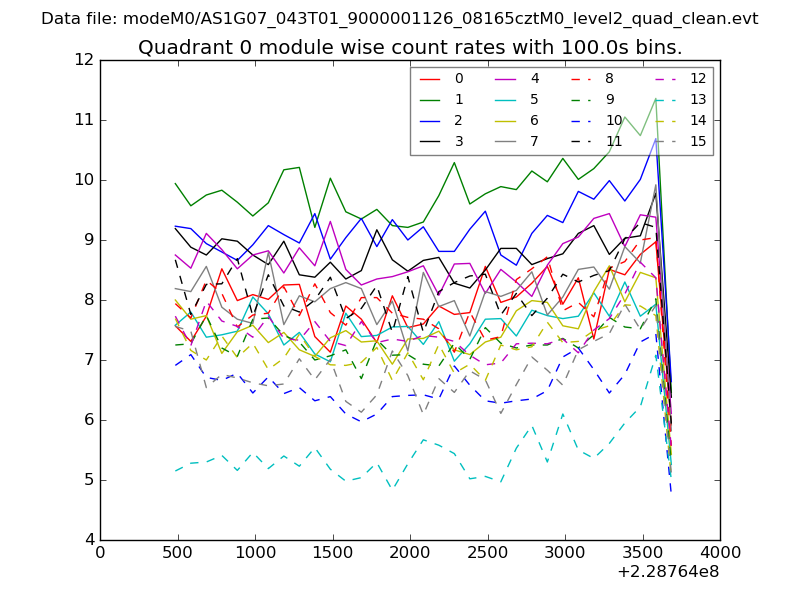 |
 |
| Module-wise count rates for Quadrant B Data is divided into 100 sec bins |
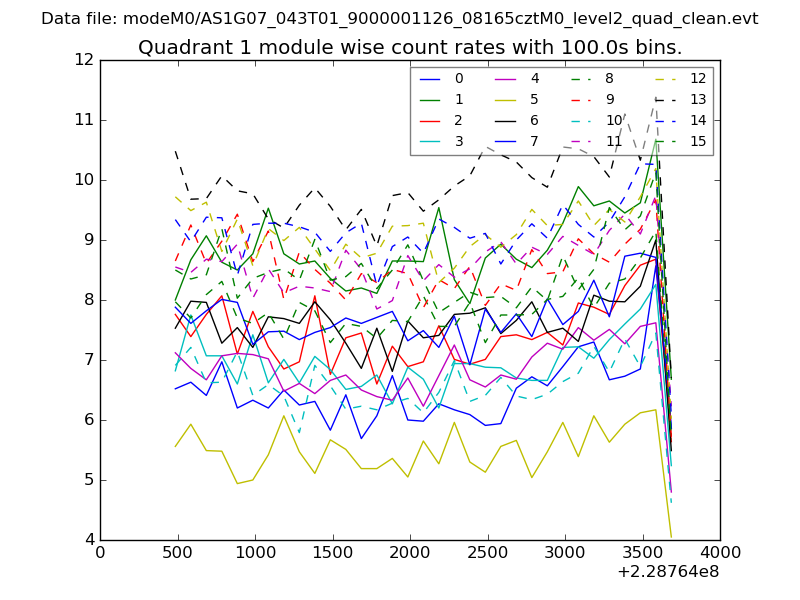 |
 |
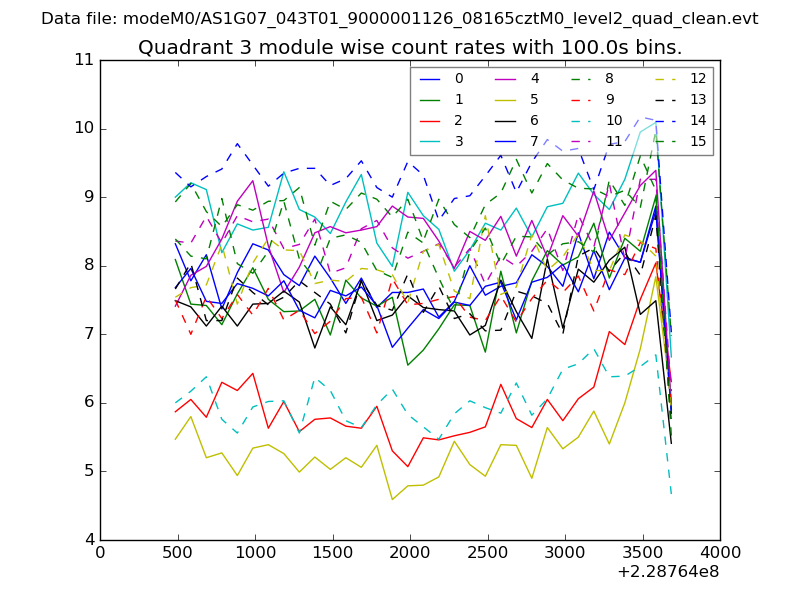
| Module-wise count rates for Quadrant C Data is divided into 100 sec bins |
 |
 |
| Module-wise count rates for Quadrant D Data is divided into 100 sec bins |
 |
 |
| Parameter | Plot |
|---|---|
| CZT HV Monitor |  |
| D_VDD | 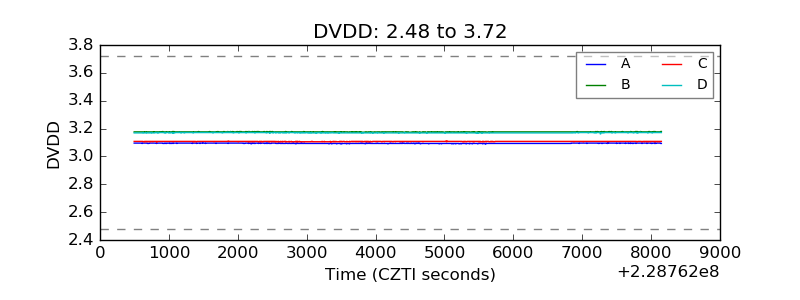 |
| Temperature 1 | 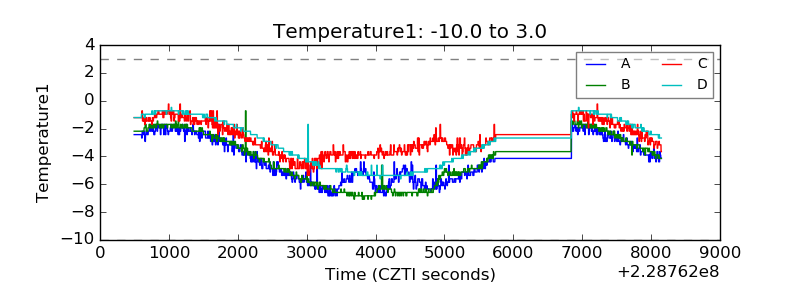 |
| Veto HV Monitor | 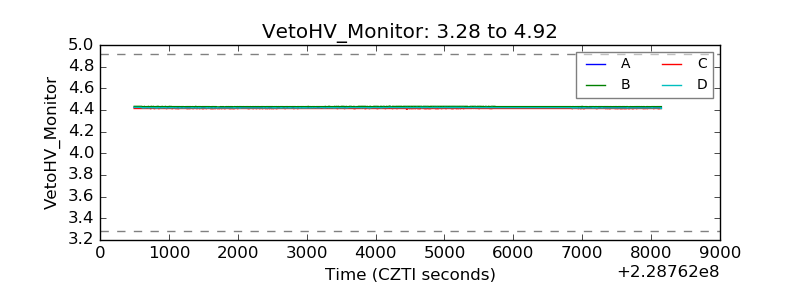 |
| Veto LLD | 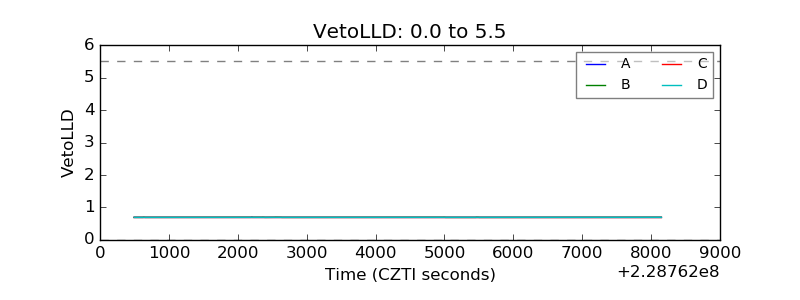 |
| Alpha Counter | 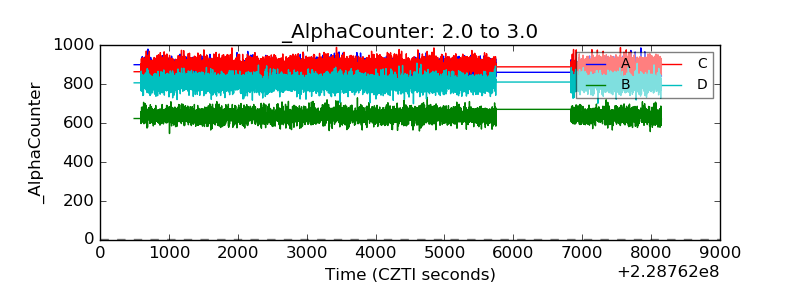 |
| _CPM_Rate | 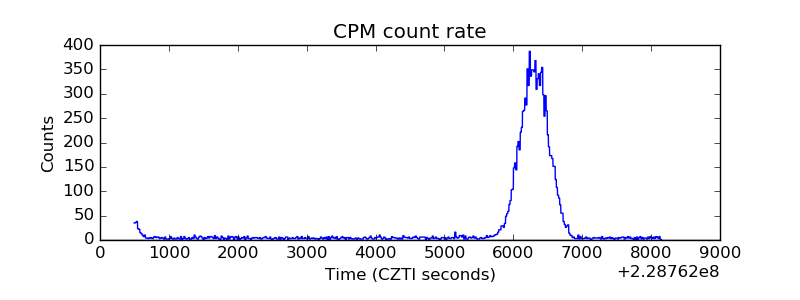 |
| CZT Counter | 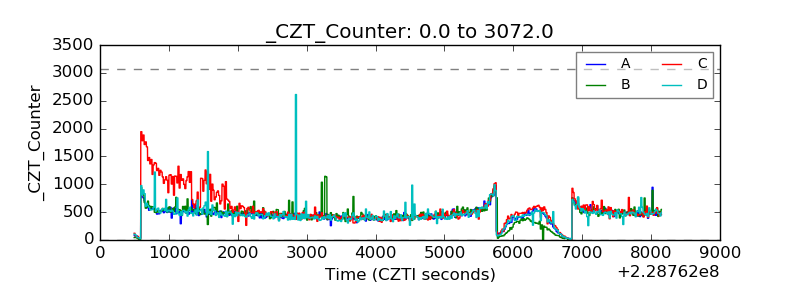 |
| +2.5 Volts monitor |  |
| +5 Volts monitor |  |
| _ROLL_ROT | 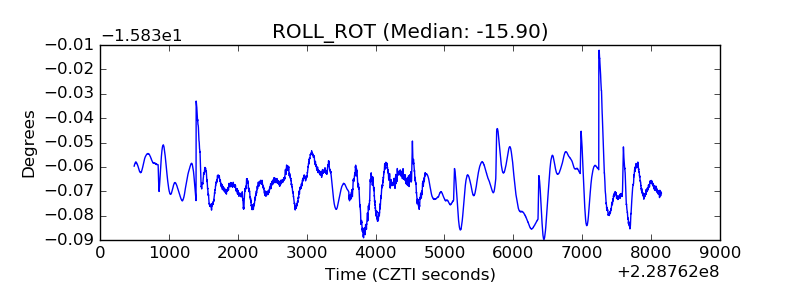 |
| _Roll_DEC | 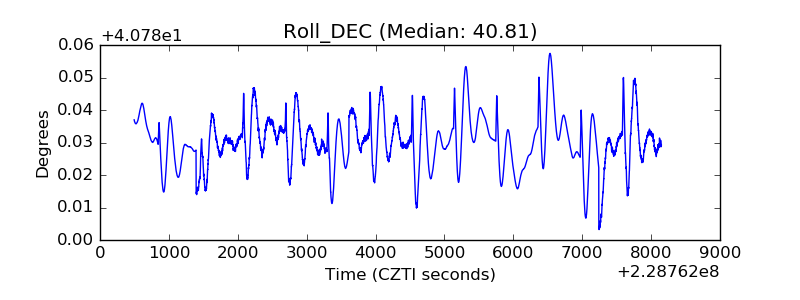 |
| _Roll_RA | 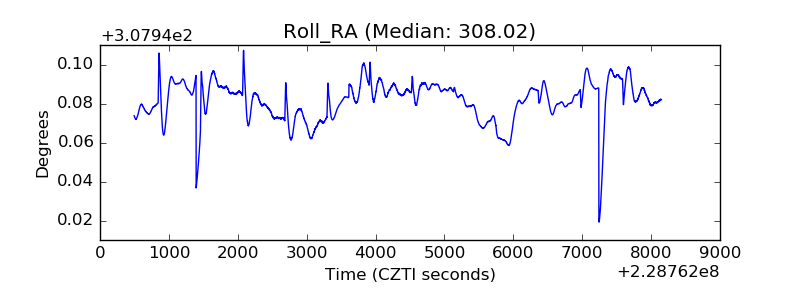 |
| Veto Counter | 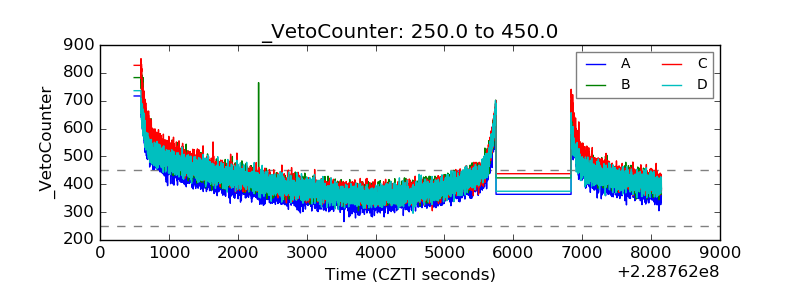 |