| Param | Original file | Final file |
|---|---|---|
| Filename | modeM0/AS1G07_043T01_9000001126_08167cztM0_level2.evt | modeM0/AS1G07_043T01_9000001126_08167cztM0_level2_quad_clean.evt |
| Size (bytes) | 519,958,080 | 93,225,600 |
| Size | 495.9 MB | 88.9 MB |
| Events in quadrant A | 3,769,360 | 566,349 |
| Events in quadrant B | 3,872,603 | 574,688 |
| Events in quadrant C | 3,703,629 | 581,563 |
| Events in quadrant D | 3,874,601 | 561,499 |
| Mode M0 | |||
|---|---|---|---|
| Quadrant | BADHDUFLAG | Total packets | Discarded packets |
| A | 0 | 16430 | 3 |
| B | 0 | 16818 | 2 |
| C | 0 | 16366 | 2 |
| D | 0 | 16918 | 2 |
| Mode SS | |||
|---|---|---|---|
| Quadrant | BADHDUFLAG | Total packets | Discarded packets |
| A | 0 | 160 | 0 |
| B | 0 | 160 | 0 |
| C | 0 | 160 | 0 |
| D | 0 | 160 | 0 |
| Mode M9 | |||
|---|---|---|---|
| Quadrant | BADHDUFLAG | Total packets | Discarded packets |
| A | 0 | 11 | 0 |
| B | 0 | 11 | 0 |
| C | 0 | 11 | 0 |
| D | 0 | 11 | 0 |
| Quadrant | Total seconds | Saturated seconds | Saturation percentage |
|---|---|---|---|
| A | 7756 | 153 | 1.972666% |
| B | 7756 | 190 | 2.449716% |
| C | 7756 | 165 | 2.127385% |
| D | 7756 | 179 | 2.307891% |
Noise dominated data is calculated using 1-second bins in cleaned event files. If a bin has >2000 counts, and if more than 50% of those come from <1% of pixels, then it is considered to be noise-dominated and hence unusable.
| Quadrant | # 1 sec bins | Bins with >0 counts | Bins with >2000 counts | High rate bins dominated by noise | Noise dominated (total time) | Noise dominated (detector-on time) | Marked lightcurve |
|---|---|---|---|---|---|---|---|
| A | 8766 | 7759 | 15 | 15 | 0.17% | 0.19% | 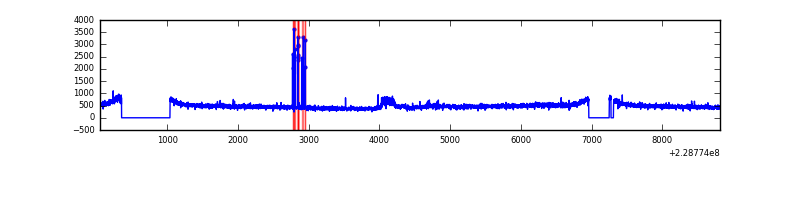 |
| B | 8766 | 7759 | 11 | 11 | 0.13% | 0.14% | 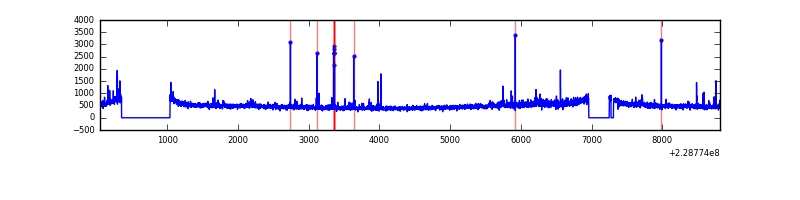 |
| C | 8766 | 7759 | 0 | 0 | 0.00% | 0.00% | 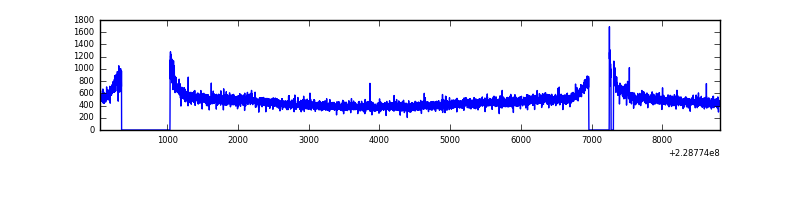 |
| D | 8766 | 7759 | 19 | 19 | 0.22% | 0.24% | 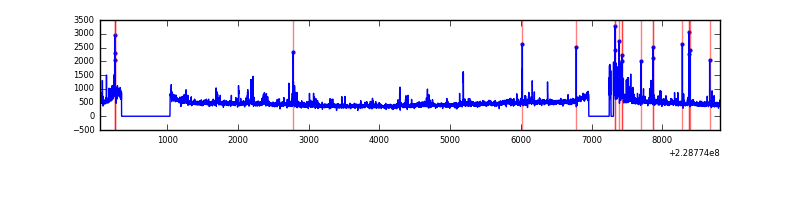 |
Top three noisy pixels from each quadrant. If the there are fewer than three noisy pixels in the level2.evt file, extra rows are filled as -1
| Pixel properties | Quadrant properties | ||||||
|---|---|---|---|---|---|---|---|
| Quadrant | DetID | PixID | Counts | Sigma | Mean | Median | Sigma |
| A | 15 | 79 | 112434 | 585.37 | 932 | 908 | 190.5 |
| A | 0 | 23 | 54671 | 282.19 | 932 | 908 | 190.5 |
| A | 0 | 226 | 12529 | 61.0 | 932 | 908 | 190.5 |
| B | 0 | 214 | 89994 | 493.53 | 937 | 910 | 180.5 |
| B | 10 | 16 | 61543 | 335.91 | 937 | 910 | 180.5 |
| B | 0 | 219 | 28612 | 153.47 | 937 | 910 | 180.5 |
| C | 1 | 16 | 121580 | 565.84 | 916 | 919 | 213.2 |
| C | 13 | 61 | 7133 | 29.14 | 916 | 919 | 213.2 |
| C | 8 | 128 | 4379 | 16.23 | 916 | 919 | 213.2 |
| D | 5 | 233 | 174344 | 778.1 | 916 | 888 | 222.9 |
| D | 6 | 225 | 67317 | 297.99 | 916 | 888 | 222.9 |
| D | 12 | 233 | 55844 | 246.53 | 916 | 888 | 222.9 |
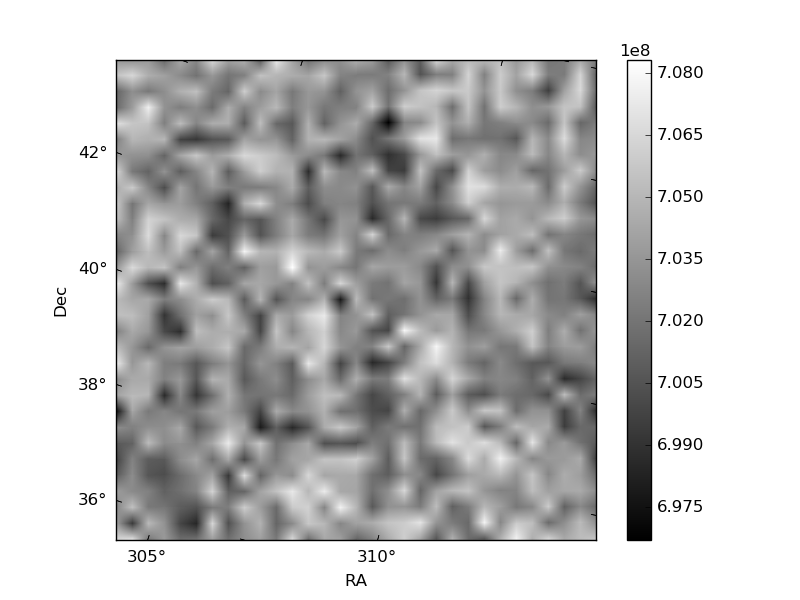
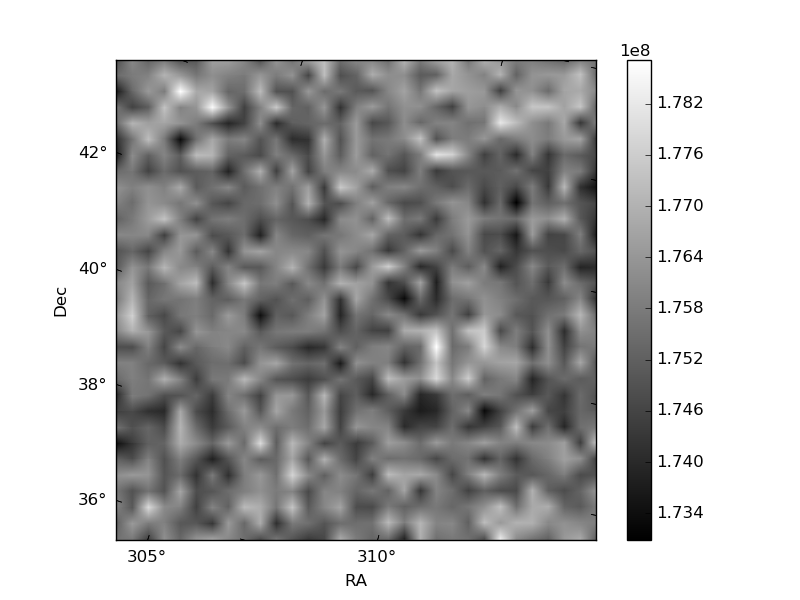
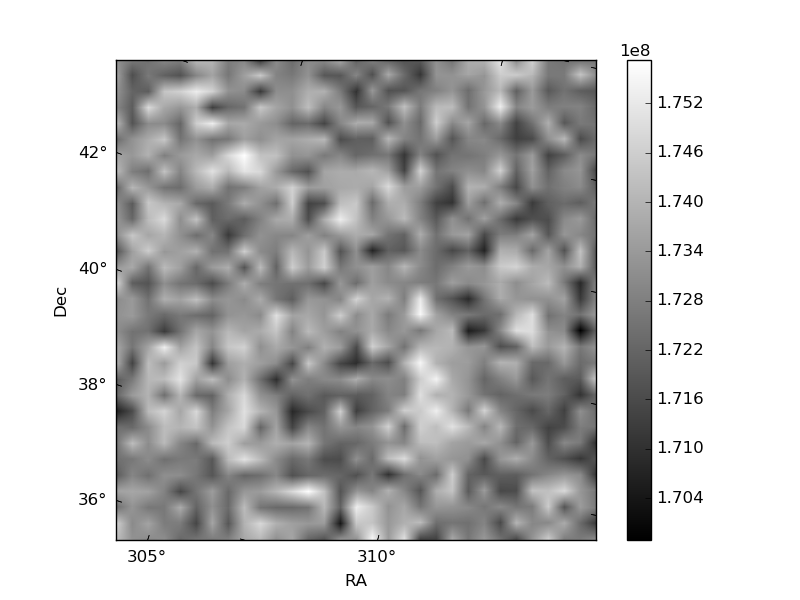
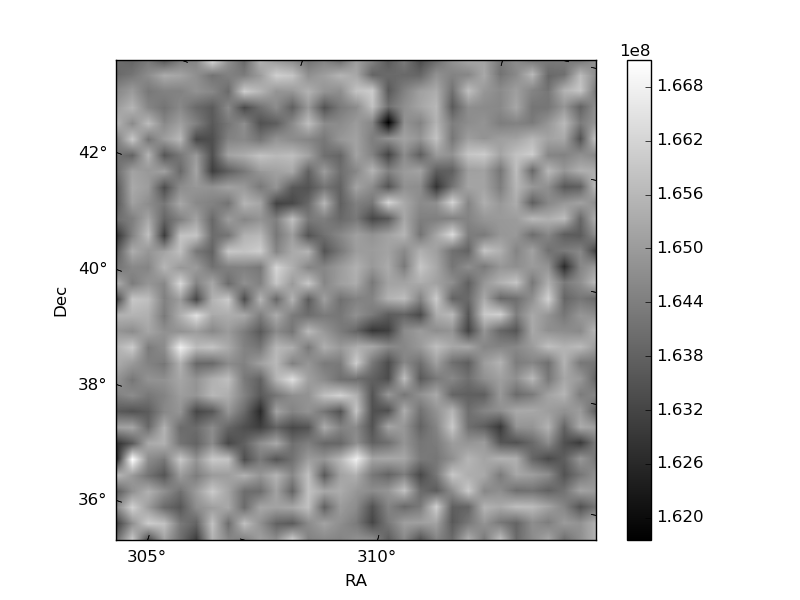
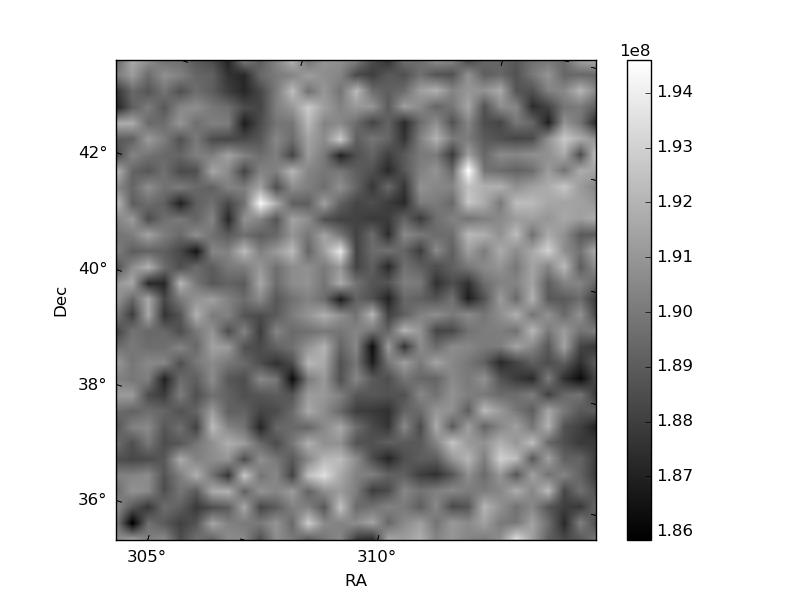
Histogram calculated using DETX and DETY for each event in the final _common_clean file
| Quadrant A | 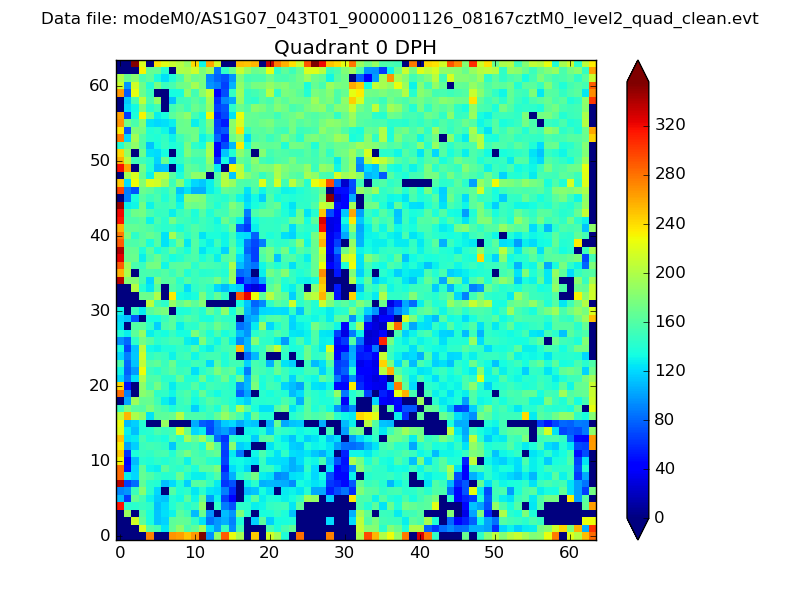 |
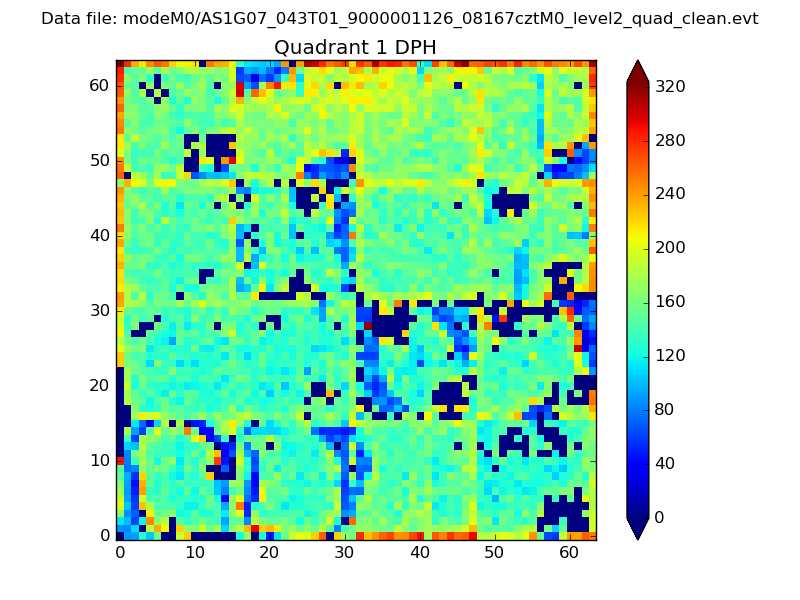 |
Quadrant B |
|---|---|---|---|
| Quadrant D | 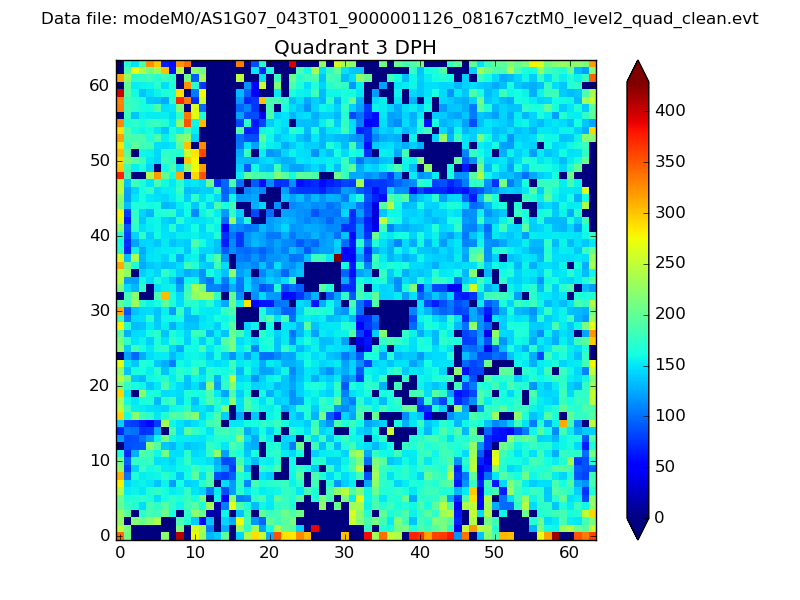 |
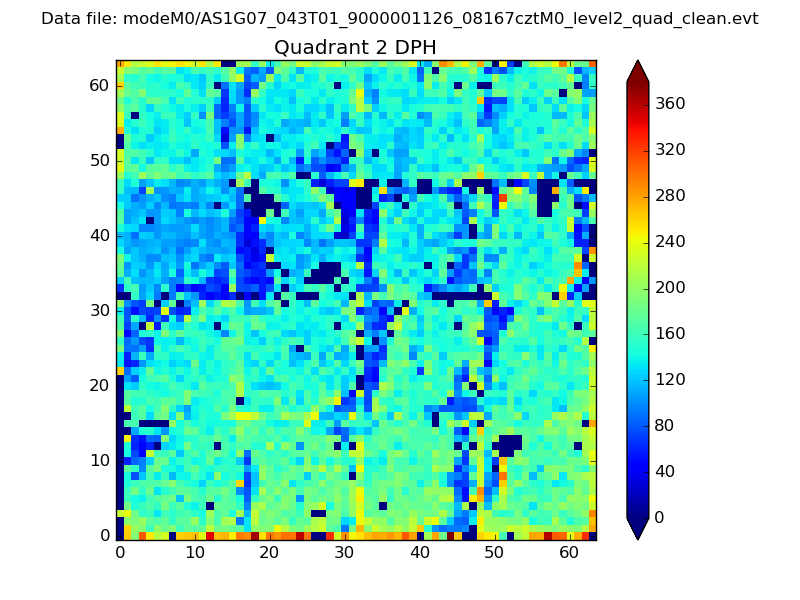 |
Quadrant C |
| Plot type | Count rate plots | Images |
|---|---|---|
| Comparison with Poisson distribution Blue bars denote a histogram of data divided into 1 sec bins. Red curve is a Poisson curve with rate = median count rate of data. |
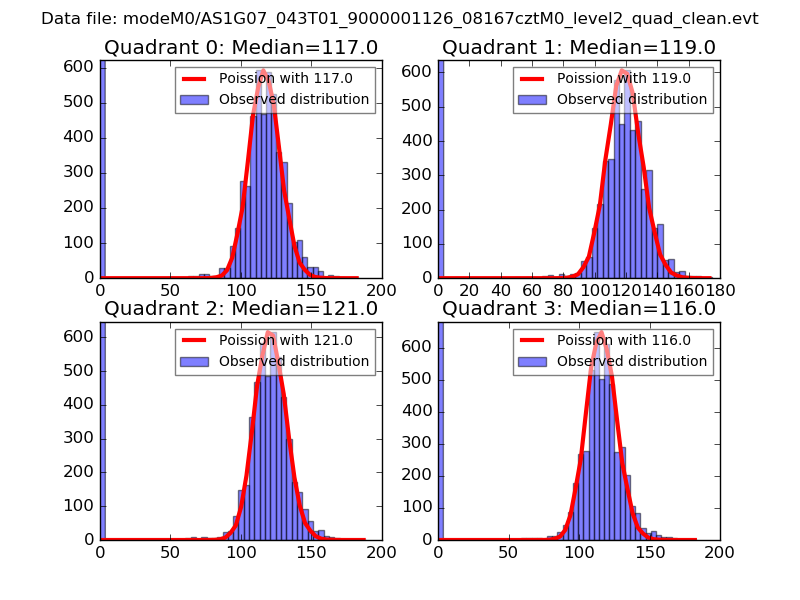 |
 |
| Quadrant-wise count rates Data is divided into 100 sec bins |
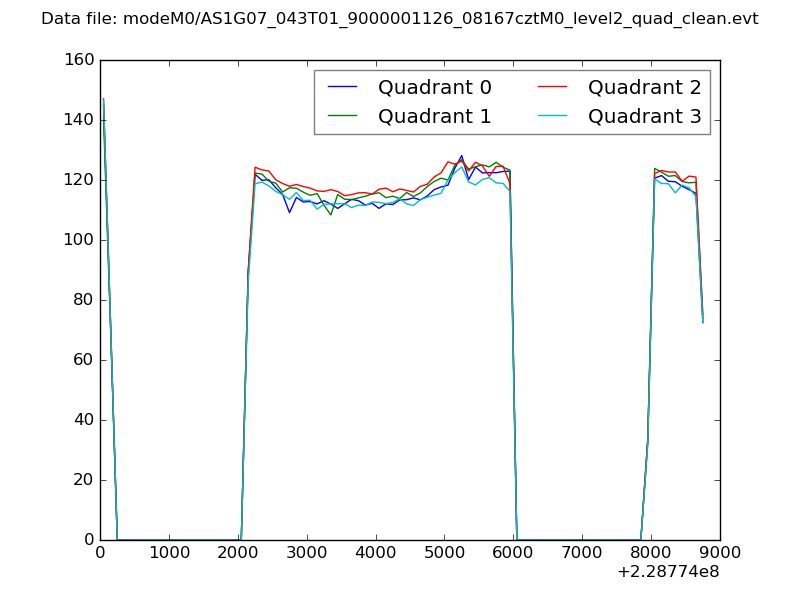 |
|
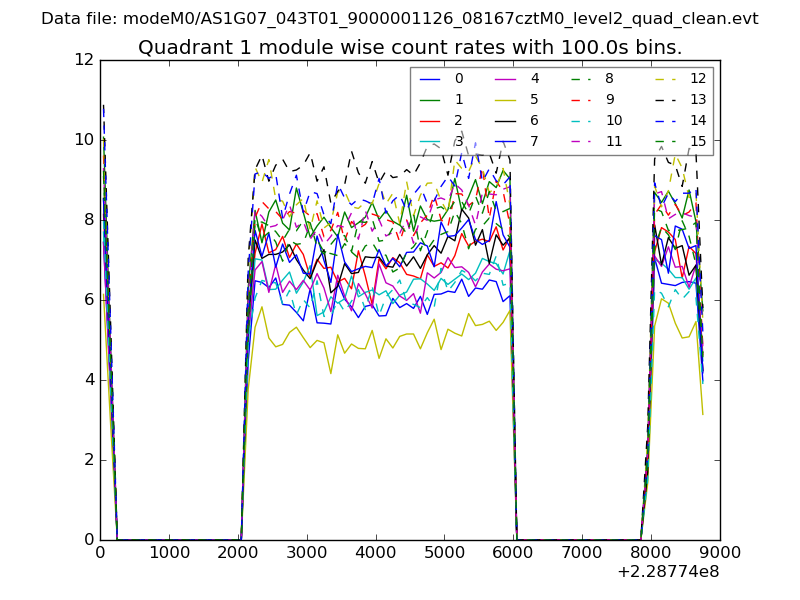
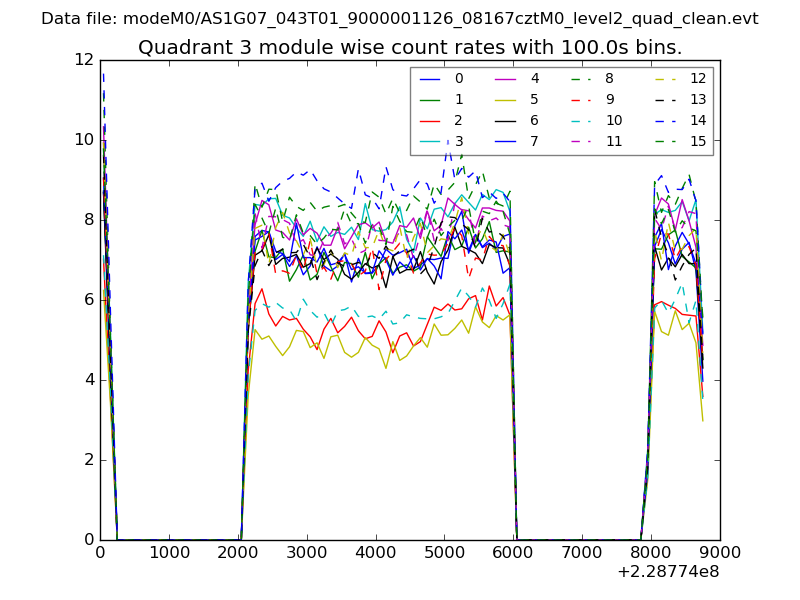
| Module-wise count rates for Quadrant A Data is divided into 100 sec bins |
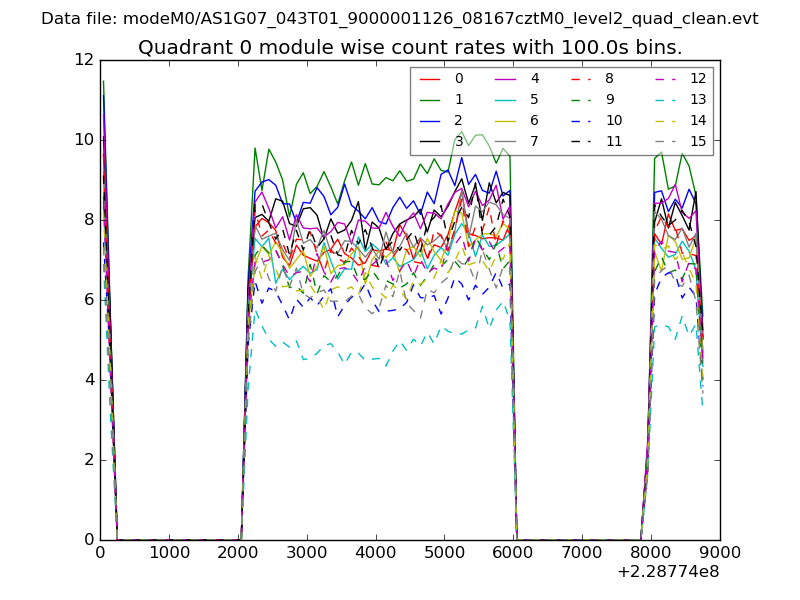 |
 |
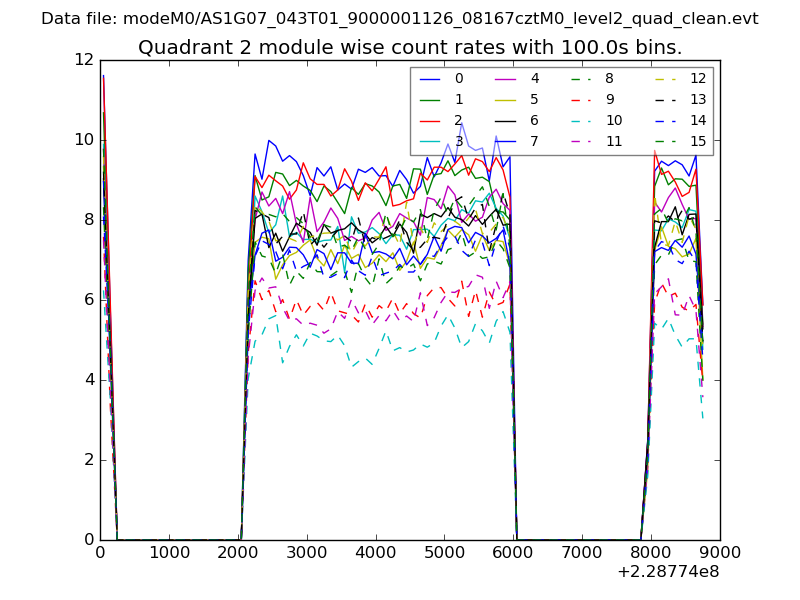
| Module-wise count rates for Quadrant B Data is divided into 100 sec bins |
 |
 |
| Module-wise count rates for Quadrant C Data is divided into 100 sec bins |
 |
 |
| Module-wise count rates for Quadrant D Data is divided into 100 sec bins |
 |
 |
| Parameter | Plot |
|---|---|
| CZT HV Monitor | 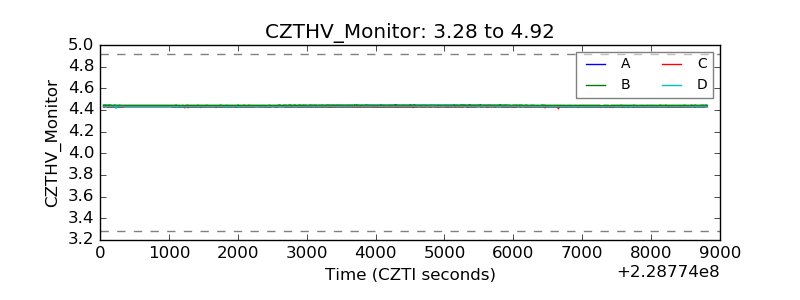 |
| D_VDD | 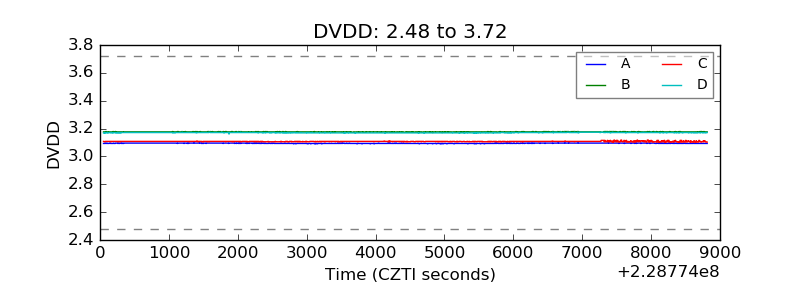 |
| Temperature 1 | 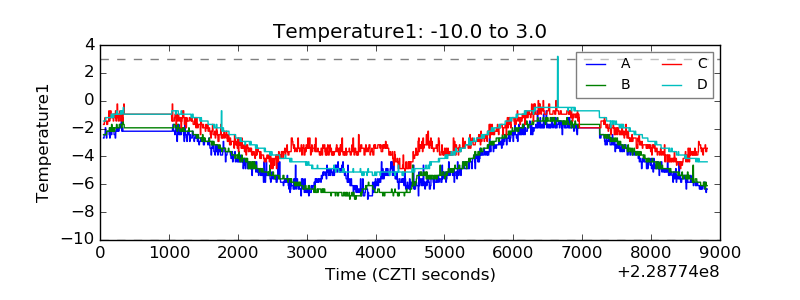 |
| Veto HV Monitor | 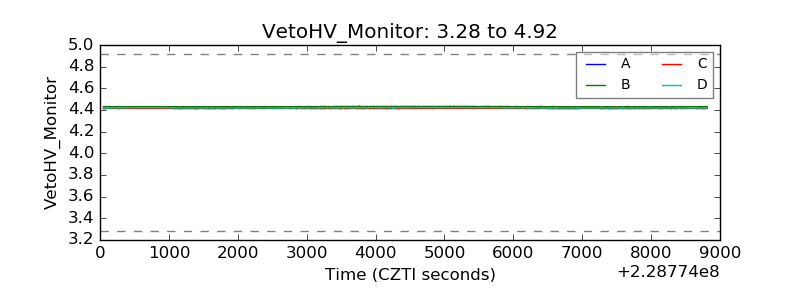 |
| Veto LLD | 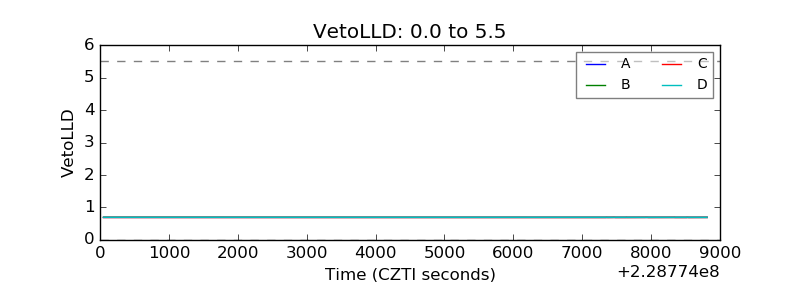 |
| Alpha Counter | 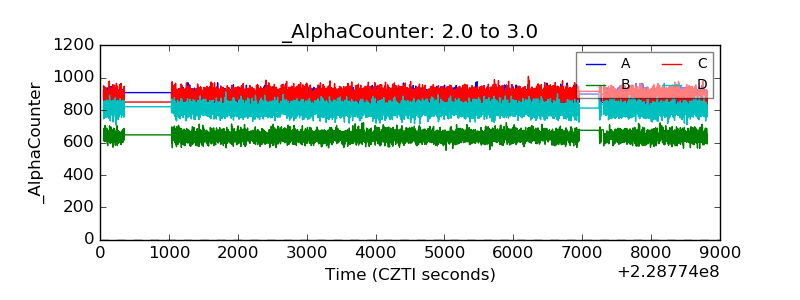 |
| _CPM_Rate | 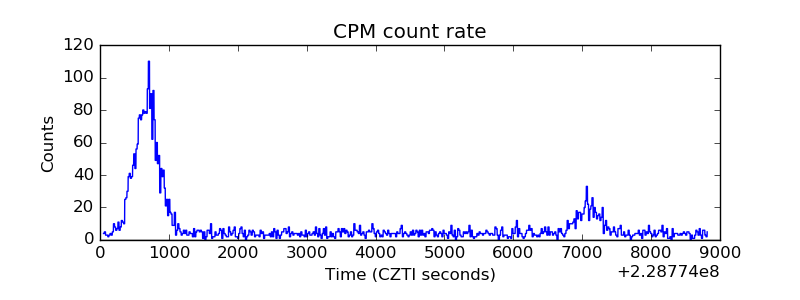 |
| CZT Counter | 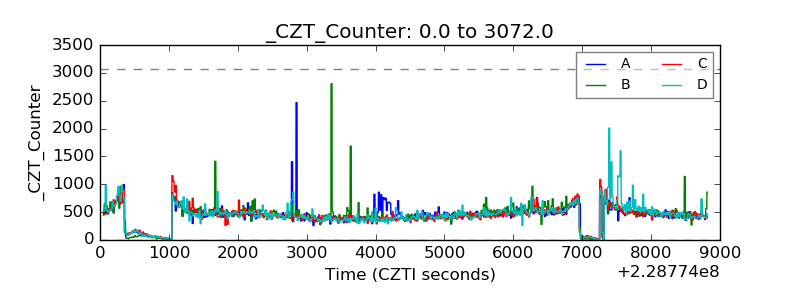 |
| +2.5 Volts monitor |  |
| +5 Volts monitor |  |
| _ROLL_ROT | 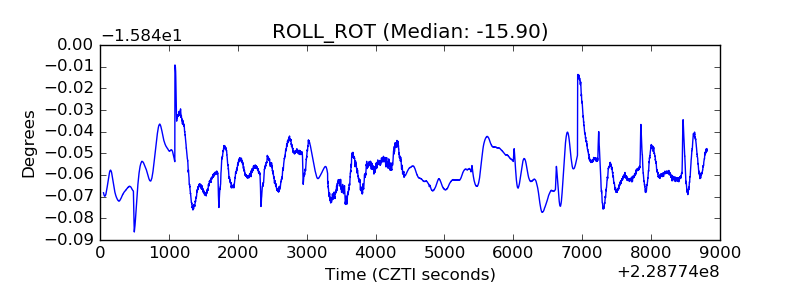 |
| _Roll_DEC | 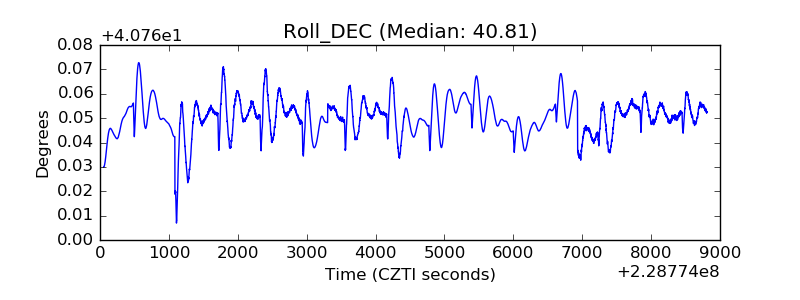 |
| _Roll_RA | 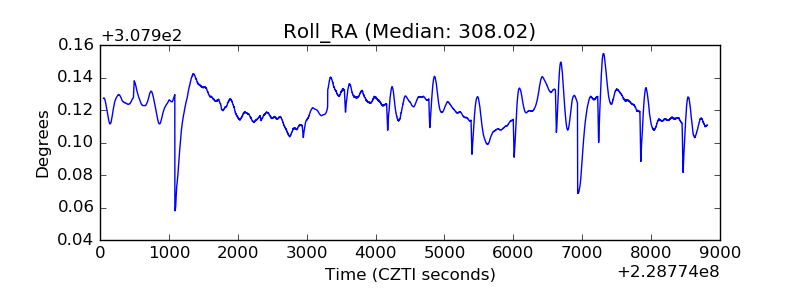 |
| Veto Counter | 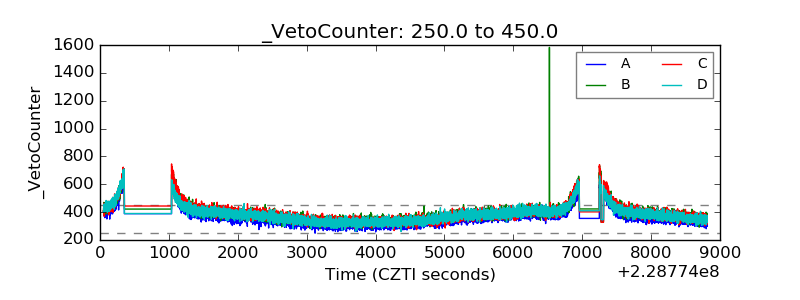 |