| Param | Original file | Final file |
|---|---|---|
| Filename | modeM0/AS1G07_043T01_9000001126_08168cztM0_level2.evt | modeM0/AS1G07_043T01_9000001126_08168cztM0_level2_quad_clean.evt |
| Size (bytes) | 524,905,920 | 95,886,720 |
| Size | 500.6 MB | 91.4 MB |
| Events in quadrant A | 3,857,930 | 584,933 |
| Events in quadrant B | 3,871,133 | 595,710 |
| Events in quadrant C | 3,694,353 | 602,743 |
| Events in quadrant D | 3,942,757 | 577,368 |
| Mode M0 | |||
|---|---|---|---|
| Quadrant | BADHDUFLAG | Total packets | Discarded packets |
| A | 0 | 17070 | 3 |
| B | 0 | 16819 | 2 |
| C | 0 | 16493 | 2 |
| D | 0 | 17169 | 2 |
| Mode SS | |||
|---|---|---|---|
| Quadrant | BADHDUFLAG | Total packets | Discarded packets |
| A | 0 | 162 | 0 |
| B | 0 | 162 | 0 |
| C | 0 | 162 | 0 |
| D | 0 | 162 | 0 |
| Mode M9 | |||
|---|---|---|---|
| Quadrant | BADHDUFLAG | Total packets | Discarded packets |
| A | 0 | 6 | 0 |
| B | 0 | 6 | 0 |
| C | 0 | 6 | 0 |
| D | 0 | 6 | 0 |
| Quadrant | Total seconds | Saturated seconds | Saturation percentage |
|---|---|---|---|
| A | 7810 | 104 | 1.331626% |
| B | 7810 | 156 | 1.997439% |
| C | 7810 | 120 | 1.536492% |
| D | 7810 | 118 | 1.510883% |
Noise dominated data is calculated using 1-second bins in cleaned event files. If a bin has >2000 counts, and if more than 50% of those come from <1% of pixels, then it is considered to be noise-dominated and hence unusable.
| Quadrant | # 1 sec bins | Bins with >0 counts | Bins with >2000 counts | High rate bins dominated by noise | Noise dominated (total time) | Noise dominated (detector-on time) | Marked lightcurve |
|---|---|---|---|---|---|---|---|
| A | 8350 | 7813 | 0 | 0 | 0.00% | 0.00% | 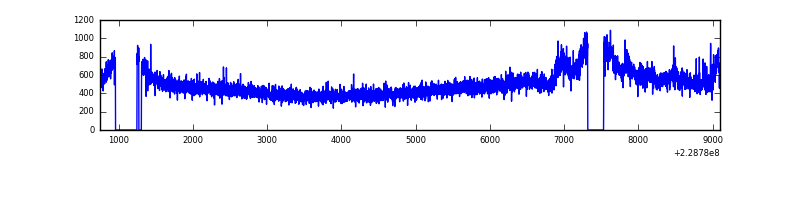 |
| B | 8350 | 7813 | 17 | 17 | 0.20% | 0.22% | 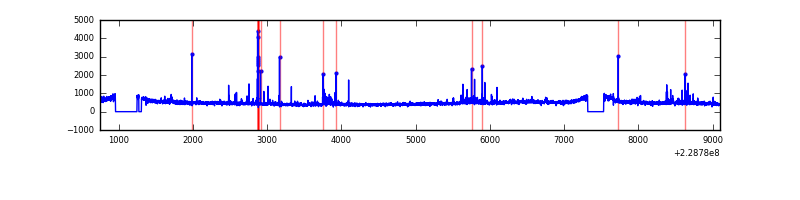 |
| C | 8350 | 7813 | 0 | 0 | 0.00% | 0.00% | 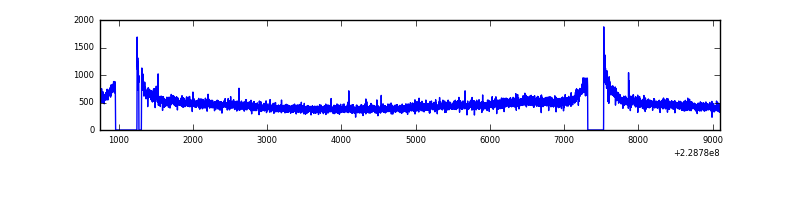 |
| D | 8350 | 7813 | 29 | 29 | 0.35% | 0.37% | 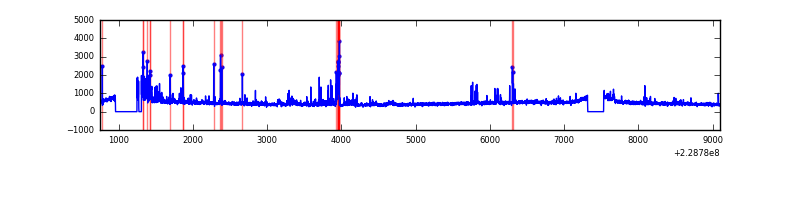 |
Top three noisy pixels from each quadrant. If the there are fewer than three noisy pixels in the level2.evt file, extra rows are filled as -1
| Pixel properties | Quadrant properties | ||||||
|---|---|---|---|---|---|---|---|
| Quadrant | DetID | PixID | Counts | Sigma | Mean | Median | Sigma |
| A | 15 | 79 | 270265 | 1402.35 | 928 | 905 | 192.1 |
| A | 0 | 226 | 8945 | 41.86 | 928 | 905 | 192.1 |
| A | 13 | 254 | 8618 | 40.16 | 928 | 905 | 192.1 |
| B | 10 | 16 | 68941 | 381.38 | 936 | 912 | 178.4 |
| B | 4 | 81 | 51393 | 283.01 | 936 | 912 | 178.4 |
| B | 0 | 214 | 44226 | 242.83 | 936 | 912 | 178.4 |
| C | 1 | 16 | 103645 | 483.88 | 914 | 918 | 212.3 |
| C | 8 | 128 | 11997 | 52.19 | 914 | 918 | 212.3 |
| C | 13 | 61 | 7175 | 29.47 | 914 | 918 | 212.3 |
| D | 5 | 233 | 235317 | 1047.59 | 910 | 883 | 223.8 |
| D | 12 | 227 | 58383 | 256.94 | 910 | 883 | 223.8 |
| D | 12 | 233 | 53751 | 236.24 | 910 | 883 | 223.8 |
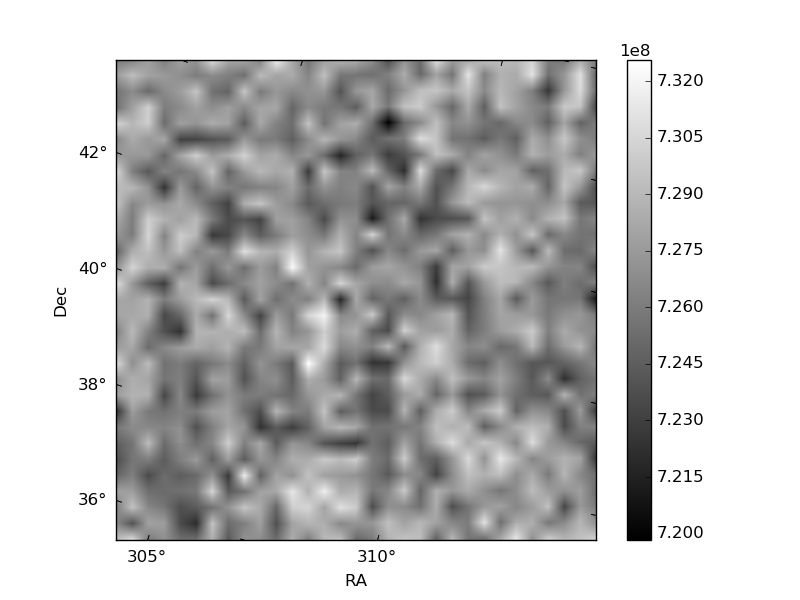
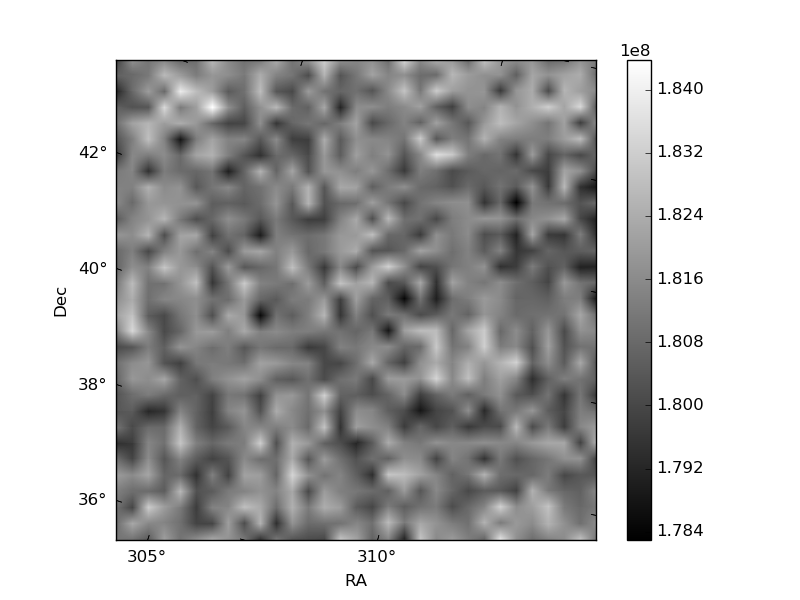
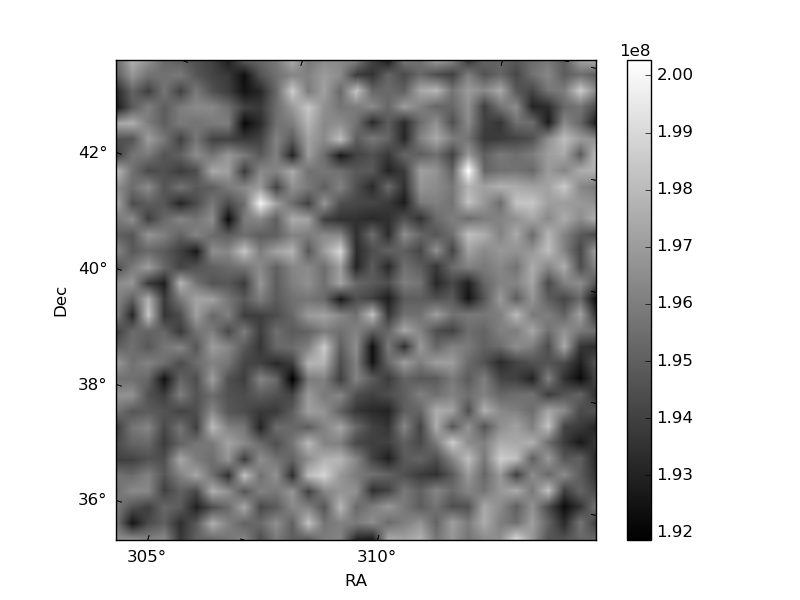
Histogram calculated using DETX and DETY for each event in the final _common_clean file
| Quadrant A | 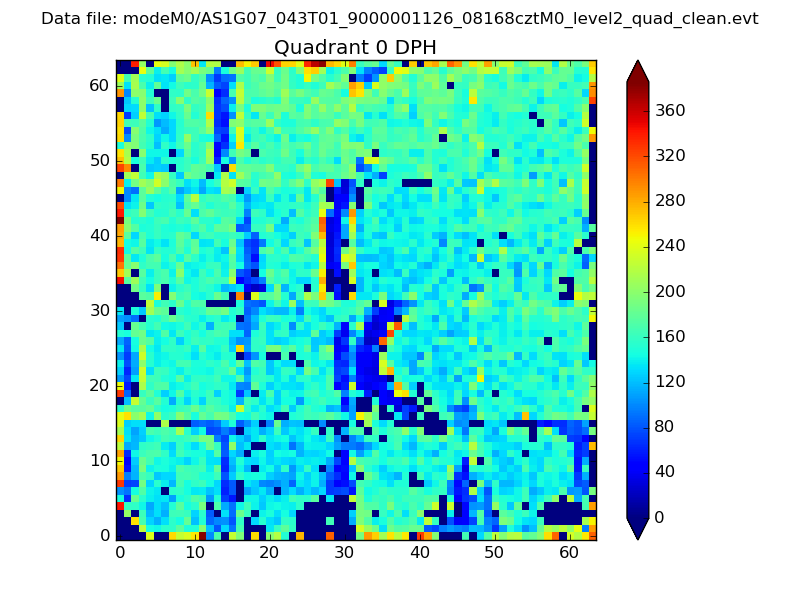 |
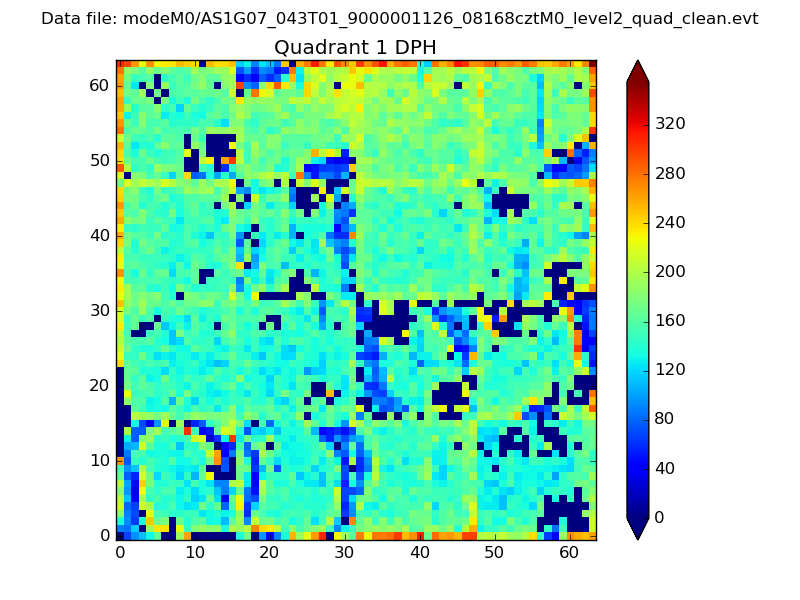 |
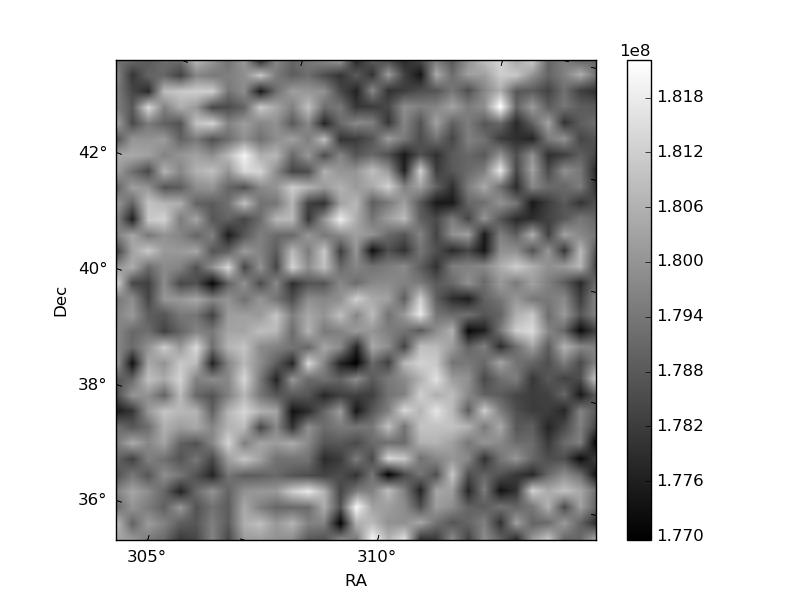
Quadrant B |
|---|---|---|---|
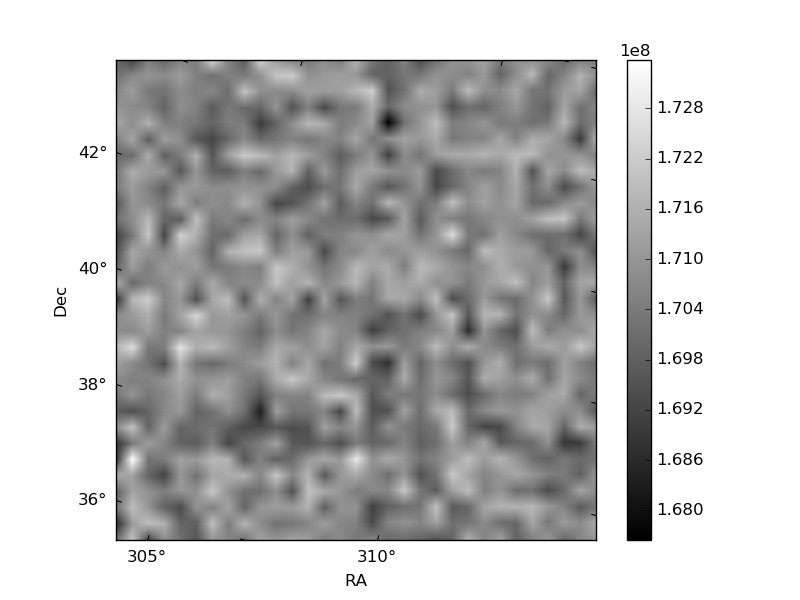
| Quadrant D | 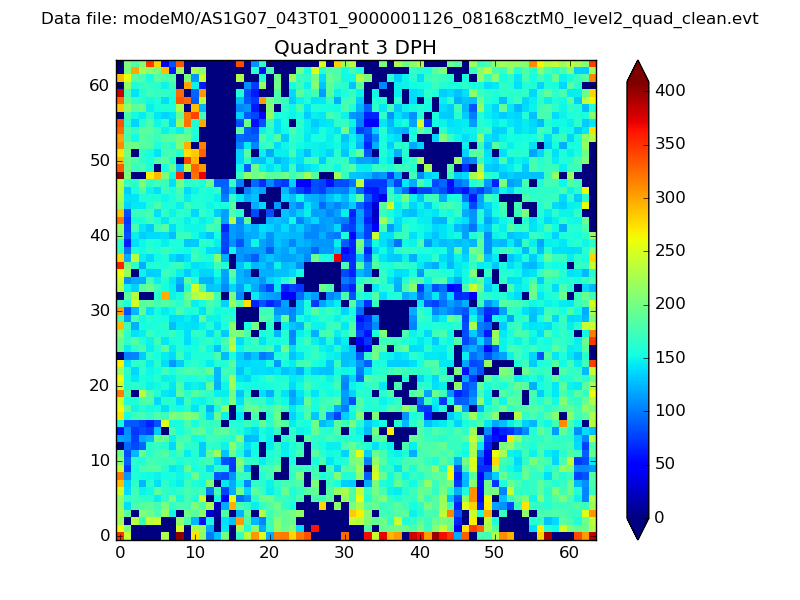 |
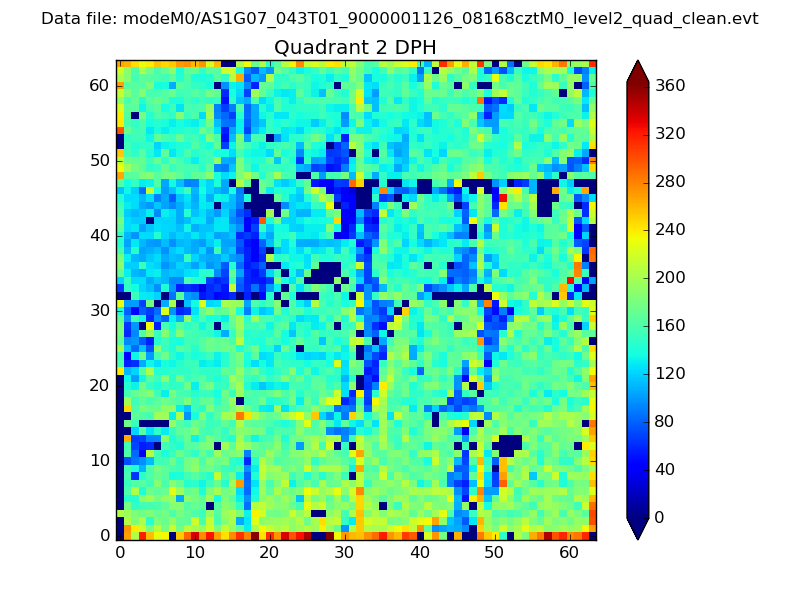 |
Quadrant C |
| Plot type | Count rate plots | Images |
|---|---|---|
| Comparison with Poisson distribution Blue bars denote a histogram of data divided into 1 sec bins. Red curve is a Poisson curve with rate = median count rate of data. |
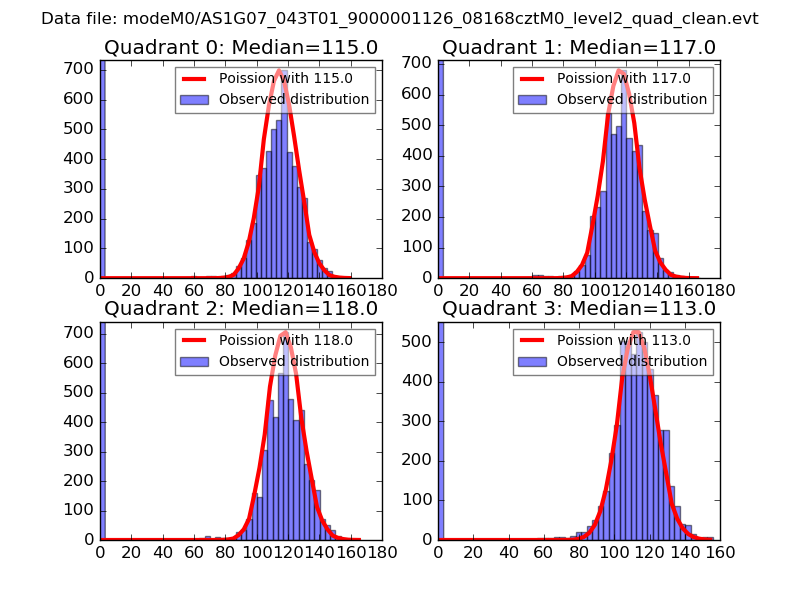 |
 |
| Quadrant-wise count rates Data is divided into 100 sec bins |
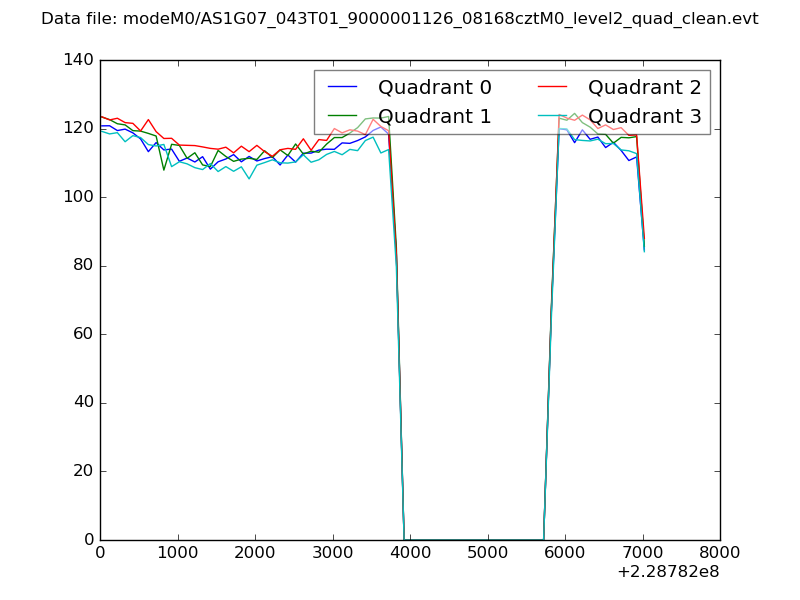 |
|
| Module-wise count rates for Quadrant A Data is divided into 100 sec bins |
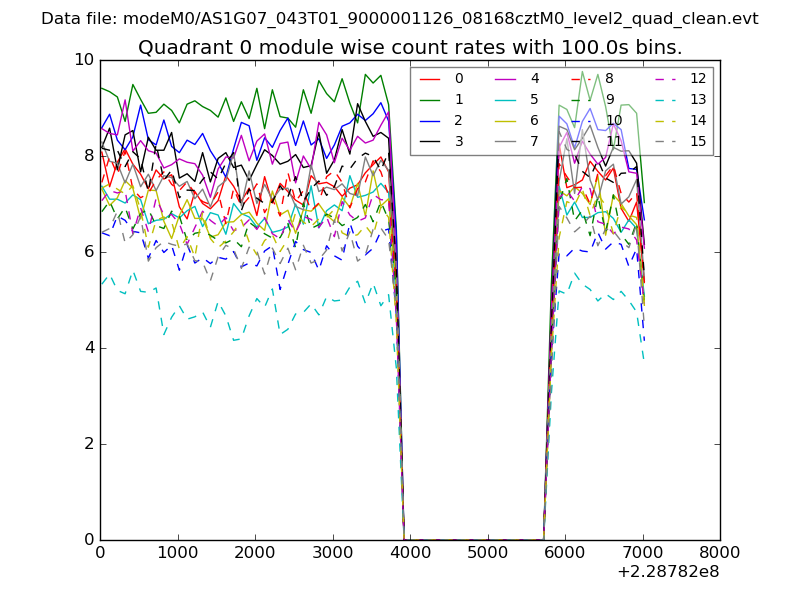 |
 |
| Module-wise count rates for Quadrant B Data is divided into 100 sec bins |
 |
 |
| Module-wise count rates for Quadrant C Data is divided into 100 sec bins |
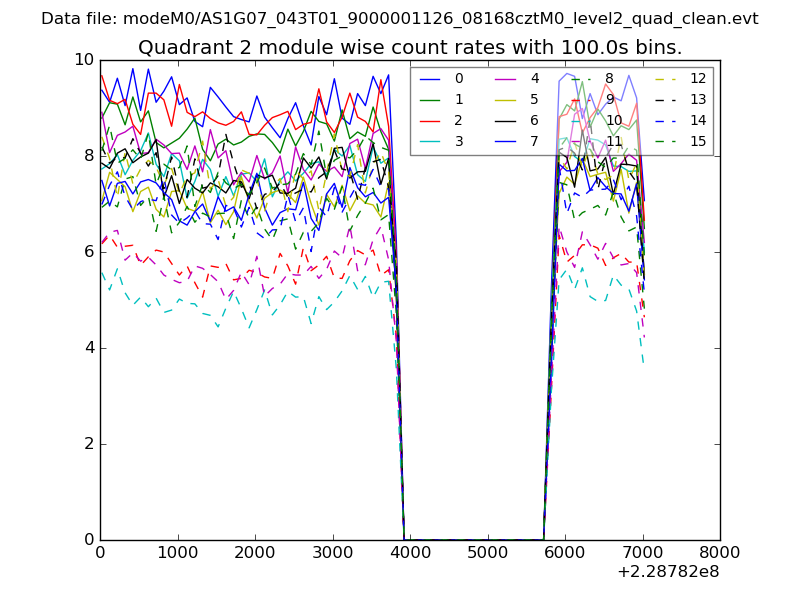 |
 |
| Module-wise count rates for Quadrant D Data is divided into 100 sec bins |
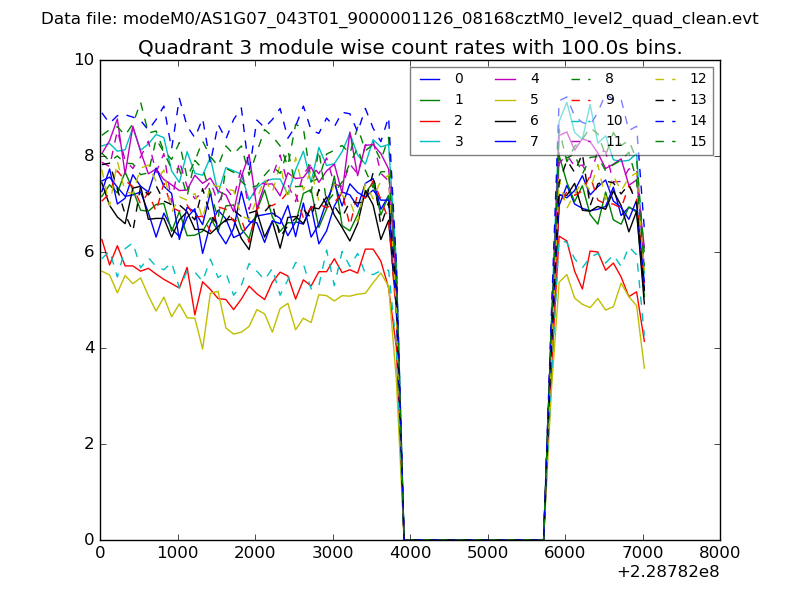 |
 |
| Parameter | Plot |
|---|---|
| CZT HV Monitor |  |
| D_VDD | 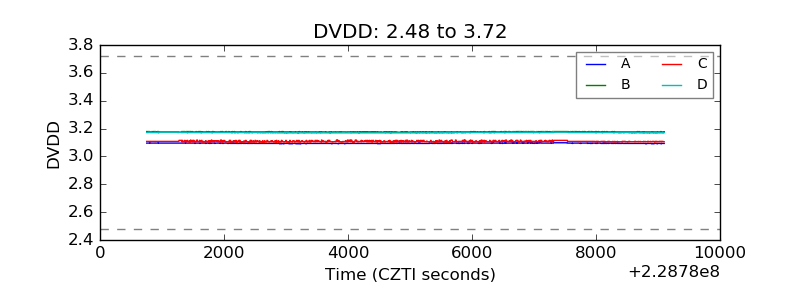 |
| Temperature 1 | 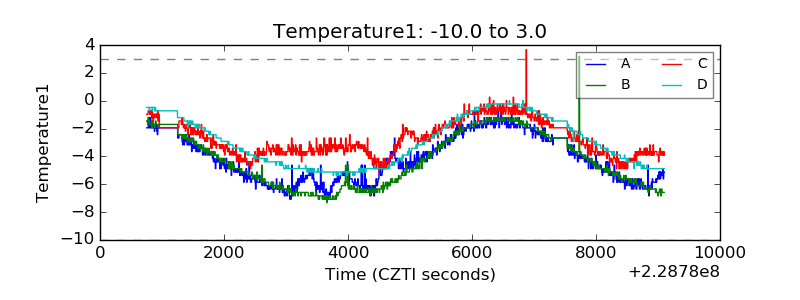 |
| Veto HV Monitor | 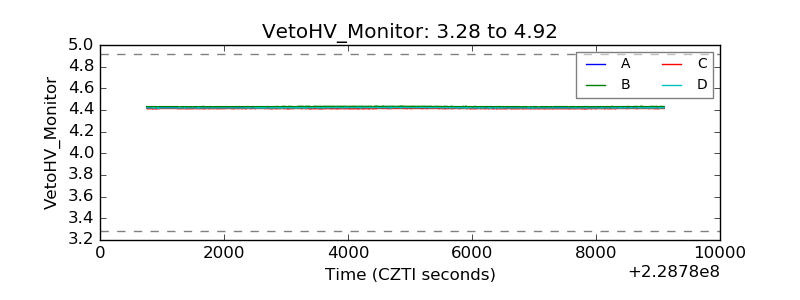 |
| Veto LLD | 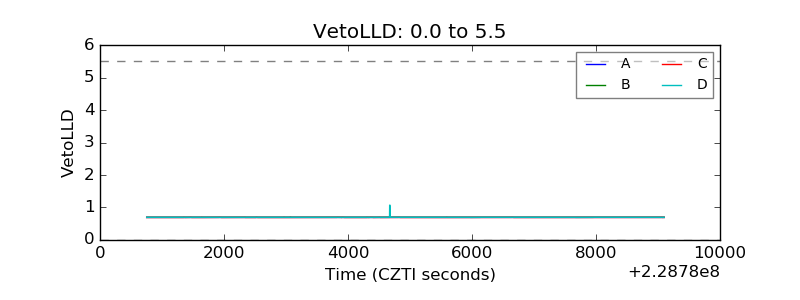 |
| Alpha Counter | 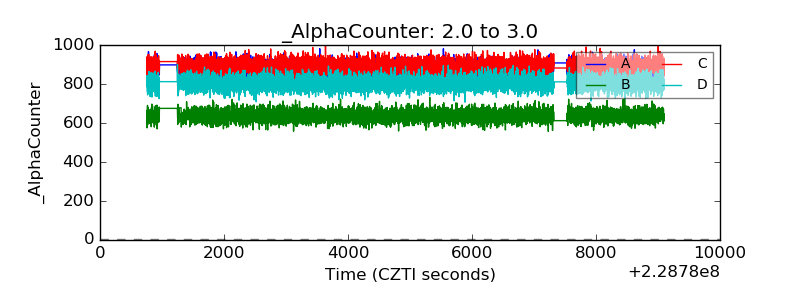 |
| _CPM_Rate | 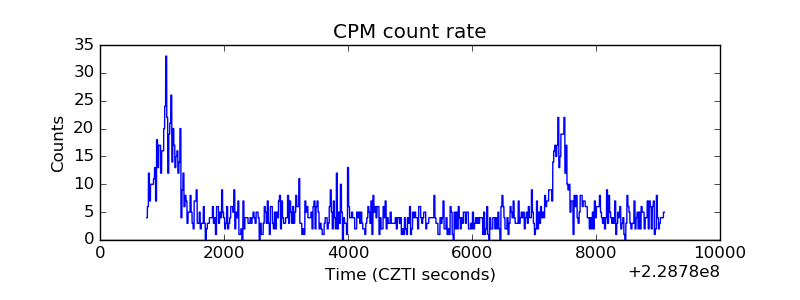 |
| CZT Counter | 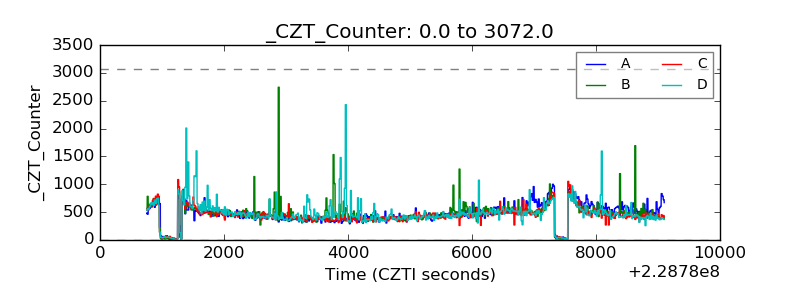 |
| +2.5 Volts monitor |  |
| +5 Volts monitor |  |
| _ROLL_ROT | 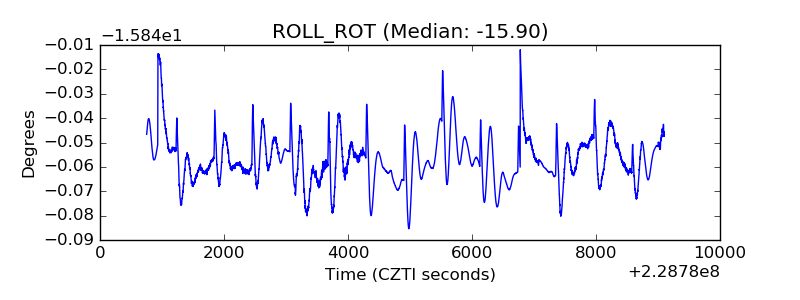 |
| _Roll_DEC | 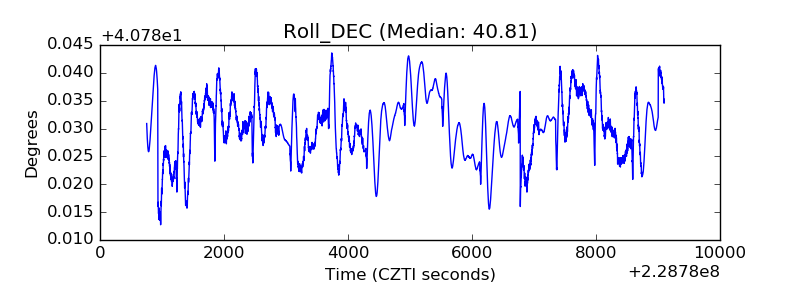 |
| _Roll_RA | 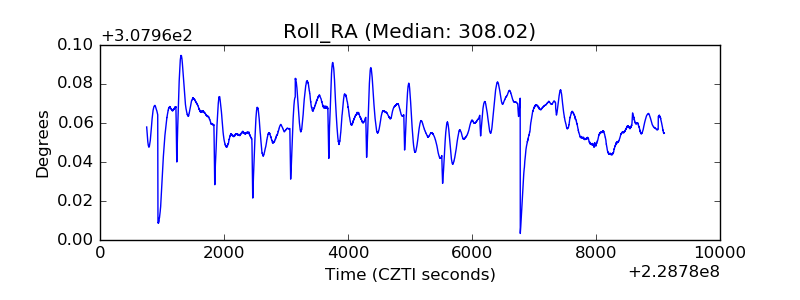 |
| Veto Counter | 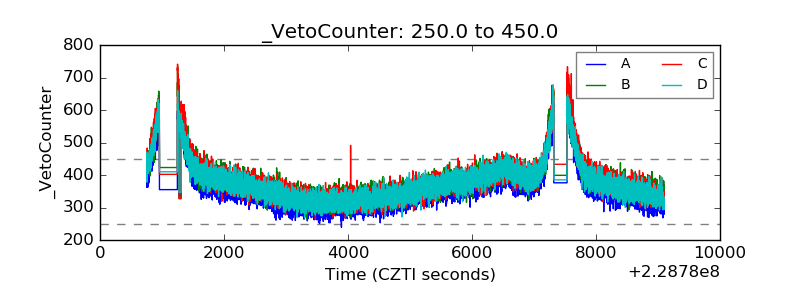 |