| Param | Original file | Final file |
|---|---|---|
| Filename | modeM0/AS1G07_043T01_9000001126_08172cztM0_level2.evt | modeM0/AS1G07_043T01_9000001126_08172cztM0_level2_quad_clean.evt |
| Size (bytes) | 1,479,548,160 | 288,455,040 |
| Size | 1.4 GB | 275.1 MB |
| Events in quadrant A | 10,976,103 | 1,773,574 |
| Events in quadrant B | 11,730,449 | 1,804,637 |
| Events in quadrant C | 10,060,488 | 1,823,638 |
| Events in quadrant D | 10,476,501 | 1,743,248 |
| Mode M0 | |||
|---|---|---|---|
| Quadrant | BADHDUFLAG | Total packets | Discarded packets |
| A | 0 | 48995 | 6 |
| B | 0 | 50964 | 5 |
| C | 0 | 47001 | 5 |
| D | 0 | 48360 | 5 |
| Mode SS | |||
|---|---|---|---|
| Quadrant | BADHDUFLAG | Total packets | Discarded packets |
| A | 0 | 472 | 0 |
| B | 0 | 472 | 0 |
| C | 0 | 472 | 0 |
| D | 0 | 472 | 0 |
| Mode M9 | |||
|---|---|---|---|
| Quadrant | BADHDUFLAG | Total packets | Discarded packets |
| A | 0 | 24 | 0 |
| B | 0 | 24 | 0 |
| C | 0 | 24 | 0 |
| D | 0 | 24 | 0 |
| Quadrant | Total seconds | Saturated seconds | Saturation percentage |
|---|---|---|---|
| A | 23124 | 132 | 0.570835% |
| B | 23124 | 522 | 2.257395% |
| C | 23124 | 83 | 0.358934% |
| D | 23124 | 97 | 0.419478% |
Noise dominated data is calculated using 1-second bins in cleaned event files. If a bin has >2000 counts, and if more than 50% of those come from <1% of pixels, then it is considered to be noise-dominated and hence unusable.
| Quadrant | # 1 sec bins | Bins with >0 counts | Bins with >2000 counts | High rate bins dominated by noise | Noise dominated (total time) | Noise dominated (detector-on time) | Marked lightcurve |
|---|---|---|---|---|---|---|---|
| A | 25594 | 23129 | 0 | 0 | 0.00% | 0.00% | 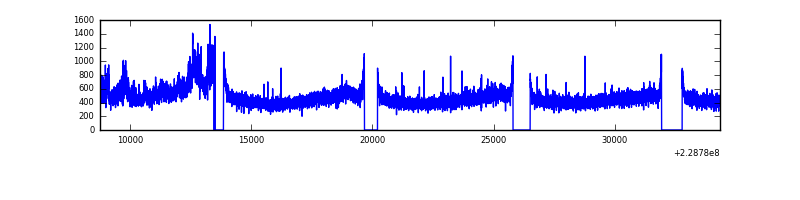 |
| B | 25594 | 23129 | 300 | 300 | 1.17% | 1.30% | 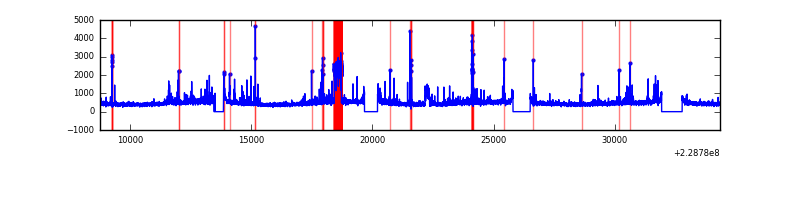 |
| C | 25594 | 23129 | 0 | 0 | 0.00% | 0.00% | 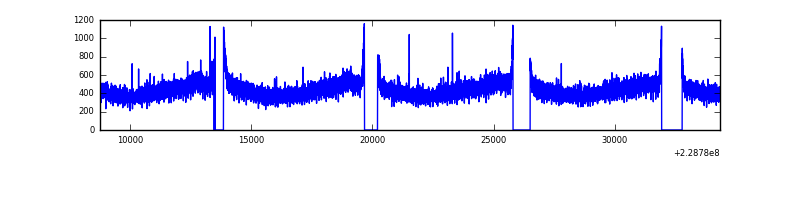 |
| D | 25594 | 23129 | 37 | 37 | 0.14% | 0.16% | 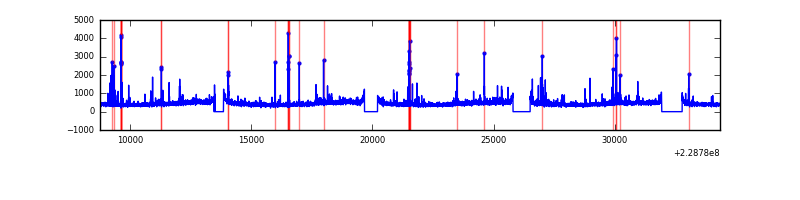 |
Top three noisy pixels from each quadrant. If the there are fewer than three noisy pixels in the level2.evt file, extra rows are filled as -1
| Pixel properties | Quadrant properties | ||||||
|---|---|---|---|---|---|---|---|
| Quadrant | DetID | PixID | Counts | Sigma | Mean | Median | Sigma |
| A | 15 | 79 | 781795 | 1449.65 | 2642 | 2579 | 537.5 |
| A | 0 | 226 | 24936 | 41.59 | 2642 | 2579 | 537.5 |
| A | 12 | 194 | 23796 | 39.47 | 2642 | 2579 | 537.5 |
| B | 4 | 173 | 613749 | 1225.61 | 2638 | 2574 | 498.7 |
| B | 10 | 16 | 277551 | 551.42 | 2638 | 2574 | 498.7 |
| B | 0 | 214 | 238862 | 473.84 | 2638 | 2574 | 498.7 |
| C | 13 | 61 | 19879 | 29.1 | 2576 | 2588 | 594.2 |
| C | 1 | 16 | 8257 | 9.54 | 2576 | 2588 | 594.2 |
| C | 12 | 4 | 7482 | 8.24 | 2576 | 2588 | 594.2 |
| D | 2 | 14 | 214943 | 338.94 | 2570 | 2492 | 626.8 |
| D | 6 | 225 | 125125 | 195.65 | 2570 | 2492 | 626.8 |
| D | 12 | 233 | 92887 | 144.22 | 2570 | 2492 | 626.8 |
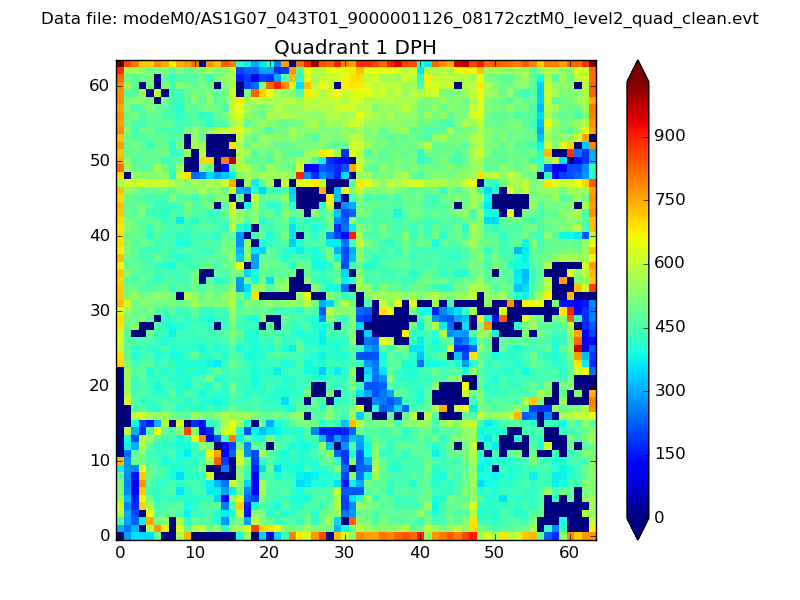
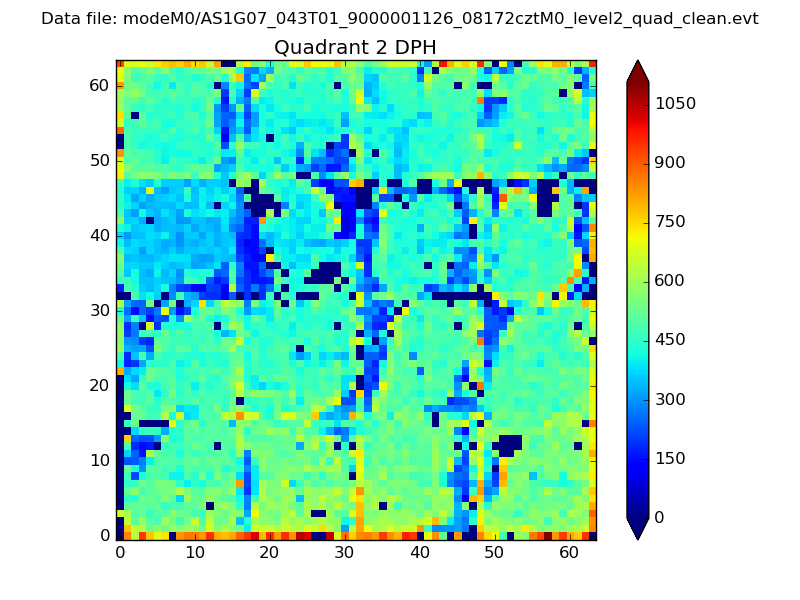
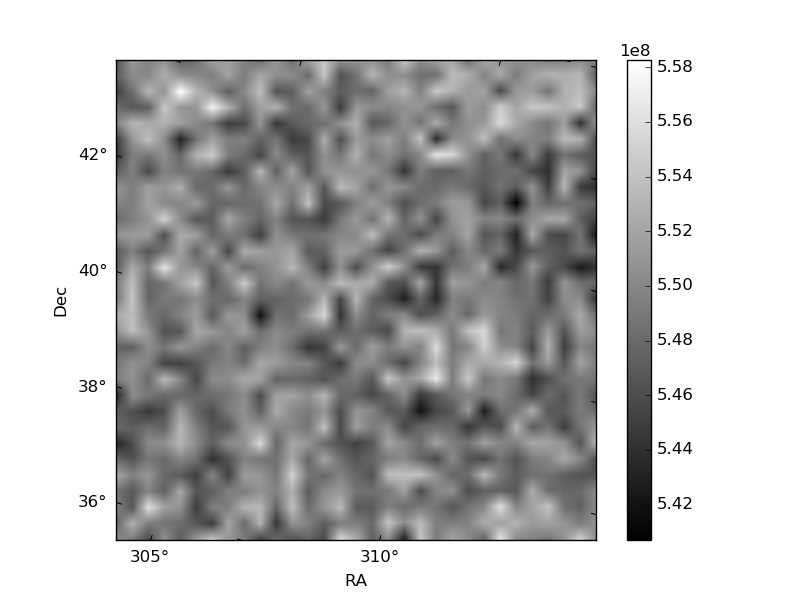
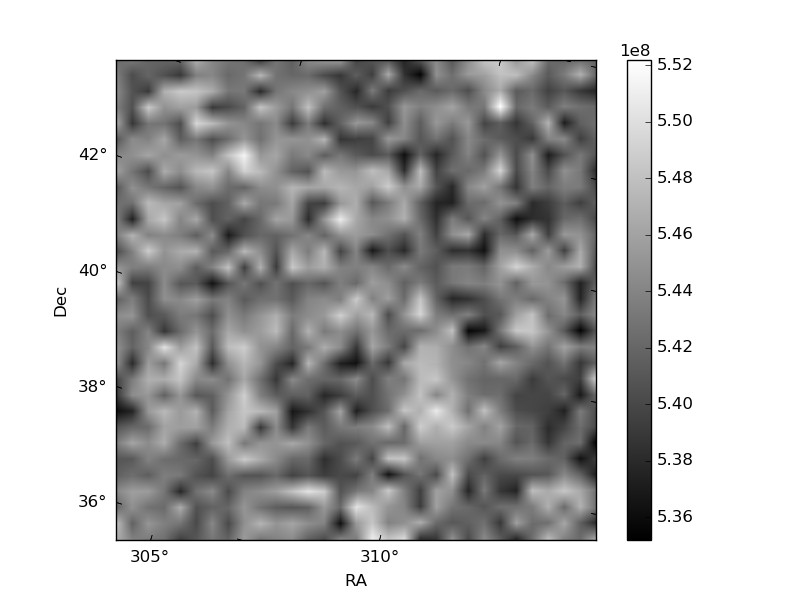
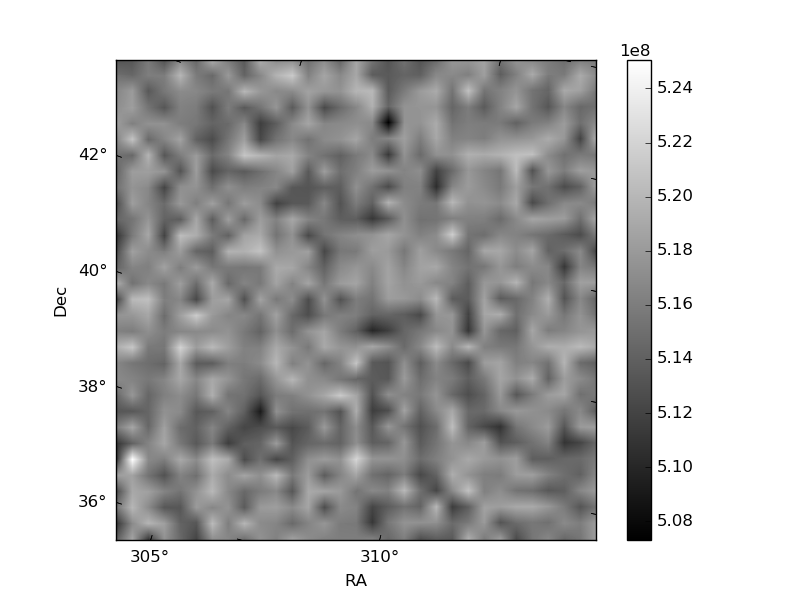
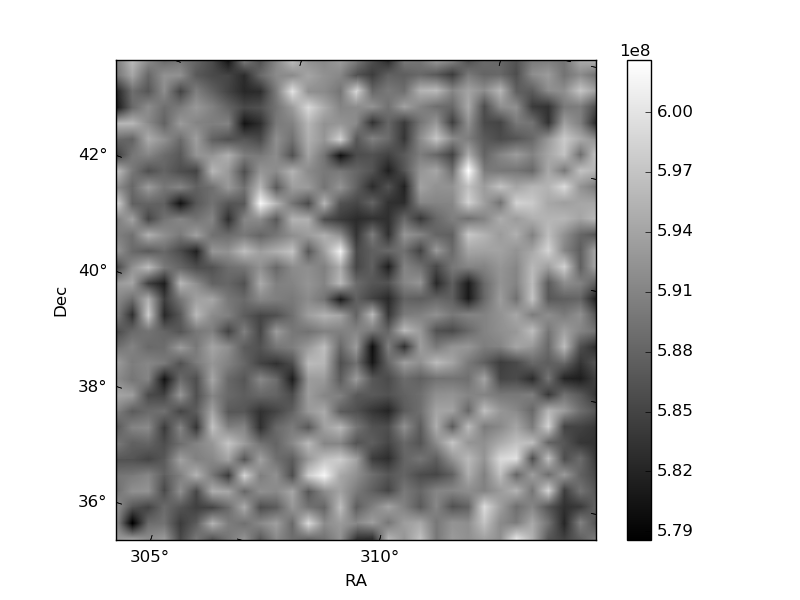
Histogram calculated using DETX and DETY for each event in the final _common_clean file
| Quadrant A |  |
 |
Quadrant B |
|---|---|---|---|
| Quadrant D |  |
 |
Quadrant C |
| Plot type | Count rate plots | Images |
|---|---|---|
| Comparison with Poisson distribution Blue bars denote a histogram of data divided into 1 sec bins. Red curve is a Poisson curve with rate = median count rate of data. |
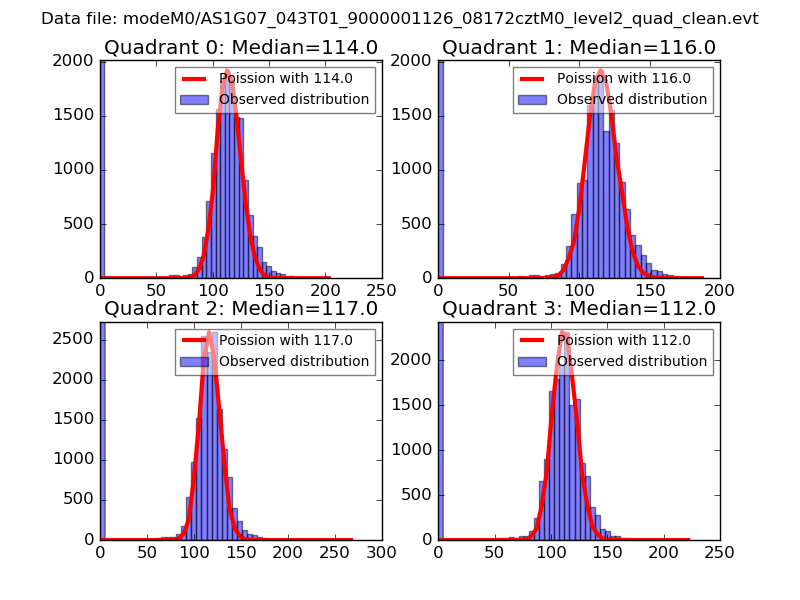 |
 |
| Quadrant-wise count rates Data is divided into 100 sec bins |
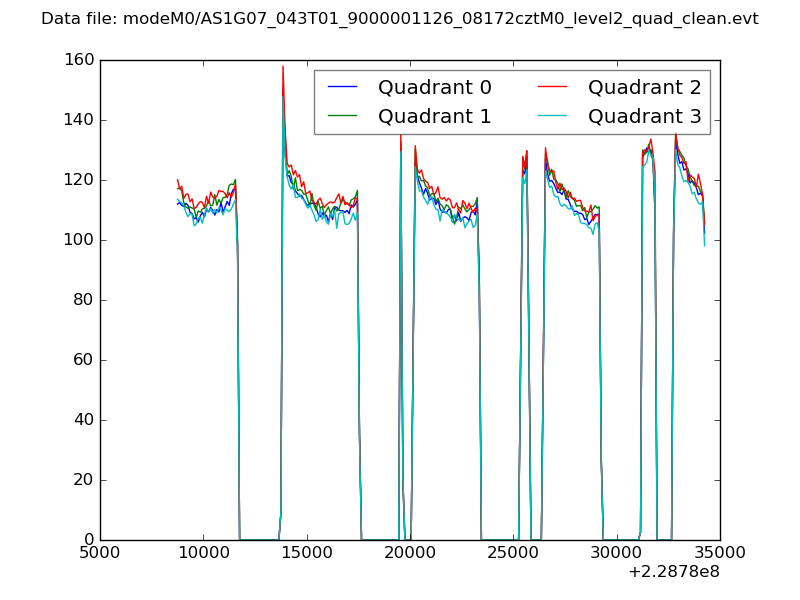 |
|
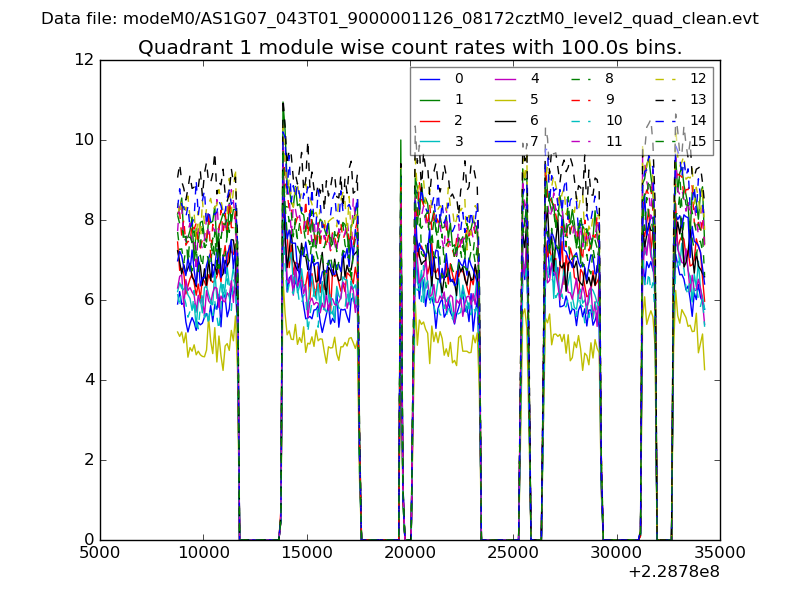
| Module-wise count rates for Quadrant A Data is divided into 100 sec bins |
 |
 |
| Module-wise count rates for Quadrant B Data is divided into 100 sec bins |
 |
 |
| Module-wise count rates for Quadrant C Data is divided into 100 sec bins |
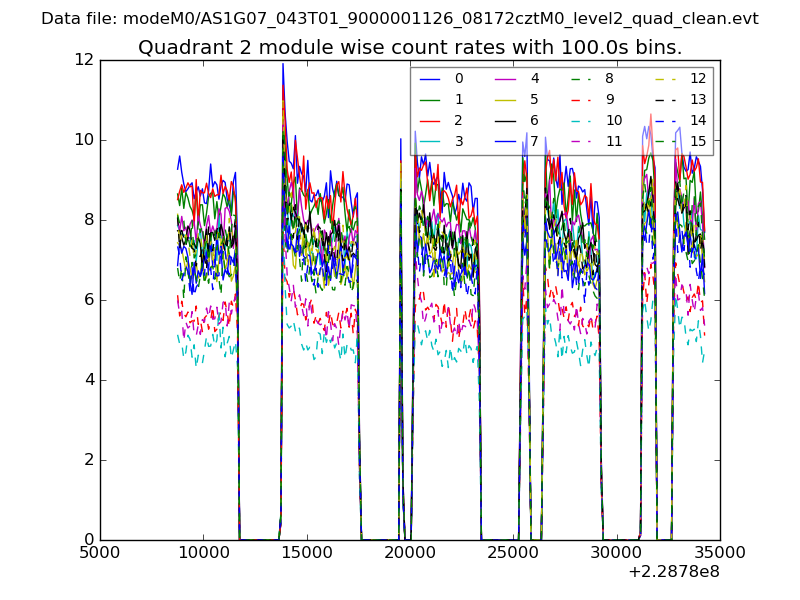 |
 |
| Module-wise count rates for Quadrant D Data is divided into 100 sec bins |
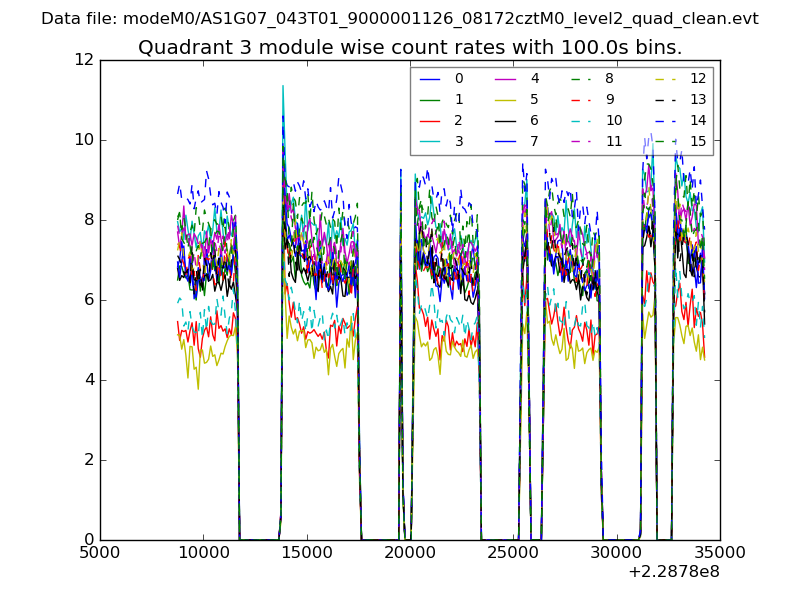 |
 |
| Parameter | Plot |
|---|---|
| CZT HV Monitor | 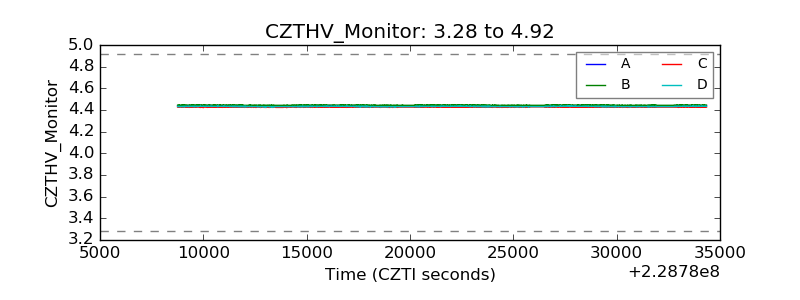 |
| D_VDD | 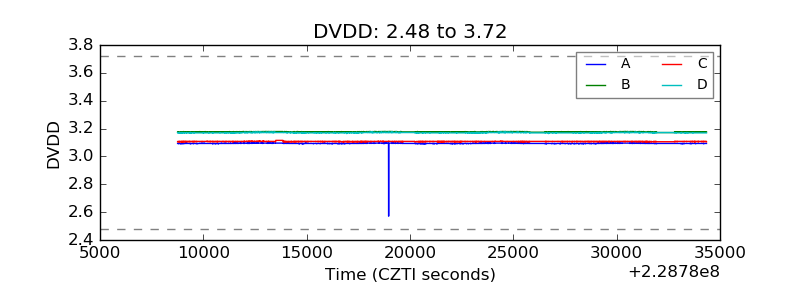 |
| Temperature 1 | 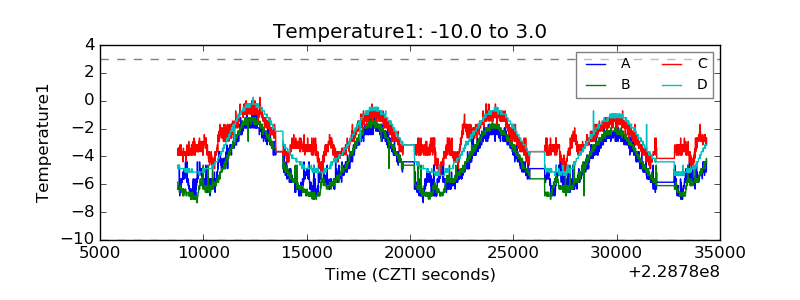 |
| Veto HV Monitor | 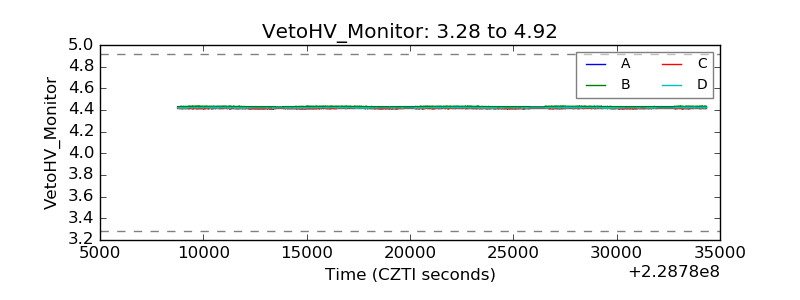 |
| Veto LLD | 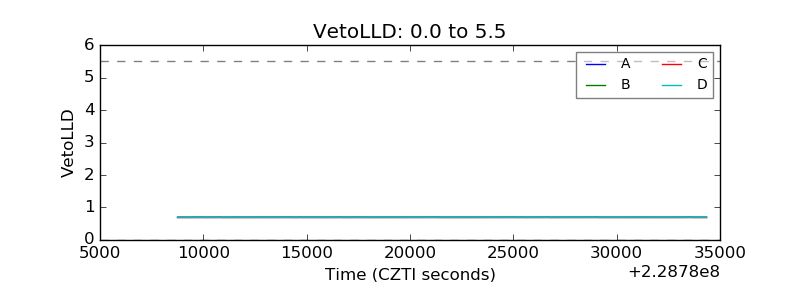 |
| Alpha Counter | 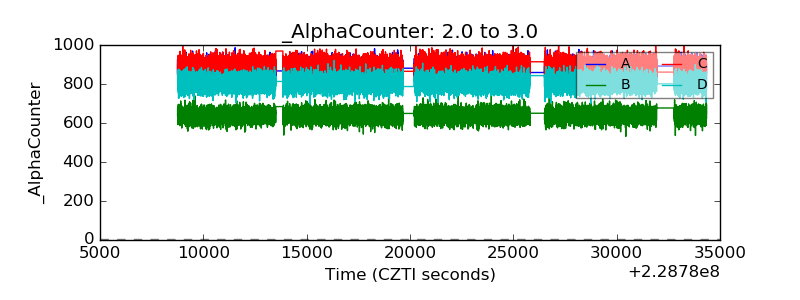 |
| _CPM_Rate | 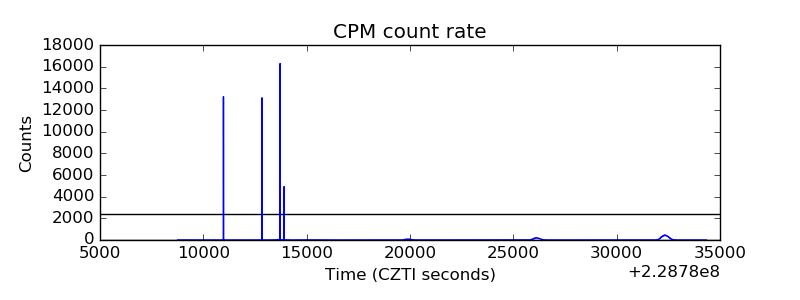 |
| CZT Counter | 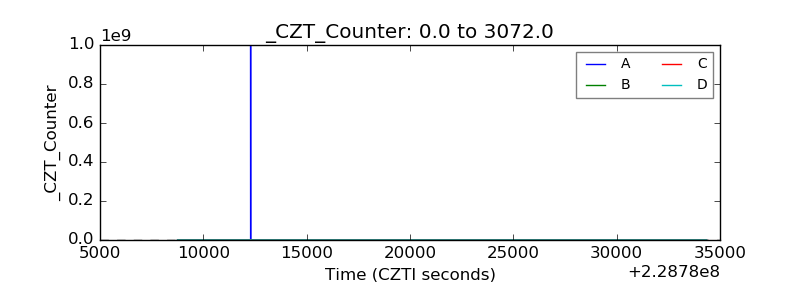 |
| +2.5 Volts monitor |  |
| +5 Volts monitor | 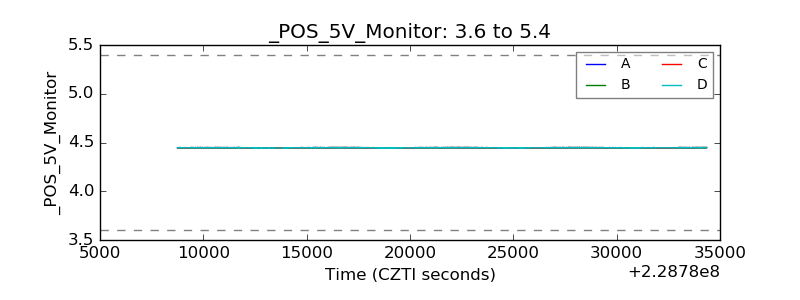 |
| _ROLL_ROT | 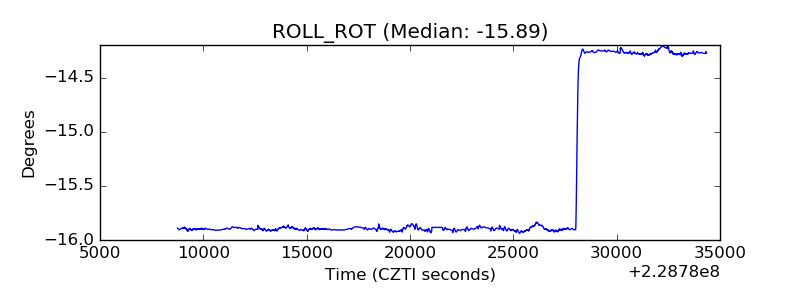 |
| _Roll_DEC | 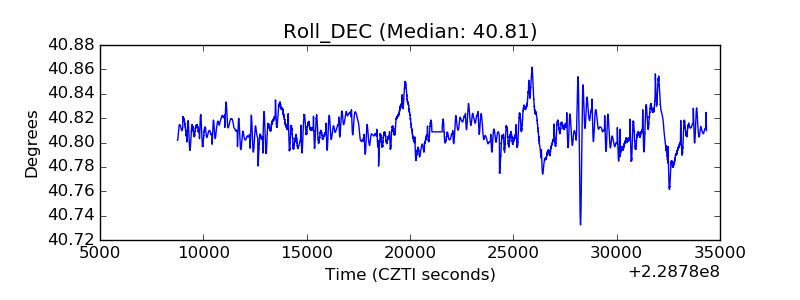 |
| _Roll_RA | 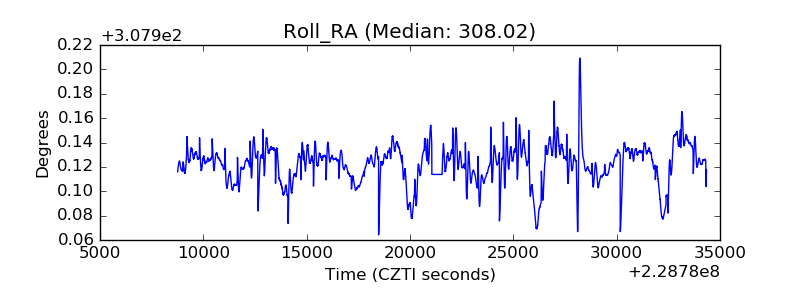 |
| Veto Counter | 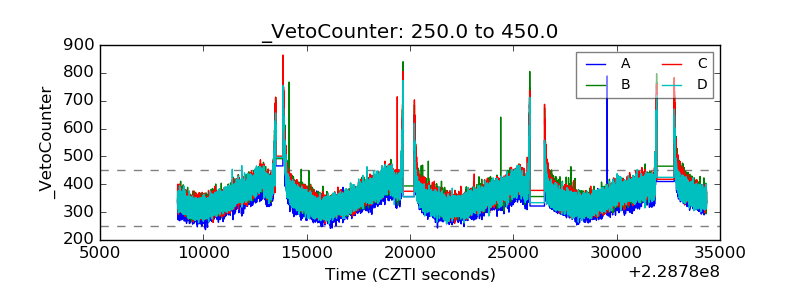 |