| Param | Original file | Final file |
|---|---|---|
| Filename | modeM0/AS1G07_043T01_9000001126_08175cztM0_level2.evt | modeM0/AS1G07_043T01_9000001126_08175cztM0_level2_quad_clean.evt |
| Size (bytes) | 370,105,920 | 78,782,400 |
| Size | 353.0 MB | 75.1 MB |
| Events in quadrant A | 2,674,815 | 496,536 |
| Events in quadrant B | 2,781,368 | 504,432 |
| Events in quadrant C | 2,602,549 | 502,384 |
| Events in quadrant D | 2,756,900 | 478,828 |
| Mode M0 | |||
|---|---|---|---|
| Quadrant | BADHDUFLAG | Total packets | Discarded packets |
| A | 0 | 11783 | 2 |
| B | 0 | 11982 | 1 |
| C | 0 | 11738 | 1 |
| D | 0 | 12135 | 1 |
| Mode SS | |||
|---|---|---|---|
| Quadrant | BADHDUFLAG | Total packets | Discarded packets |
| A | 0 | 116 | 0 |
| B | 0 | 116 | 0 |
| C | 0 | 116 | 0 |
| D | 0 | 116 | 0 |
| Mode M9 | |||
|---|---|---|---|
| Quadrant | BADHDUFLAG | Total packets | Discarded packets |
| A | 0 | 11 | 0 |
| B | 0 | 11 | 0 |
| C | 0 | 11 | 0 |
| D | 0 | 11 | 0 |
| Quadrant | Total seconds | Saturated seconds | Saturation percentage |
|---|---|---|---|
| A | 5777 | 76 | 1.315562% |
| B | 5777 | 71 | 1.229012% |
| C | 5777 | 48 | 0.830881% |
| D | 5777 | 82 | 1.419422% |
Noise dominated data is calculated using 1-second bins in cleaned event files. If a bin has >2000 counts, and if more than 50% of those come from <1% of pixels, then it is considered to be noise-dominated and hence unusable.
| Quadrant | # 1 sec bins | Bins with >0 counts | Bins with >2000 counts | High rate bins dominated by noise | Noise dominated (total time) | Noise dominated (detector-on time) | Marked lightcurve |
|---|---|---|---|---|---|---|---|
| A | 6857 | 5777 | 0 | 0 | 0.00% | 0.00% | 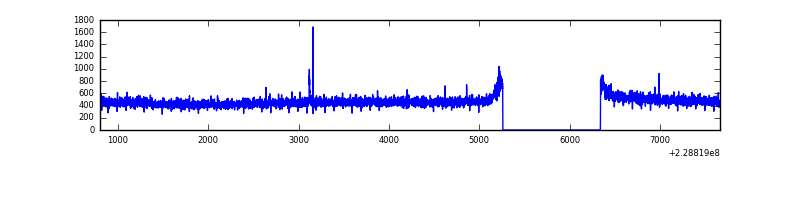 |
| B | 6857 | 5777 | 0 | 0 | 0.00% | 0.00% | 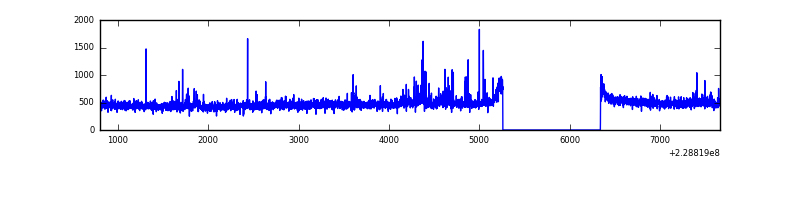 |
| C | 6857 | 5777 | 1 | 1 | 0.01% | 0.02% | 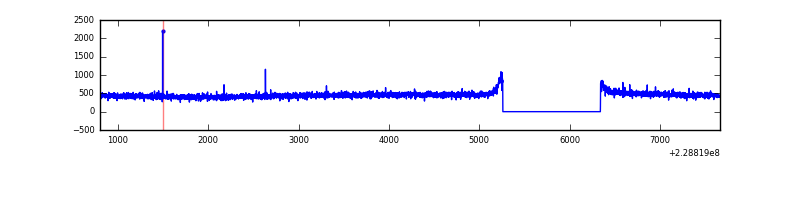 |
| D | 6857 | 5777 | 23 | 23 | 0.34% | 0.40% | 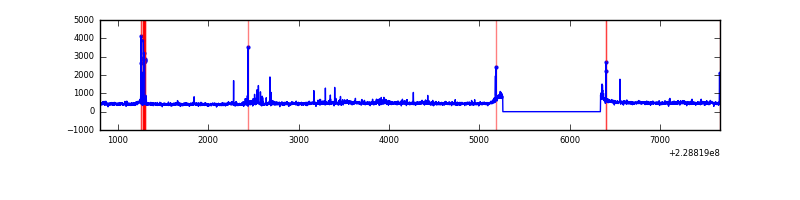 |
Top three noisy pixels from each quadrant. If the there are fewer than three noisy pixels in the level2.evt file, extra rows are filled as -1
| Pixel properties | Quadrant properties | ||||||
|---|---|---|---|---|---|---|---|
| Quadrant | DetID | PixID | Counts | Sigma | Mean | Median | Sigma |
| A | 0 | 226 | 6605 | 41.95 | 692 | 676 | 141.3 |
| A | 12 | 194 | 6202 | 39.1 | 692 | 676 | 141.3 |
| A | 14 | 111 | 6146 | 38.7 | 692 | 676 | 141.3 |
| B | 0 | 214 | 29896 | 224.23 | 688 | 673 | 130.3 |
| B | 10 | 16 | 19829 | 146.99 | 688 | 673 | 130.3 |
| B | 12 | 111 | 13166 | 95.86 | 688 | 673 | 130.3 |
| C | 13 | 61 | 5159 | 29.09 | 666 | 668 | 154.4 |
| C | 12 | 4 | 3001 | 15.11 | 666 | 668 | 154.4 |
| C | 3 | 202 | 1782 | 7.22 | 666 | 668 | 154.4 |
| D | 13 | 122 | 67916 | 406.67 | 669 | 647 | 165.4 |
| D | 13 | 29 | 64401 | 385.42 | 669 | 647 | 165.4 |
| D | 2 | 136 | 28930 | 170.98 | 669 | 647 | 165.4 |
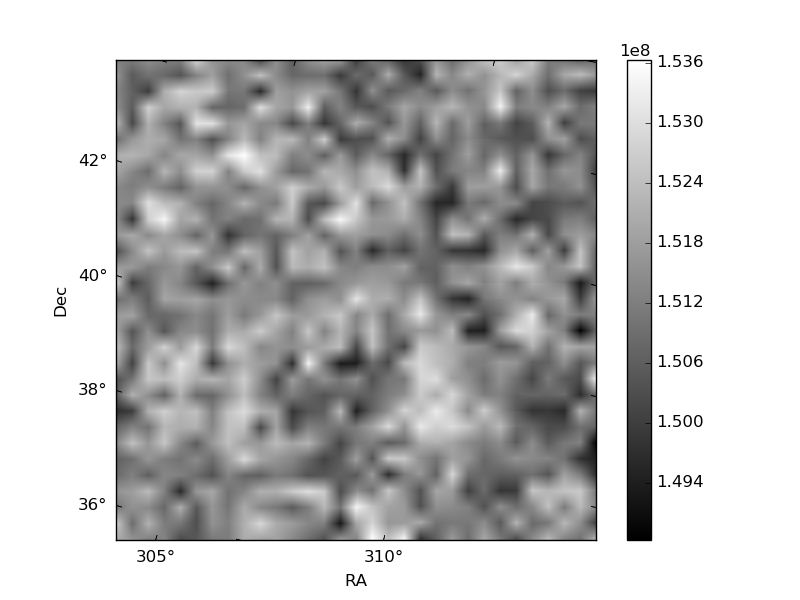
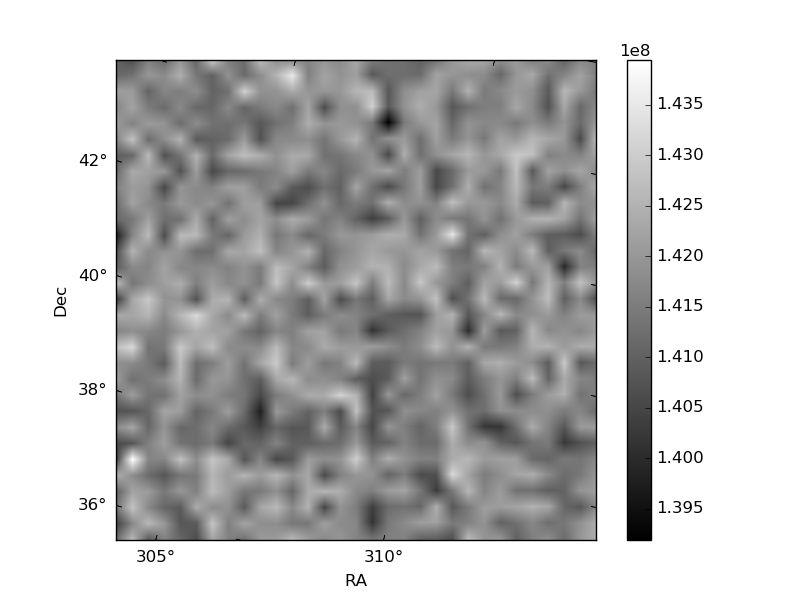
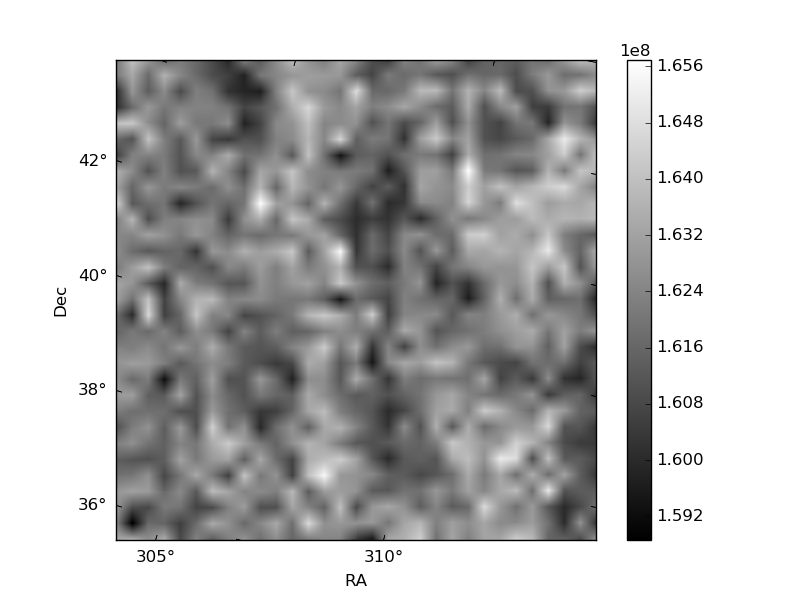
Histogram calculated using DETX and DETY for each event in the final _common_clean file
| Quadrant A | 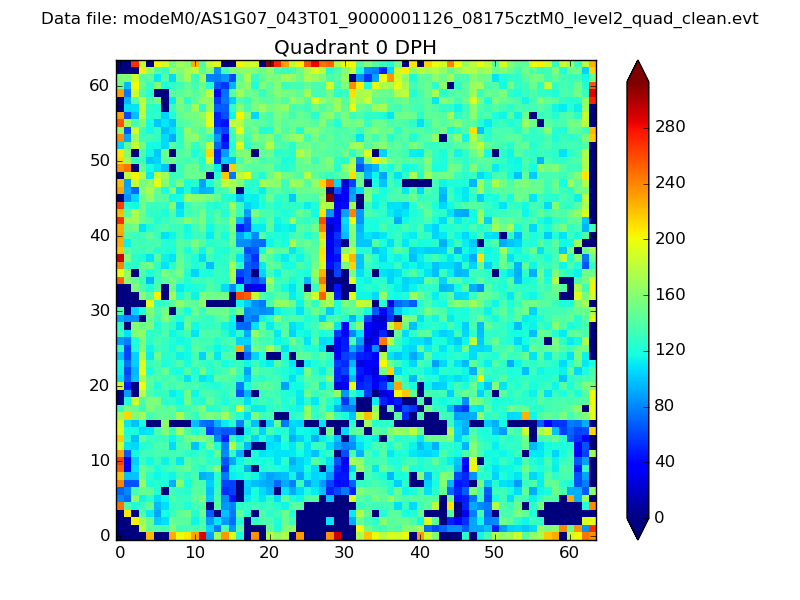 |
 |
Quadrant B |
|---|---|---|---|
| Quadrant D | 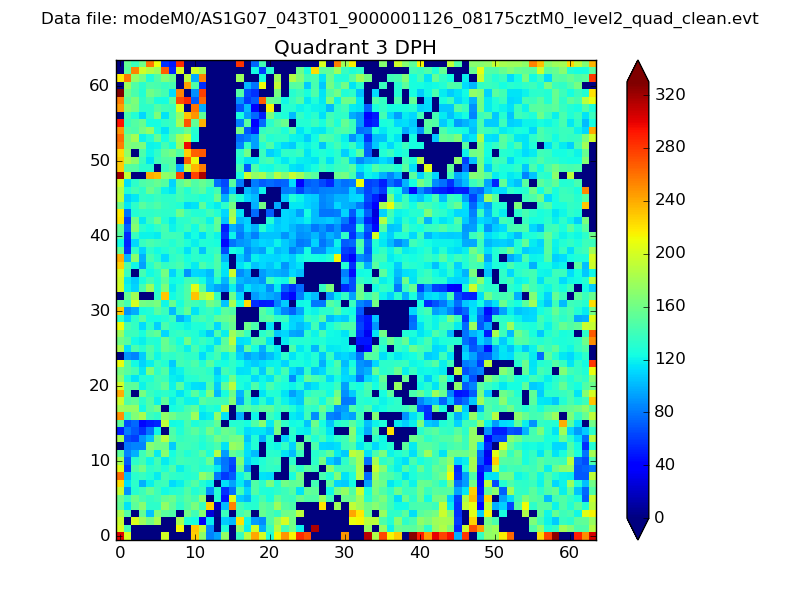 |
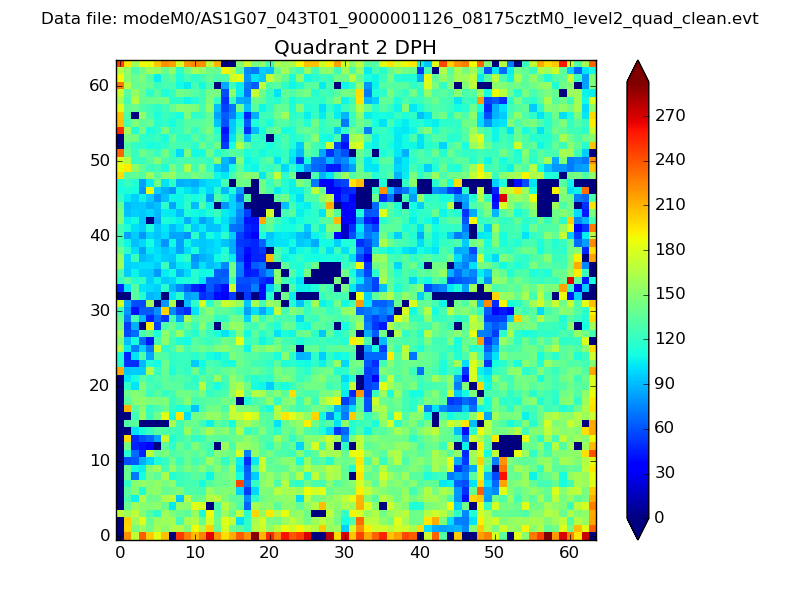 |
Quadrant C |
| Plot type | Count rate plots | Images |
|---|---|---|
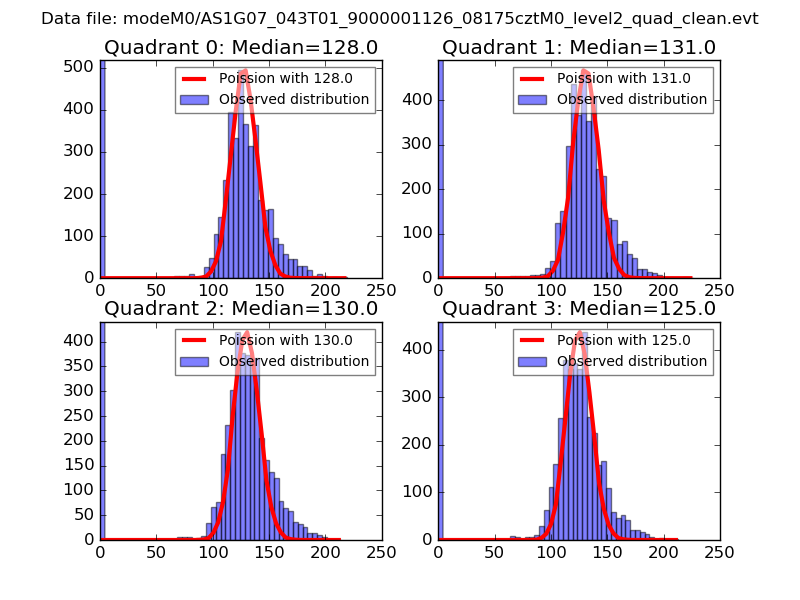
| Comparison with Poisson distribution Blue bars denote a histogram of data divided into 1 sec bins. Red curve is a Poisson curve with rate = median count rate of data. |
 |
 |
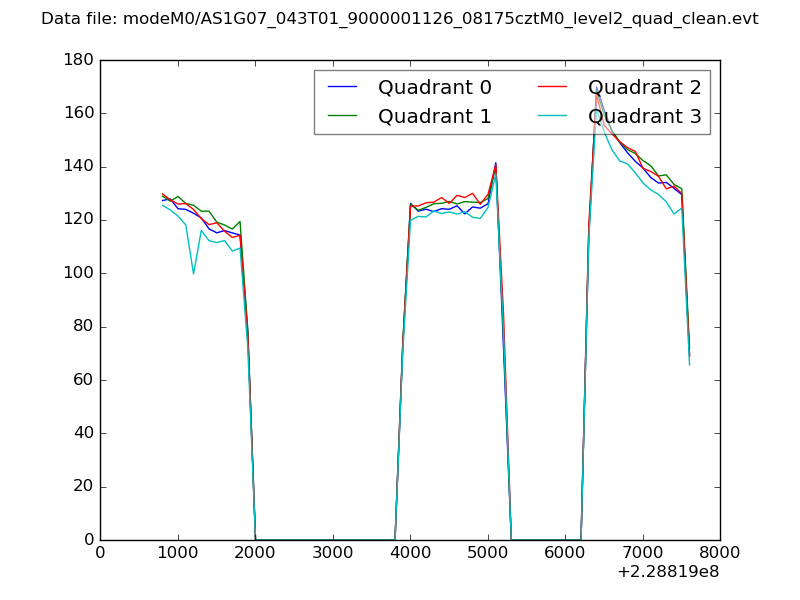
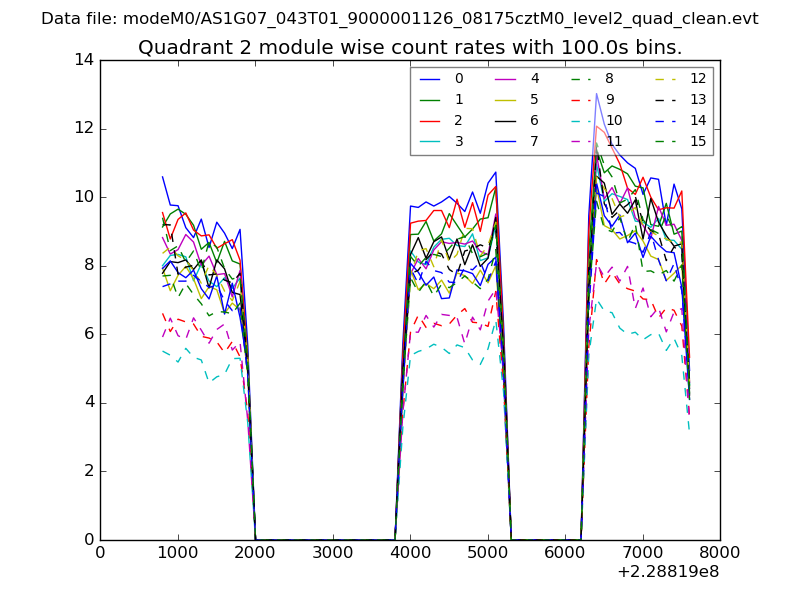
| Quadrant-wise count rates Data is divided into 100 sec bins |
 |
|
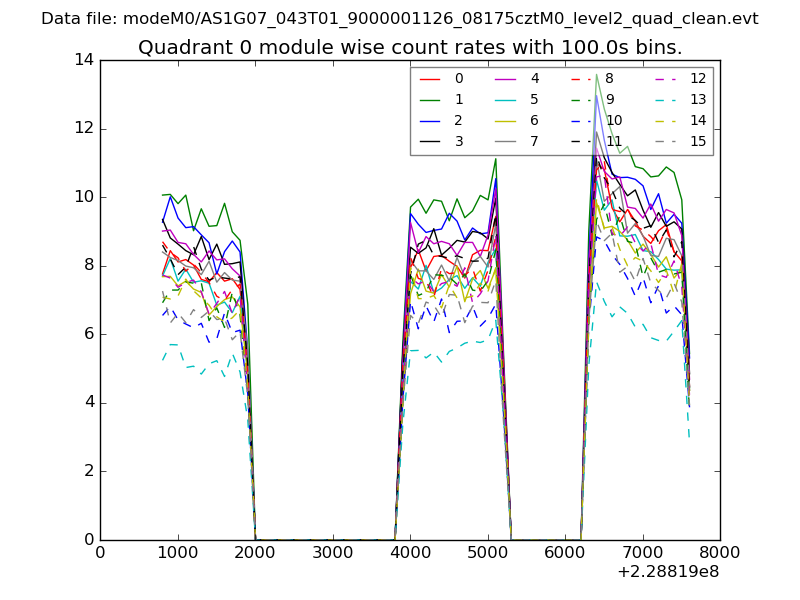
| Module-wise count rates for Quadrant A Data is divided into 100 sec bins |
 |
 |
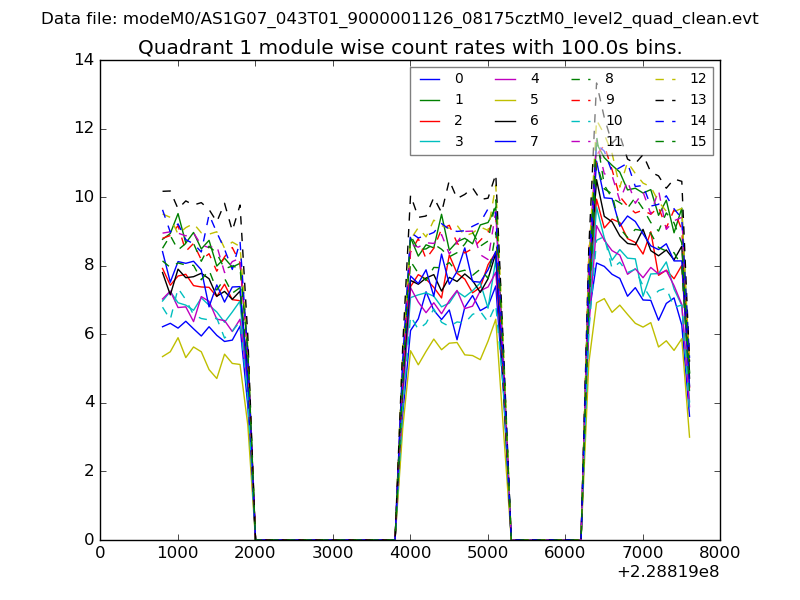
| Module-wise count rates for Quadrant B Data is divided into 100 sec bins |
 |
 |
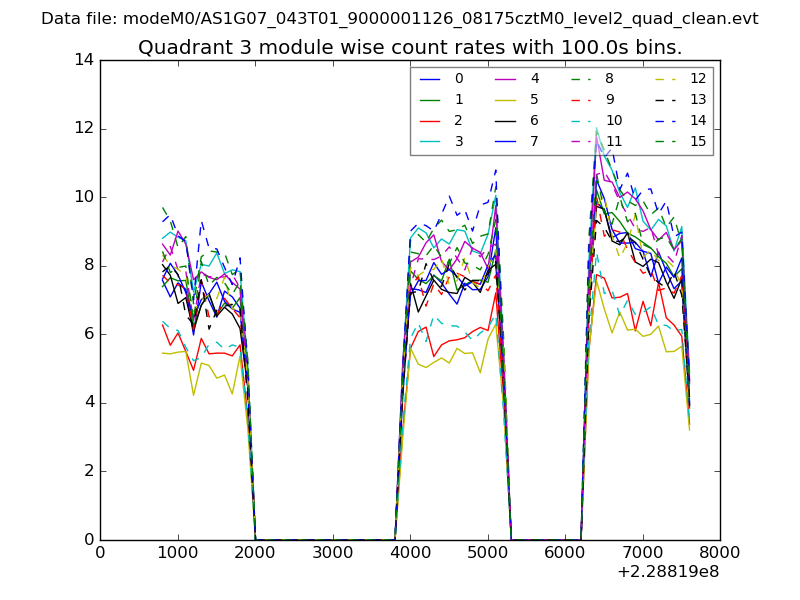
| Module-wise count rates for Quadrant C Data is divided into 100 sec bins |
 |
 |
| Module-wise count rates for Quadrant D Data is divided into 100 sec bins |
 |
 |
| Parameter | Plot |
|---|---|
| CZT HV Monitor | 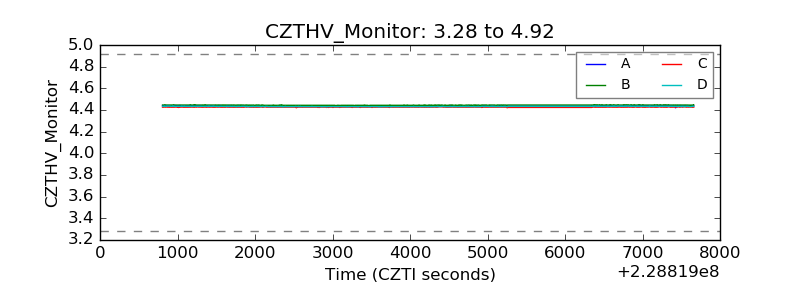 |
| D_VDD | 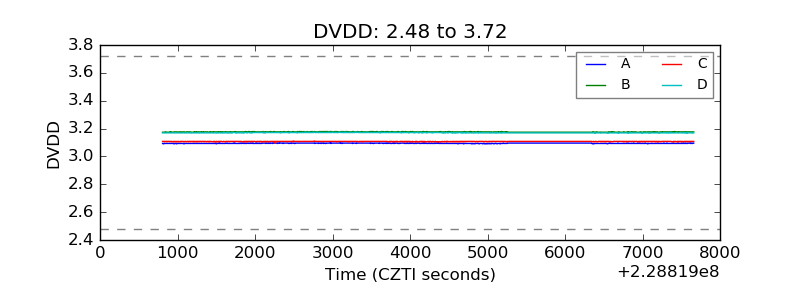 |
| Temperature 1 | 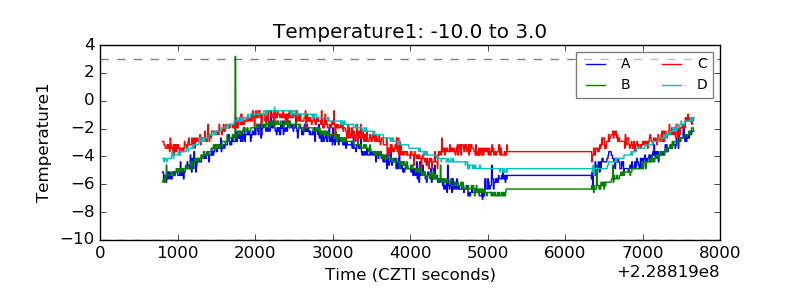 |
| Veto HV Monitor |  |
| Veto LLD |  |
| Alpha Counter | 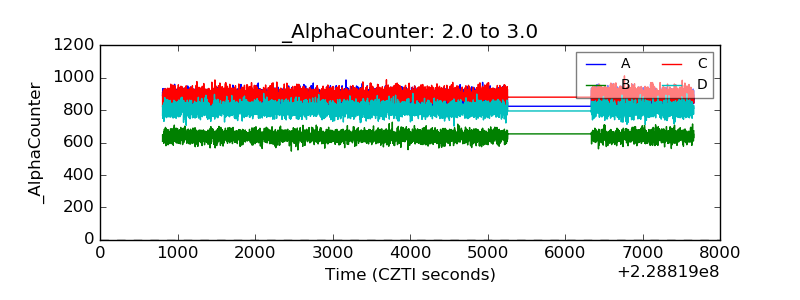 |
| _CPM_Rate | 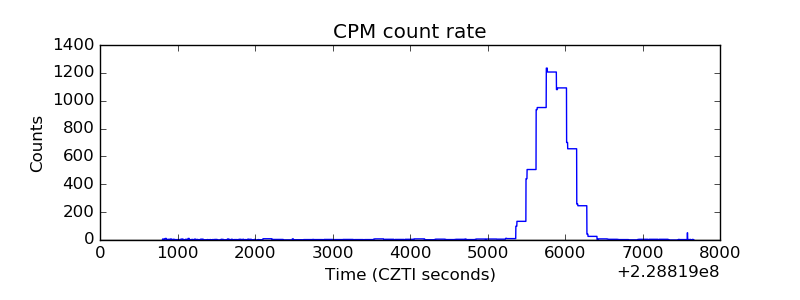 |
| CZT Counter | 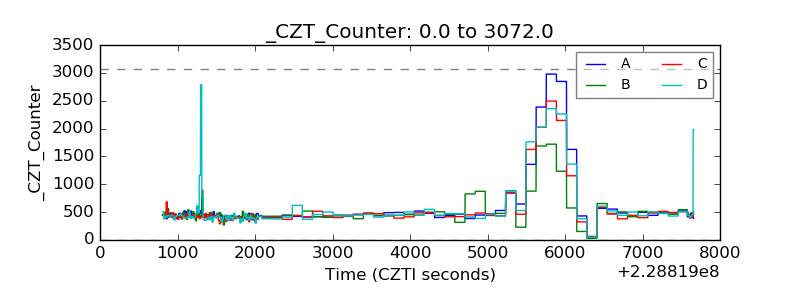 |
| +2.5 Volts monitor |  |
| +5 Volts monitor |  |
| _ROLL_ROT | 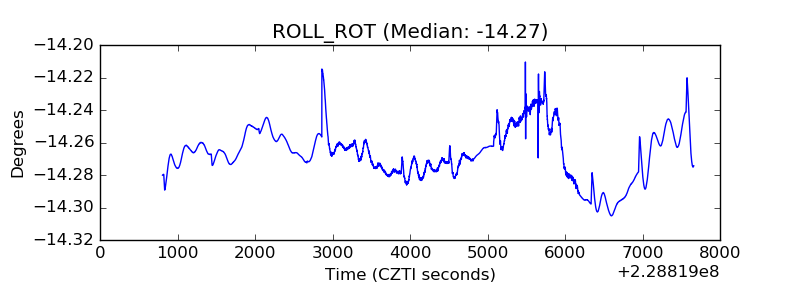 |
| _Roll_DEC | 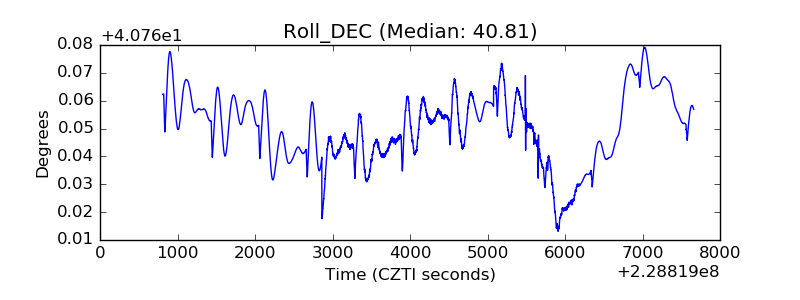 |
| _Roll_RA |  |
| Veto Counter | 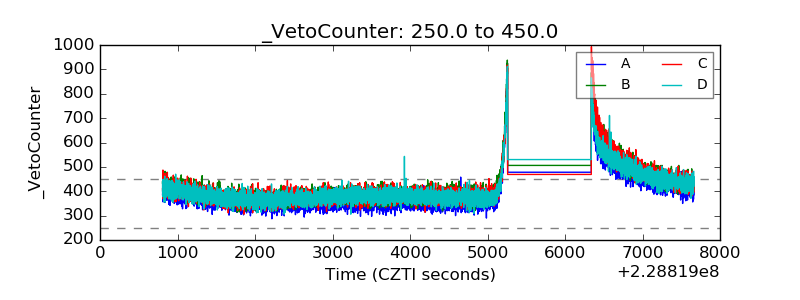 |