| Param | Original file | Final file |
|---|---|---|
| Filename | modeM0/AS1G07_043T01_9000001126_08176cztM0_level2.evt | modeM0/AS1G07_043T01_9000001126_08176cztM0_level2_quad_clean.evt |
| Size (bytes) | 430,548,480 | 86,048,640 |
| Size | 410.6 MB | 82.1 MB |
| Events in quadrant A | 3,120,479 | 545,977 |
| Events in quadrant B | 3,276,417 | 550,117 |
| Events in quadrant C | 2,869,812 | 552,981 |
| Events in quadrant D | 3,354,992 | 528,014 |
| Mode M0 | |||
|---|---|---|---|
| Quadrant | BADHDUFLAG | Total packets | Discarded packets |
| A | 0 | 13157 | 2 |
| B | 0 | 13483 | 1 |
| C | 0 | 12542 | 3 |
| D | 0 | 13870 | 3 |
| Mode SS | |||
|---|---|---|---|
| Quadrant | BADHDUFLAG | Total packets | Discarded packets |
| A | 0 | 124 | 0 |
| B | 0 | 124 | 0 |
| C | 0 | 124 | 0 |
| D | 0 | 124 | 0 |
| Mode M9 | |||
|---|---|---|---|
| Quadrant | BADHDUFLAG | Total packets | Discarded packets |
| A | 0 | 12 | 0 |
| B | 0 | 12 | 0 |
| C | 0 | 12 | 0 |
| D | 0 | 12 | 0 |
| Quadrant | Total seconds | Saturated seconds | Saturation percentage |
|---|---|---|---|
| A | 6144 | 101 | 1.643880% |
| B | 6144 | 123 | 2.001953% |
| C | 6143 | 71 | 1.155787% |
| D | 6143 | 95 | 1.546476% |
Noise dominated data is calculated using 1-second bins in cleaned event files. If a bin has >2000 counts, and if more than 50% of those come from <1% of pixels, then it is considered to be noise-dominated and hence unusable.
| Quadrant | # 1 sec bins | Bins with >0 counts | Bins with >2000 counts | High rate bins dominated by noise | Noise dominated (total time) | Noise dominated (detector-on time) | Marked lightcurve |
|---|---|---|---|---|---|---|---|
| A | 7304 | 6144 | 1 | 1 | 0.01% | 0.02% | 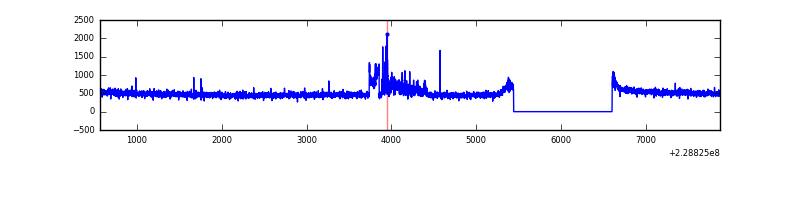 |
| B | 7304 | 6145 | 20 | 20 | 0.27% | 0.33% | 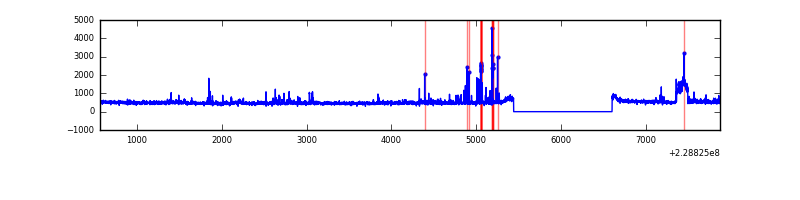 |
| C | 7304 | 6144 | 0 | 0 | 0.00% | 0.00% | 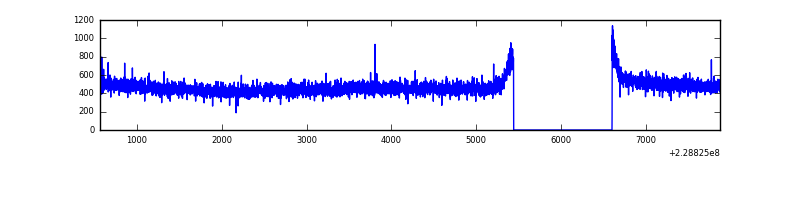 |
| D | 7304 | 6144 | 14 | 14 | 0.19% | 0.23% | 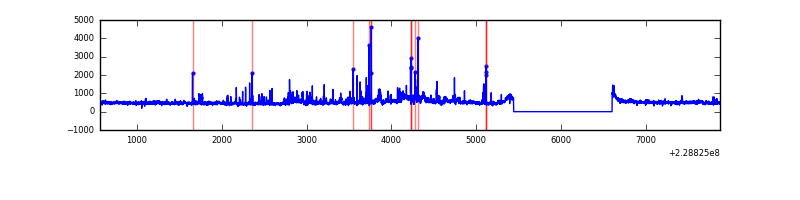 |
Top three noisy pixels from each quadrant. If the there are fewer than three noisy pixels in the level2.evt file, extra rows are filled as -1
| Pixel properties | Quadrant properties | ||||||
|---|---|---|---|---|---|---|---|
| Quadrant | DetID | PixID | Counts | Sigma | Mean | Median | Sigma |
| A | 8 | 15 | 115347 | 737.46 | 763 | 748 | 155.4 |
| A | 15 | 79 | 61997 | 394.15 | 763 | 748 | 155.4 |
| A | 0 | 226 | 7427 | 42.98 | 763 | 748 | 155.4 |
| B | 5 | 255 | 140339 | 960.61 | 757 | 739 | 145.3 |
| B | 4 | 81 | 76584 | 521.9 | 757 | 739 | 145.3 |
| B | 10 | 16 | 46342 | 313.8 | 757 | 739 | 145.3 |
| C | 13 | 61 | 5635 | 28.91 | 735 | 737 | 169.4 |
| C | 12 | 4 | 2750 | 11.88 | 735 | 737 | 169.4 |
| C | 3 | 202 | 1971 | 7.28 | 735 | 737 | 169.4 |
| D | 13 | 122 | 326684 | 1794.85 | 740 | 717 | 181.6 |
| D | 2 | 136 | 85111 | 464.69 | 740 | 717 | 181.6 |
| D | 1 | 52 | 58650 | 318.99 | 740 | 717 | 181.6 |
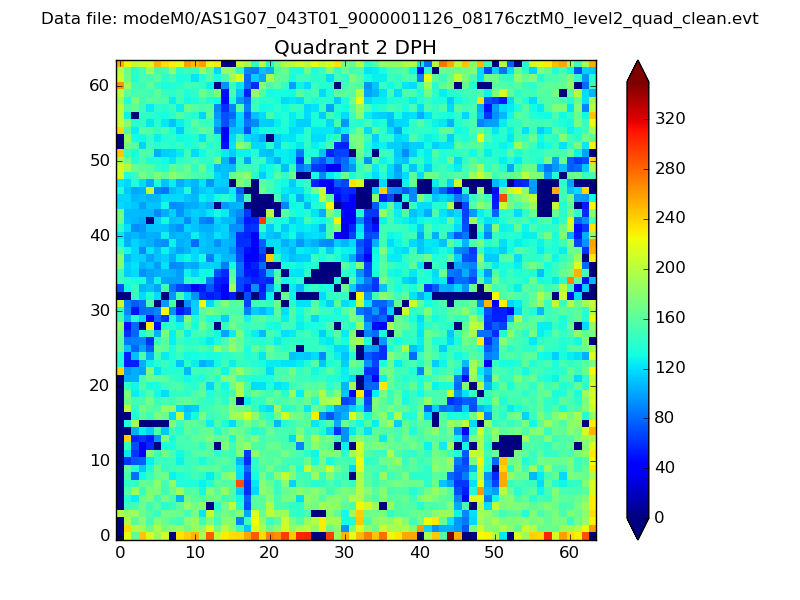
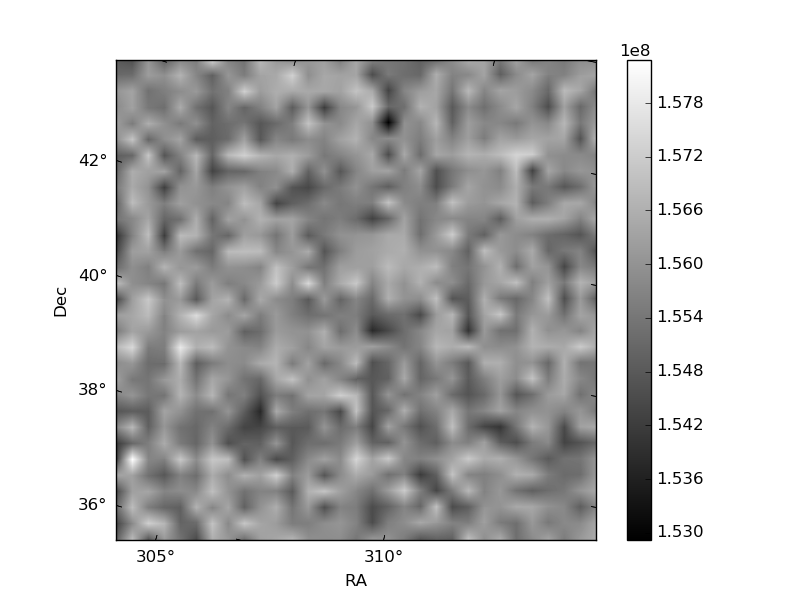
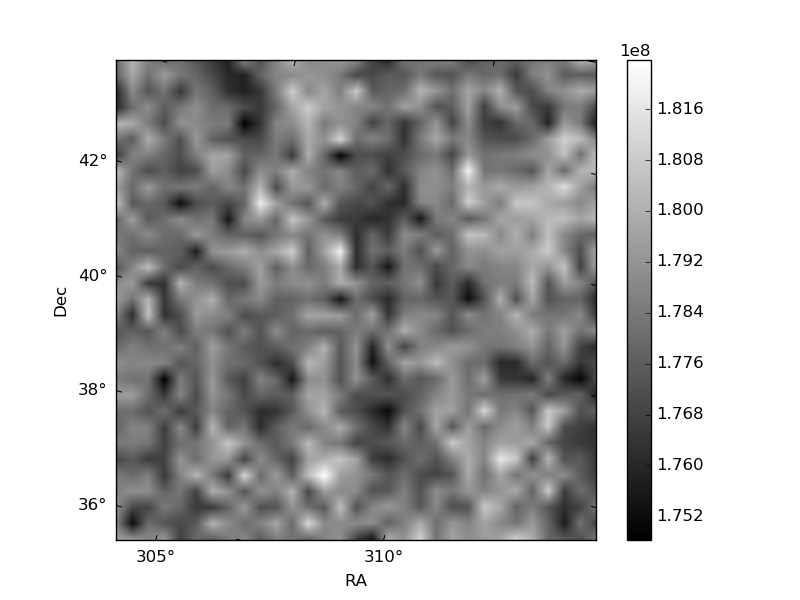
Histogram calculated using DETX and DETY for each event in the final _common_clean file
| Quadrant A | 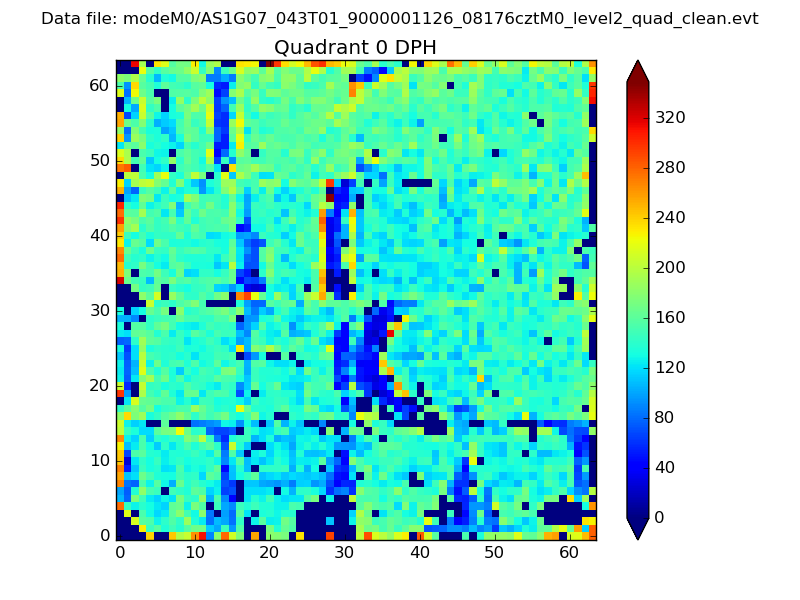 |
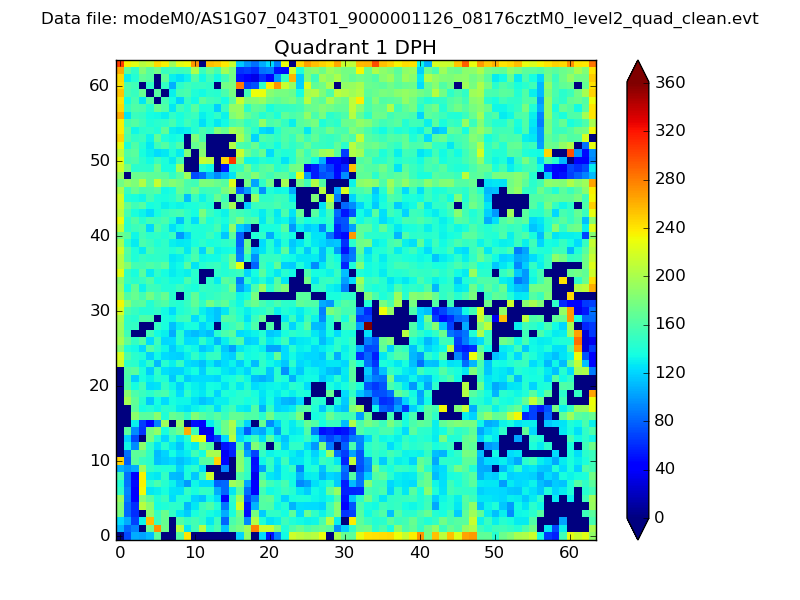 |
Quadrant B |
|---|---|---|---|
| Quadrant D | 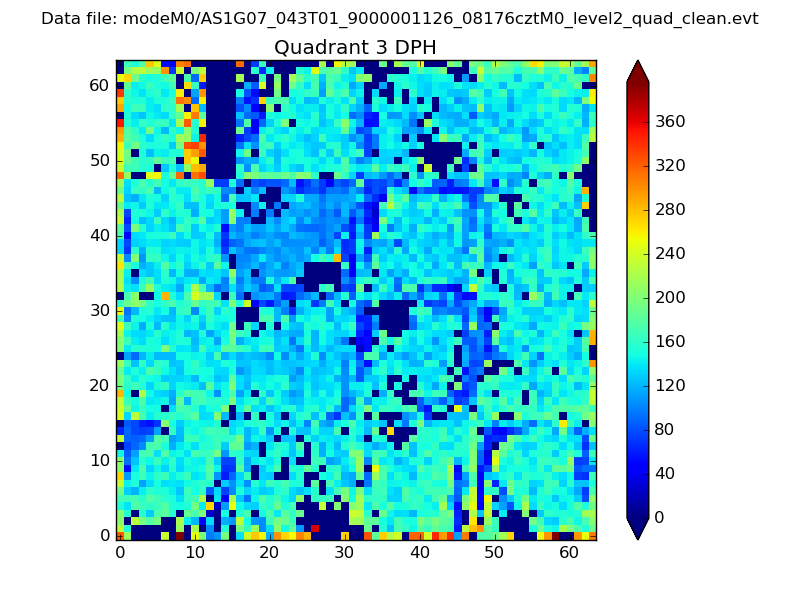 |
 |
Quadrant C |
| Plot type | Count rate plots | Images |
|---|---|---|
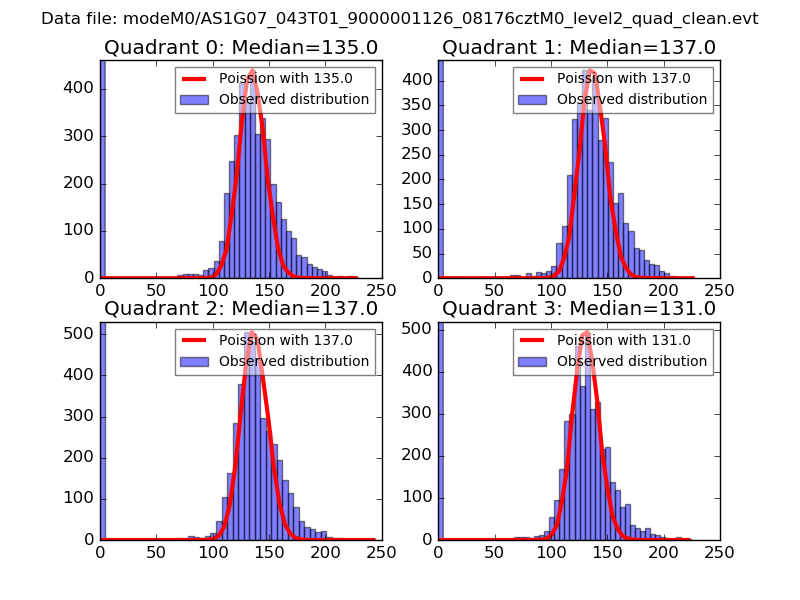
| Comparison with Poisson distribution Blue bars denote a histogram of data divided into 1 sec bins. Red curve is a Poisson curve with rate = median count rate of data. |
 |
 |
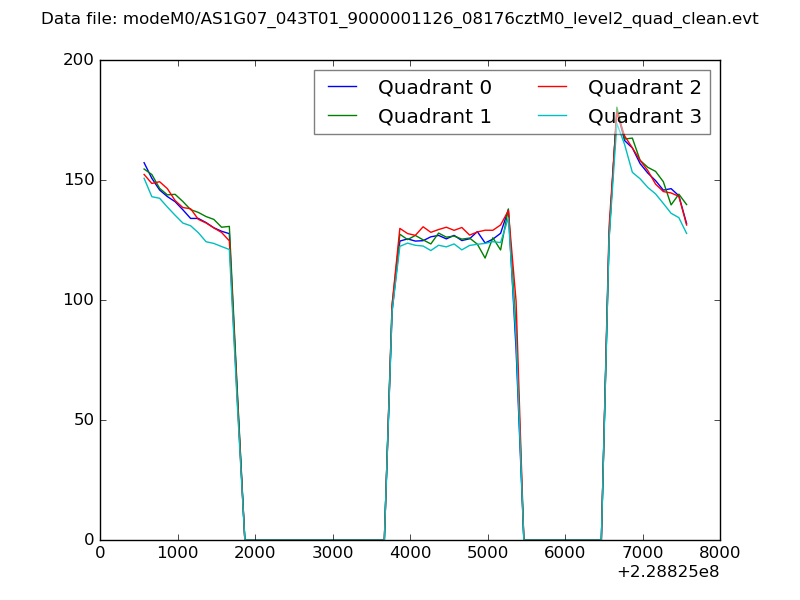
| Quadrant-wise count rates Data is divided into 100 sec bins |
 |
|
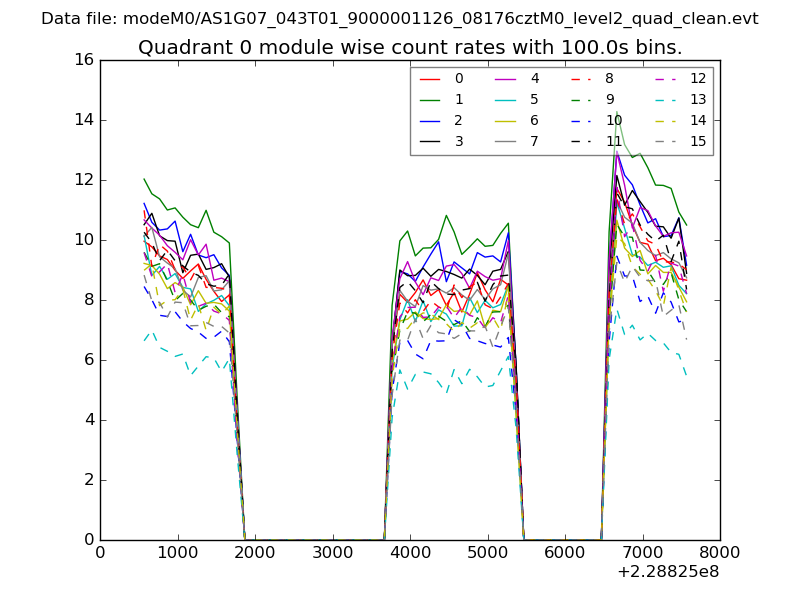
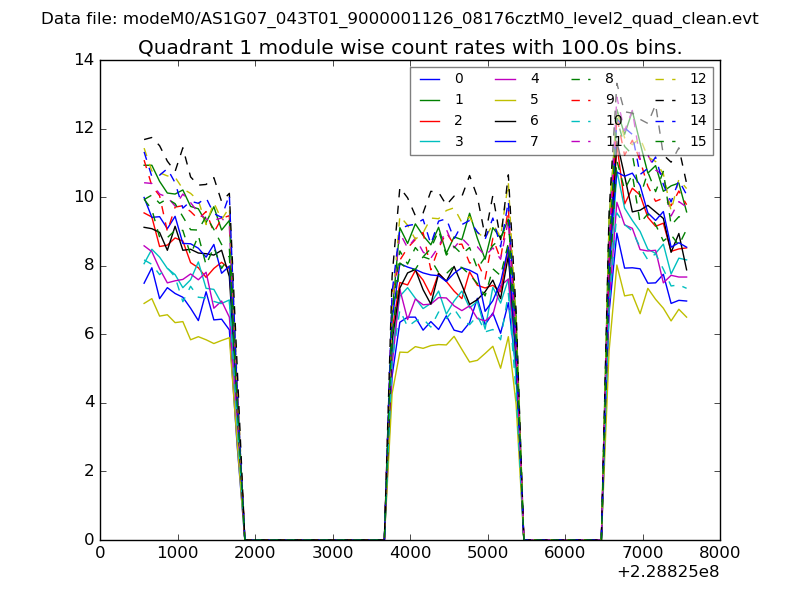
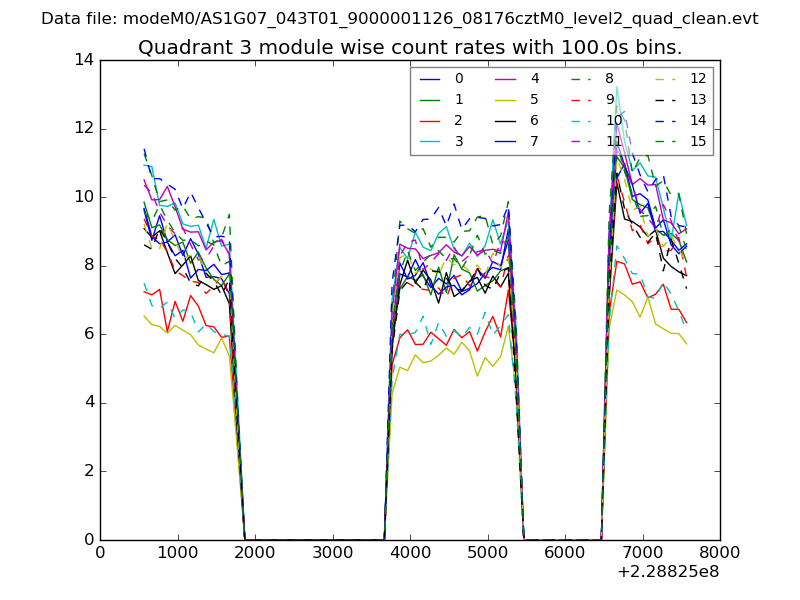
| Module-wise count rates for Quadrant A Data is divided into 100 sec bins |
 |
 |
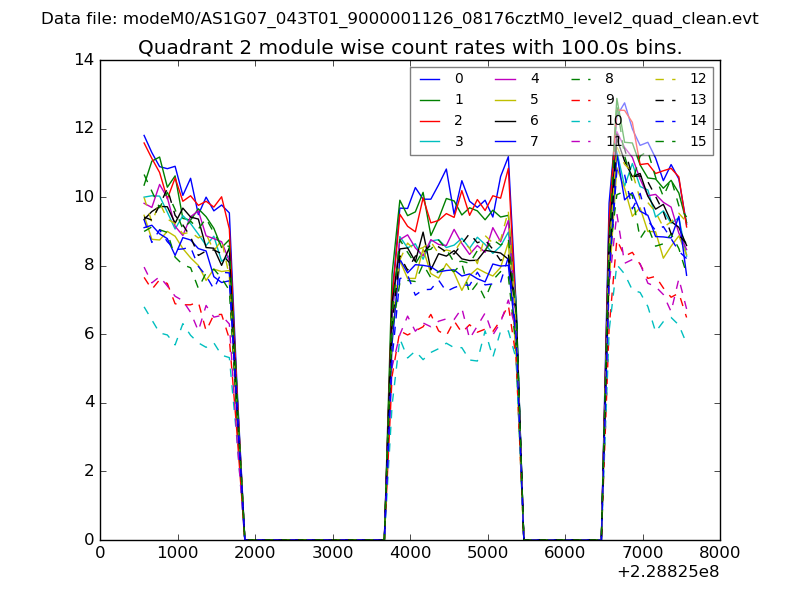
| Module-wise count rates for Quadrant B Data is divided into 100 sec bins |
 |
 |
| Module-wise count rates for Quadrant C Data is divided into 100 sec bins |
 |
 |
| Module-wise count rates for Quadrant D Data is divided into 100 sec bins |
 |
 |
| Parameter | Plot |
|---|---|
| CZT HV Monitor | 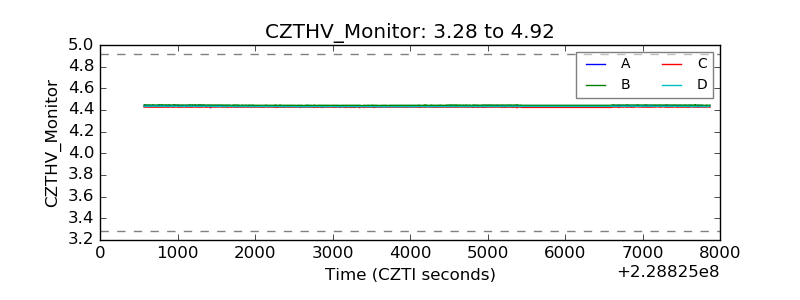 |
| D_VDD | 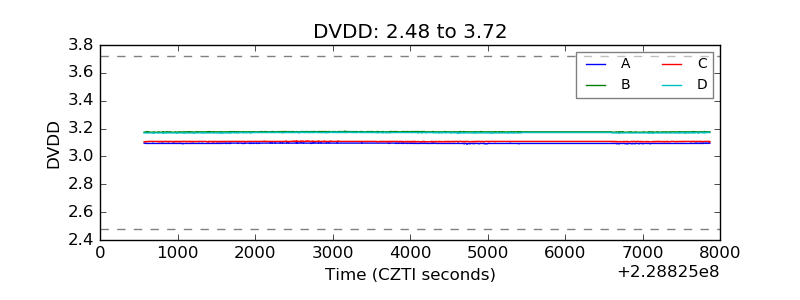 |
| Temperature 1 | 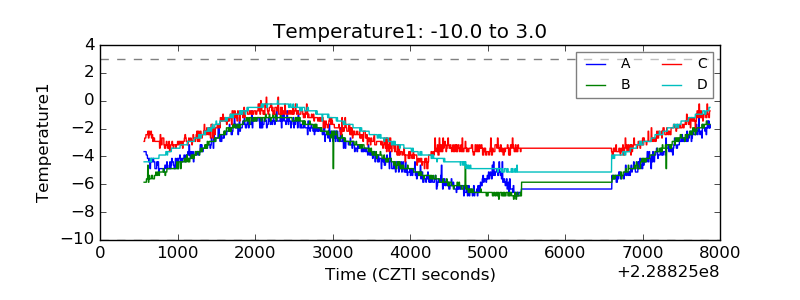 |
| Veto HV Monitor | 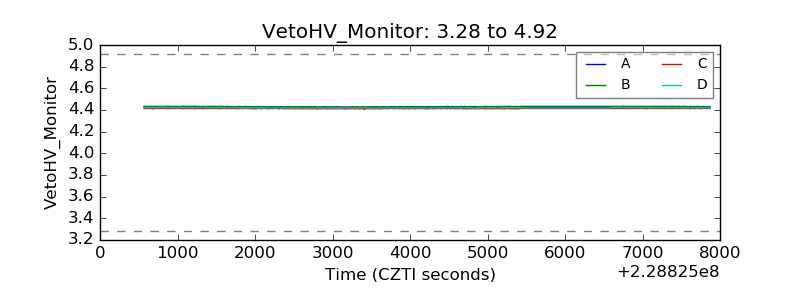 |
| Veto LLD | 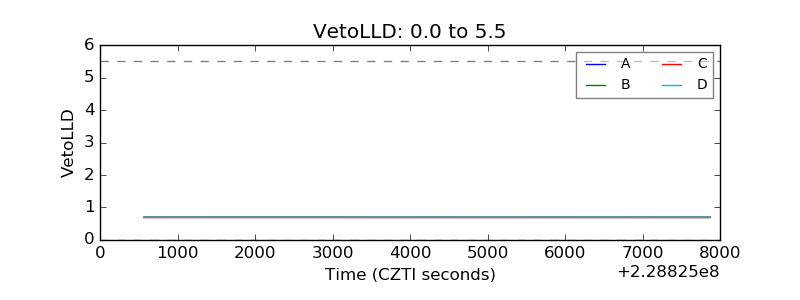 |
| Alpha Counter | 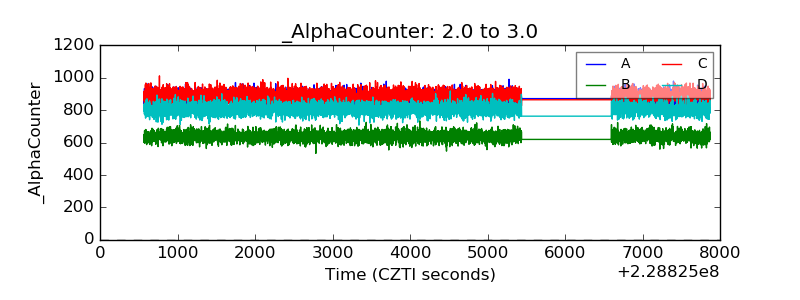 |
| _CPM_Rate | 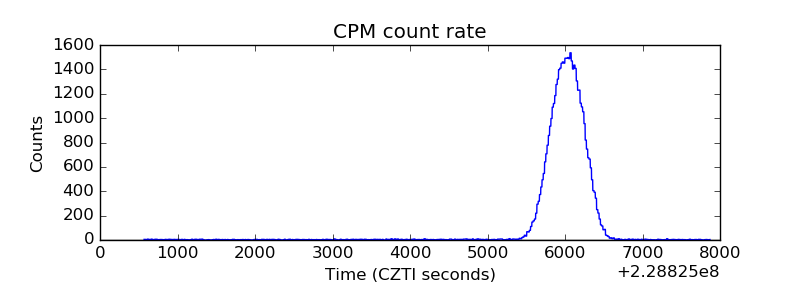 |
| CZT Counter | 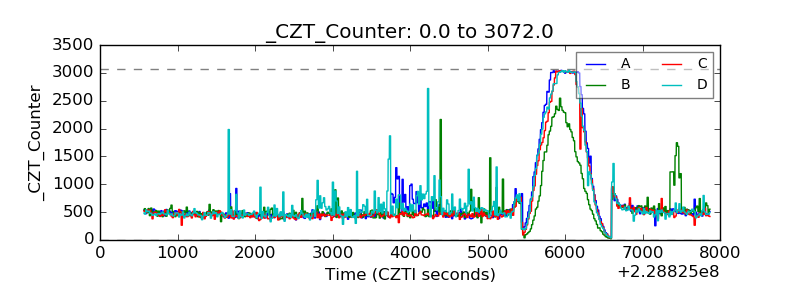 |
| +2.5 Volts monitor |  |
| +5 Volts monitor |  |
| _ROLL_ROT | 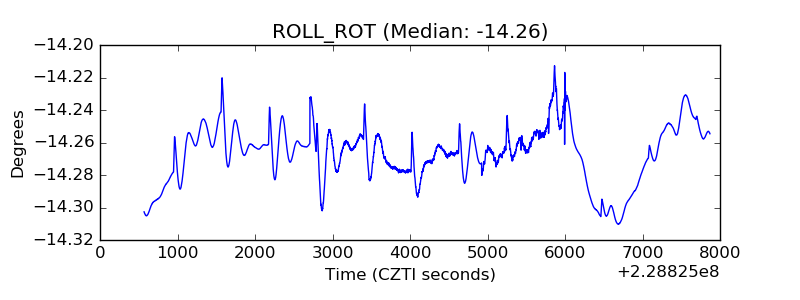 |
| _Roll_DEC | 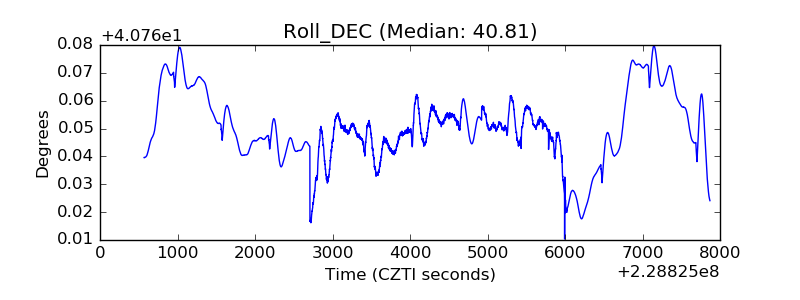 |
| _Roll_RA | 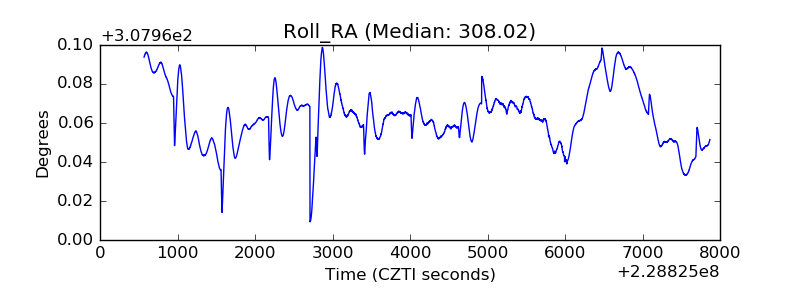 |
| Veto Counter | 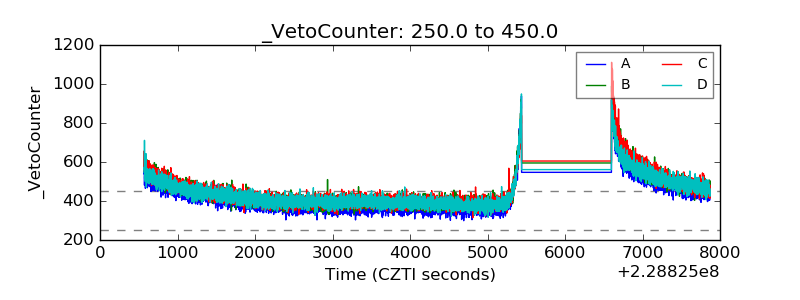 |