| Param | Original file | Final file |
|---|---|---|
| Filename | modeM0/AS1G07_043T01_9000001126_08179cztM0_level2.evt | modeM0/AS1G07_043T01_9000001126_08179cztM0_level2_quad_clean.evt |
| Size (bytes) | 205,079,040 | 25,234,560 |
| Size | 195.6 MB | 24.1 MB |
| Events in quadrant A | 1,456,775 | 135,826 |
| Events in quadrant B | 1,587,841 | 136,437 |
| Events in quadrant C | 1,400,547 | 140,299 |
| Events in quadrant D | 1,557,270 | 134,576 |
| Mode M0 | |||
|---|---|---|---|
| Quadrant | BADHDUFLAG | Total packets | Discarded packets |
| A | 0 | 6176 | 0 |
| B | 0 | 6598 | 0 |
| C | 0 | 6092 | 0 |
| D | 0 | 6556 | 0 |
| Mode SS | |||
|---|---|---|---|
| Quadrant | BADHDUFLAG | Total packets | Discarded packets |
| A | 0 | 62 | 0 |
| B | 0 | 62 | 0 |
| C | 0 | 62 | 0 |
| D | 0 | 62 | 0 |
| Quadrant | Total seconds | Saturated seconds | Saturation percentage |
|---|---|---|---|
| A | 3031 | 2 | 0.065985% |
| B | 3031 | 43 | 1.418674% |
| C | 3031 | 0 | 0.000000% |
| D | 3031 | 22 | 0.725833% |
Noise dominated data is calculated using 1-second bins in cleaned event files. If a bin has >2000 counts, and if more than 50% of those come from <1% of pixels, then it is considered to be noise-dominated and hence unusable.
| Quadrant | # 1 sec bins | Bins with >0 counts | Bins with >2000 counts | High rate bins dominated by noise | Noise dominated (total time) | Noise dominated (detector-on time) | Marked lightcurve |
|---|---|---|---|---|---|---|---|
| A | 3031 | 3031 | 0 | 0 | 0.00% | 0.00% | 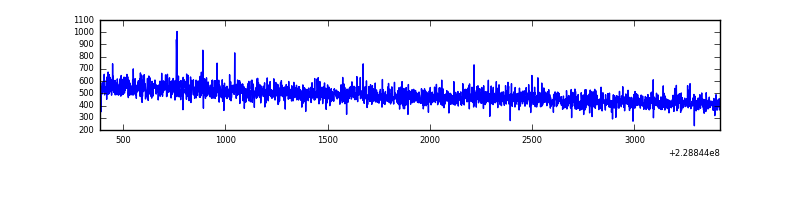 |
| B | 3031 | 3031 | 29 | 29 | 0.96% | 0.96% | 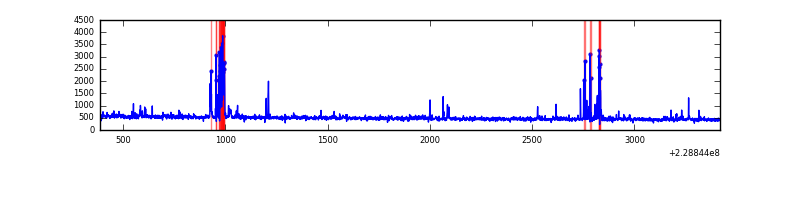 |
| C | 3031 | 3031 | 0 | 0 | 0.00% | 0.00% |  |
| D | 3031 | 3031 | 12 | 12 | 0.40% | 0.40% | 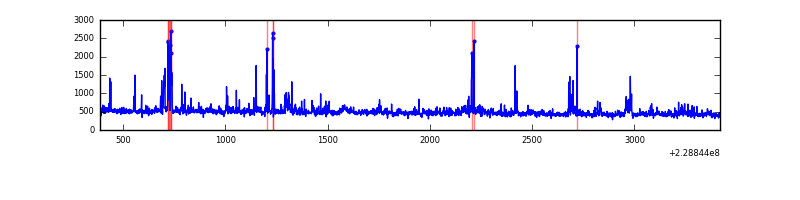 |
Top three noisy pixels from each quadrant. If the there are fewer than three noisy pixels in the level2.evt file, extra rows are filled as -1
| Pixel properties | Quadrant properties | ||||||
|---|---|---|---|---|---|---|---|
| Quadrant | DetID | PixID | Counts | Sigma | Mean | Median | Sigma |
| A | 8 | 15 | 45730 | 594.56 | 365 | 358 | 76.3 |
| A | 13 | 254 | 4049 | 48.37 | 365 | 358 | 76.3 |
| A | 0 | 226 | 3504 | 41.23 | 365 | 358 | 76.3 |
| B | 0 | 213 | 125444 | 1813.27 | 363 | 355 | 69.0 |
| B | 15 | 204 | 13893 | 196.24 | 363 | 355 | 69.0 |
| B | 0 | 230 | 9538 | 133.12 | 363 | 355 | 69.0 |
| C | 13 | 61 | 2821 | 29.35 | 358 | 360 | 83.8 |
| C | 14 | 67 | 1183 | 9.82 | 358 | 360 | 83.8 |
| C | 12 | 4 | 1130 | 9.18 | 358 | 360 | 83.8 |
| D | 5 | 233 | 91637 | 1032.07 | 358 | 347 | 88.5 |
| D | 2 | 136 | 30871 | 345.08 | 358 | 347 | 88.5 |
| D | 13 | 105 | 20601 | 228.98 | 358 | 347 | 88.5 |
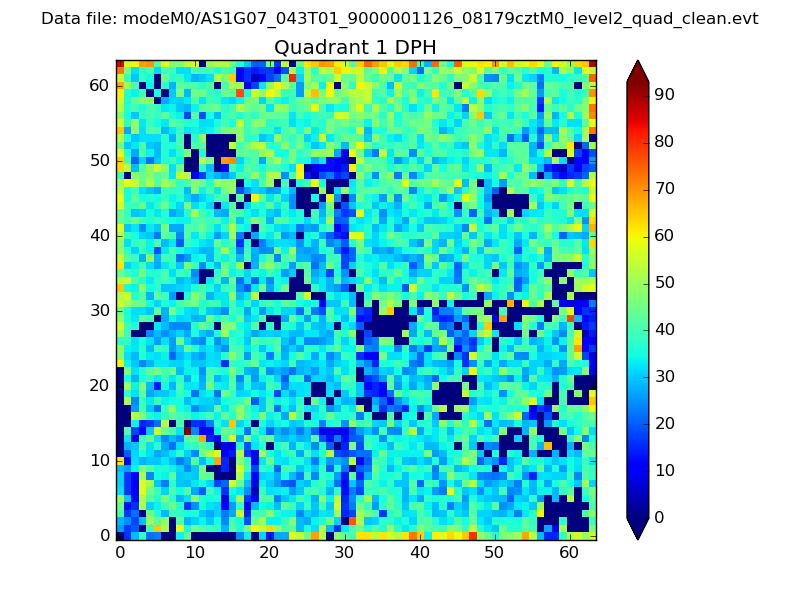
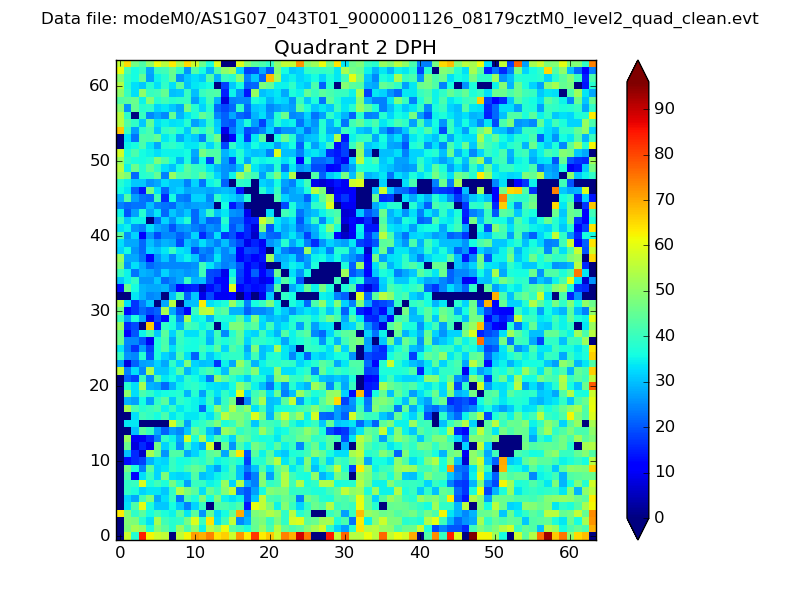
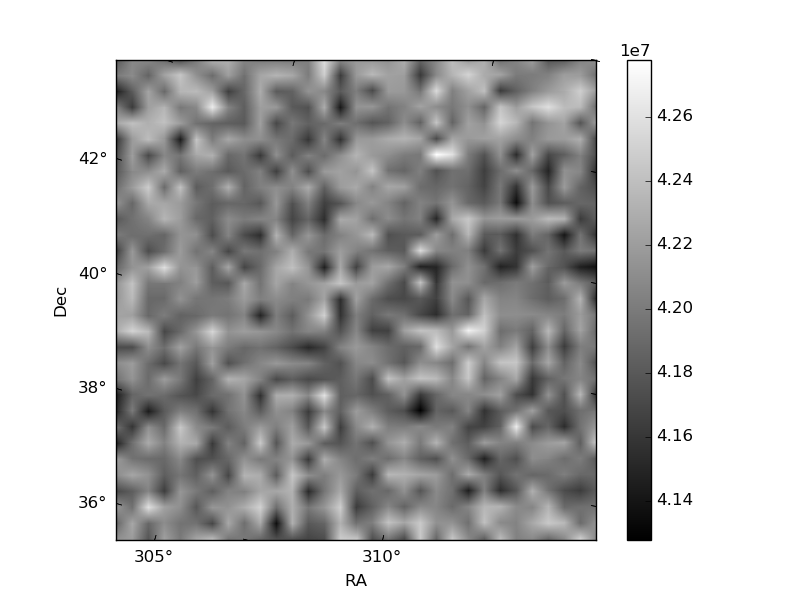
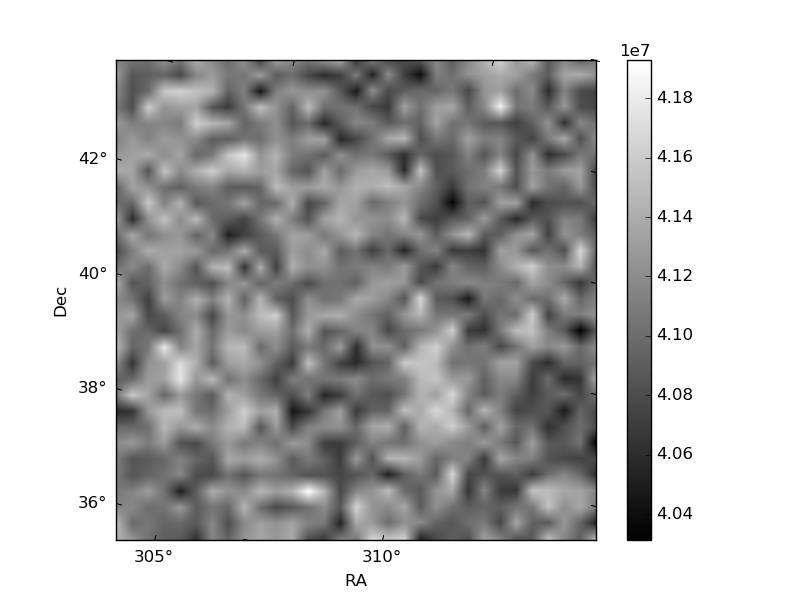
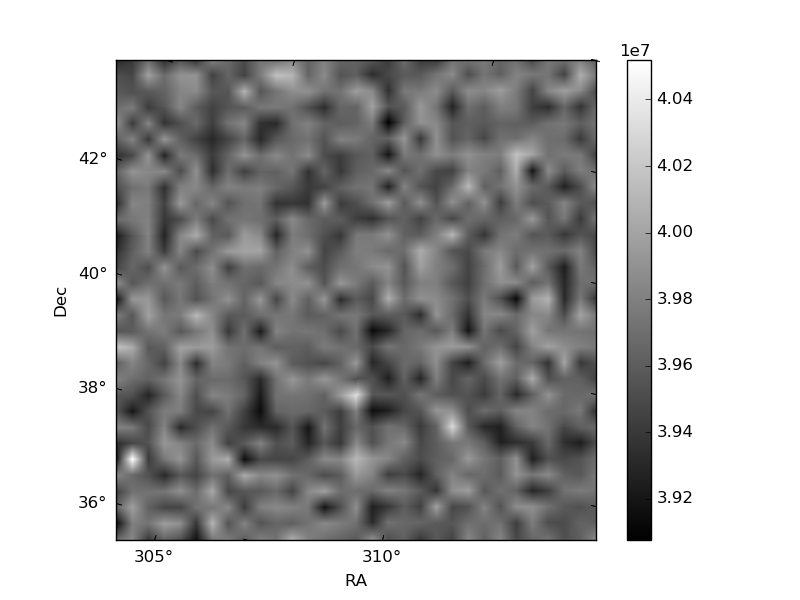
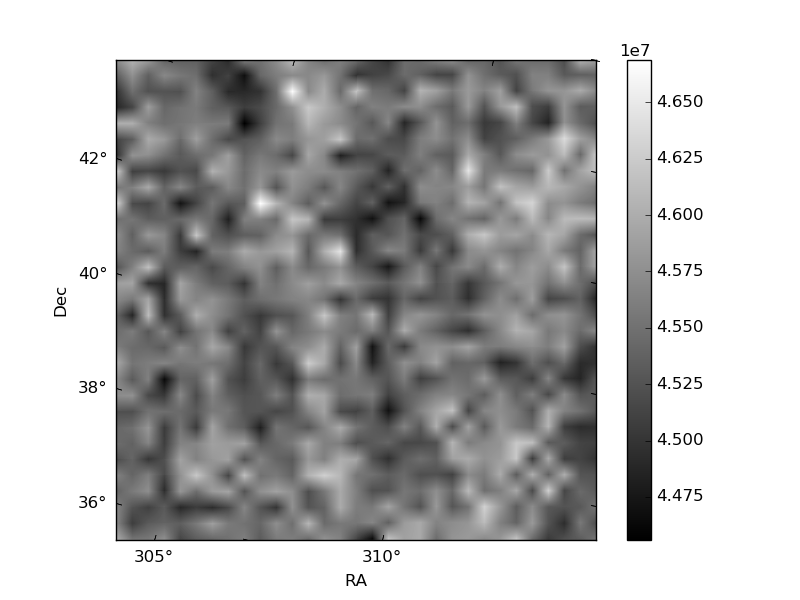
Histogram calculated using DETX and DETY for each event in the final _common_clean file
| Quadrant A | 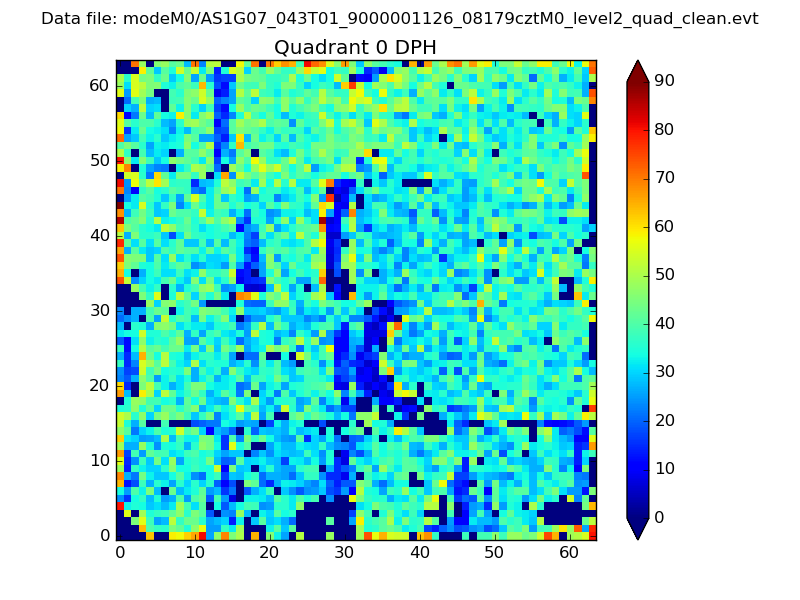 |
 |
Quadrant B |
|---|---|---|---|
| Quadrant D |  |
 |
Quadrant C |
| Plot type | Count rate plots | Images |
|---|---|---|
| Comparison with Poisson distribution Blue bars denote a histogram of data divided into 1 sec bins. Red curve is a Poisson curve with rate = median count rate of data. |
 |
 |
| Quadrant-wise count rates Data is divided into 100 sec bins |
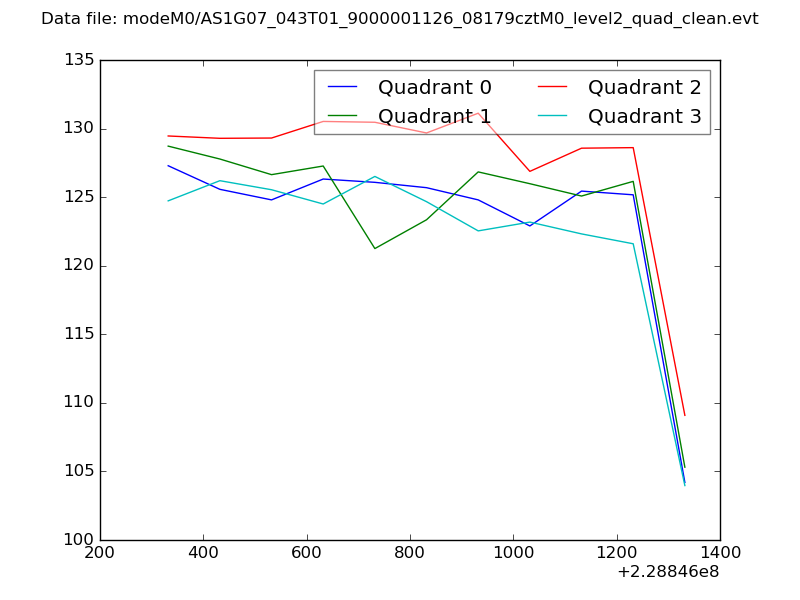 |
|
| Module-wise count rates for Quadrant A Data is divided into 100 sec bins |
 |
 |
| Module-wise count rates for Quadrant B Data is divided into 100 sec bins |
 |
 |
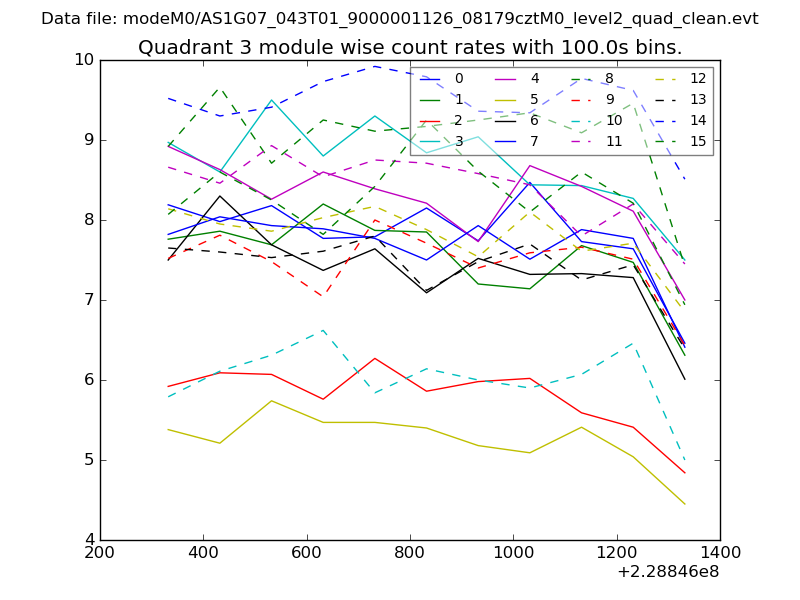
| Module-wise count rates for Quadrant C Data is divided into 100 sec bins |
 |
 |
| Module-wise count rates for Quadrant D Data is divided into 100 sec bins |
 |
 |
| Parameter | Plot |
|---|---|
| CZT HV Monitor |  |
| D_VDD | 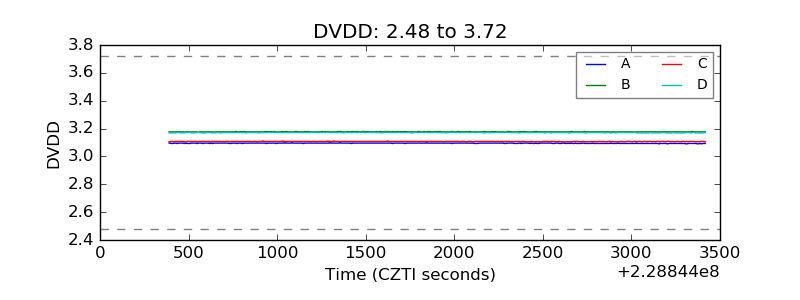 |
| Temperature 1 | 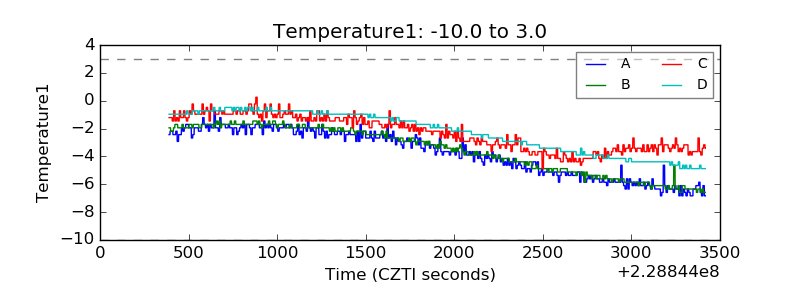 |
| Veto HV Monitor | 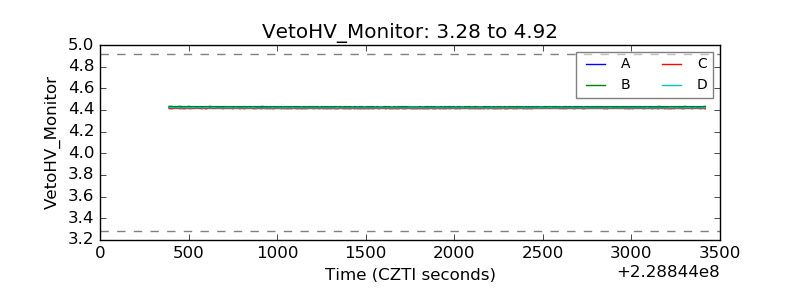 |
| Veto LLD | 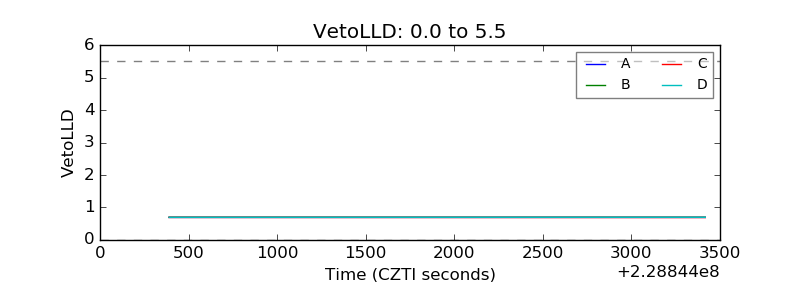 |
| Alpha Counter | 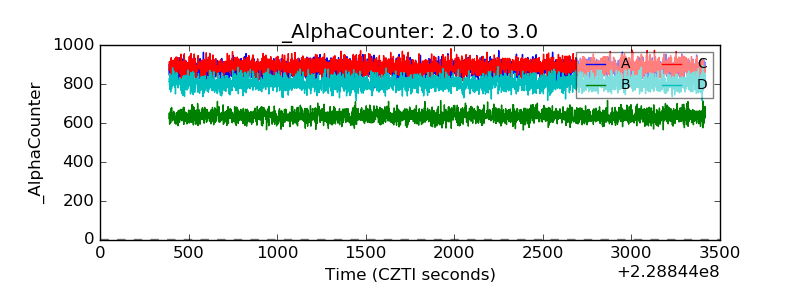 |
| _CPM_Rate | 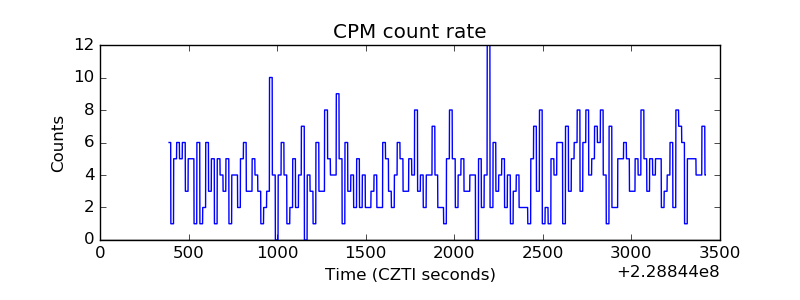 |
| CZT Counter | 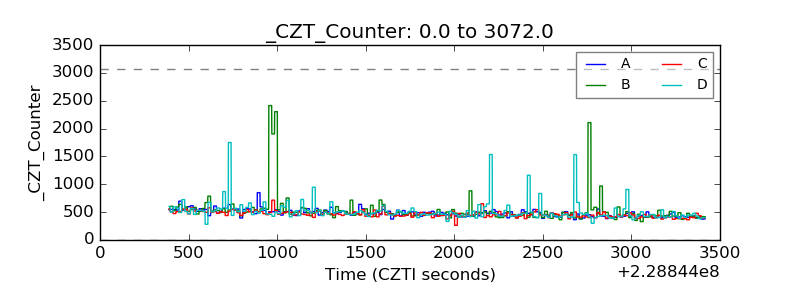 |
| +2.5 Volts monitor |  |
| +5 Volts monitor |  |
| _ROLL_ROT | 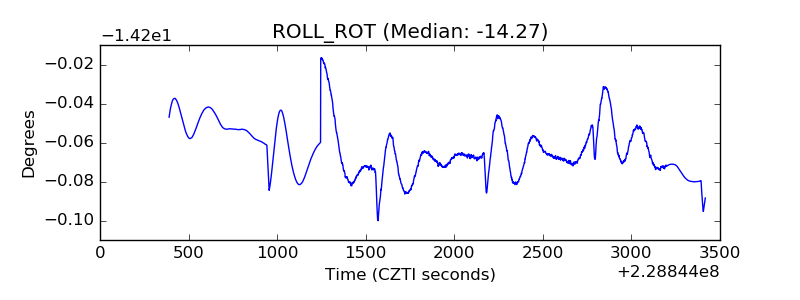 |
| _Roll_DEC | 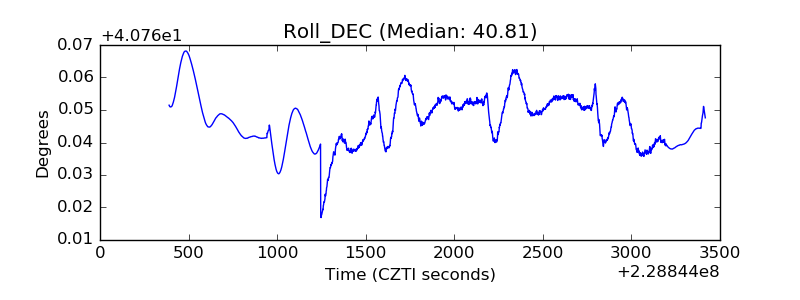 |
| _Roll_RA | 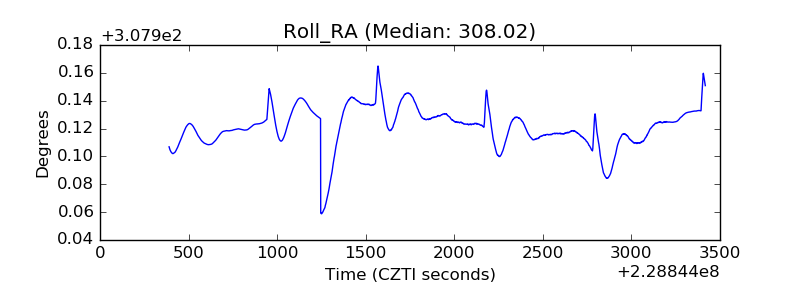 |
| Veto Counter |  |