| Param | Original file | Final file |
|---|---|---|
| Filename | modeM0/AS1G07_046T01_9000001124cztM0_level2.fits | modeM0/AS1G07_046T01_9000001124cztM0_level2_quad_clean.evt |
| Size (bytes) | 425,638,080 | 336,182,400 |
| Size | 405.9 MB | 320.6 MB |
| Events in quadrant A | 2,597,174 | 1,851,167 |
| Events in quadrant B | 2,485,154 | 1,840,060 |
| Events in quadrant C | 2,545,914 | 1,793,430 |
| Events in quadrant D | 2,151,960 | 1,586,282 |
| Mode M0 | |||
|---|---|---|---|
| Quadrant | BADHDUFLAG | Total packets | Discarded packets |
| A | 0 | 93260 | 0 |
| B | 0 | 95936 | 0 |
| C | 0 | 97690 | 0 |
| D | 0 | 122361 | 0 |
| Mode SS | |||
|---|---|---|---|
| Quadrant | BADHDUFLAG | Total packets | Discarded packets |
| A | 0 | 926 | 0 |
| B | 0 | 920 | 0 |
| C | 0 | 926 | 0 |
| D | 0 | 928 | 0 |
| Mode M9 | |||
|---|---|---|---|
| Quadrant | BADHDUFLAG | Total packets | Discarded packets |
| A | 0 | 63 | 0 |
| B | 0 | 63 | 0 |
| C | 0 | 63 | 0 |
| D | 0 | 63 | 0 |
| Quadrant | Total seconds | Saturated seconds | Saturation percentage |
|---|---|---|---|
| A | 45301 | 435 | 0.960244% |
| B | 45289 | 528 | 1.165846% |
| C | 45275 | 329 | 0.726670% |
| D | 45259 | 2640 | 5.833094% |
Noise dominated data is calculated using 1-second bins in cleaned event files. If a bin has >2000 counts, and if more than 50% of those come from <1% of pixels, then it is considered to be noise-dominated and hence unusable.
| Quadrant | # 1 sec bins | Bins with >0 counts | Bins with >2000 counts | High rate bins dominated by noise | Noise dominated (total time) | Noise dominated (detector-on time) | Marked lightcurve |
|---|---|---|---|---|---|---|---|
| A | 52481 | 45664 | 0 | 0 | 0.00% | 0.00% | 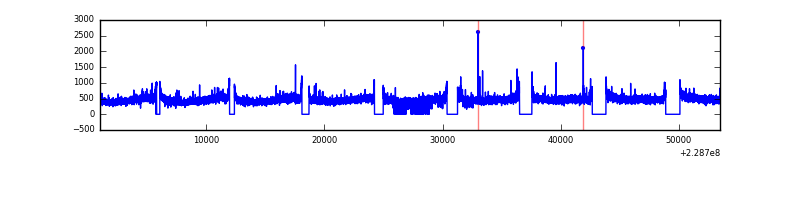 |
| B | 52481 | 45626 | 0 | 0 | 0.00% | 0.00% |  |
| C | 52481 | 45652 | 0 | 0 | 0.00% | 0.00% |  |
| D | 52481 | 45501 | 0 | 0 | 0.00% | 0.00% |  |
Top three noisy pixels from each quadrant. If the there are fewer than three noisy pixels in the level2.evt file, extra rows are filled as -1
| Pixel properties | Quadrant properties | ||||||
|---|---|---|---|---|---|---|---|
| Quadrant | DetID | PixID | Counts | Sigma | Mean | Median | Sigma |
| A | 14 | 188 | 2600 | 11.58 | 672 | 627 | 170.3 |
| A | 0 | 29 | 2569 | 11.4 | 672 | 627 | 170.3 |
| A | 7 | 110 | 2231 | 9.42 | 672 | 627 | 170.3 |
| B | 2 | 9 | 2098 | 11.05 | 656 | 622 | 133.6 |
| B | 12 | 226 | 1669 | 7.84 | 656 | 622 | 133.6 |
| B | 14 | 254 | 1650 | 7.69 | 656 | 622 | 133.6 |
| C | 1 | 80 | 1885 | 7.06 | 672 | 622 | 178.9 |
| C | 1 | 81 | 1836 | 6.79 | 672 | 622 | 178.9 |
| C | 12 | 241 | 1753 | 6.32 | 672 | 622 | 178.9 |
| D | 6 | 231 | 1631 | 6.6 | 612 | 556 | 162.7 |
| D | 3 | 14 | 1590 | 6.35 | 612 | 556 | 162.7 |
| D | 1 | 19 | 1571 | 6.24 | 612 | 556 | 162.7 |
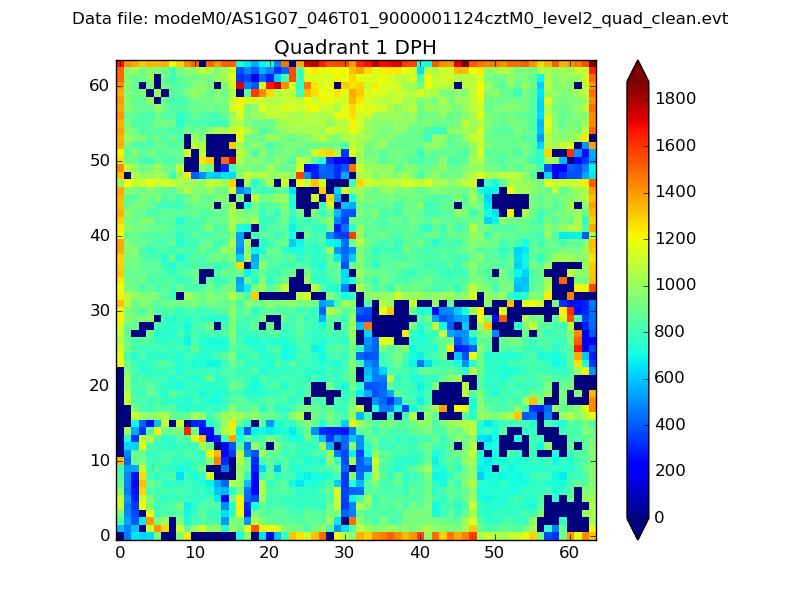
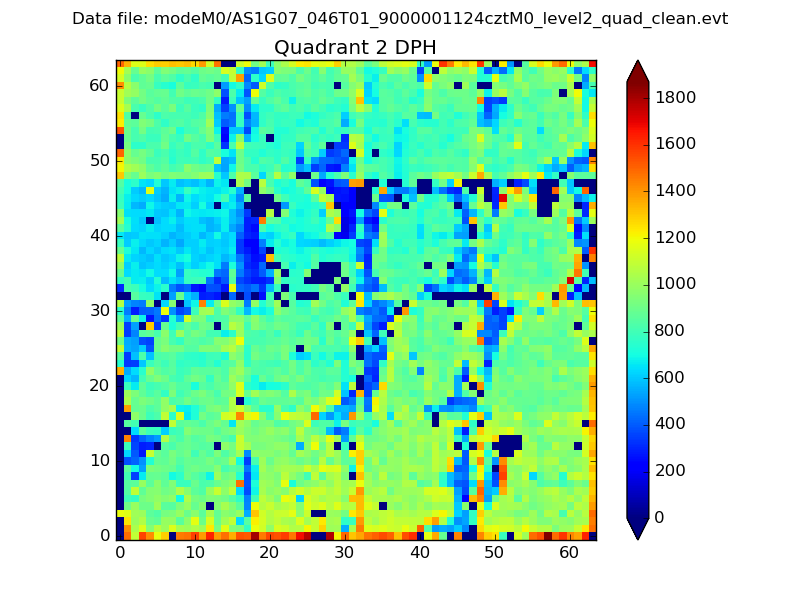
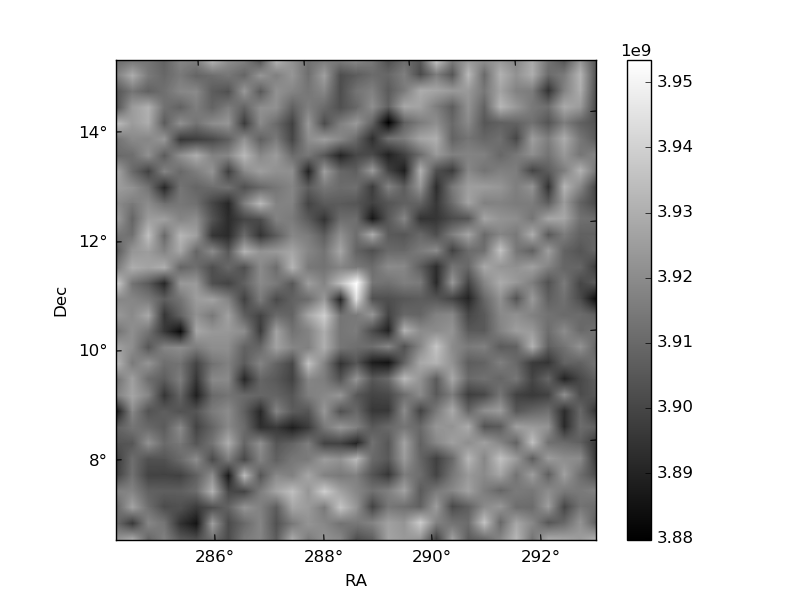
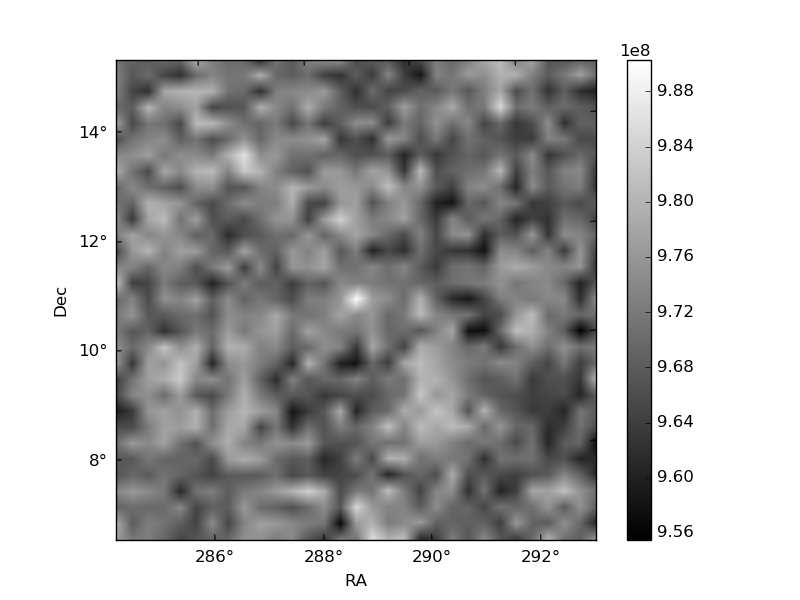
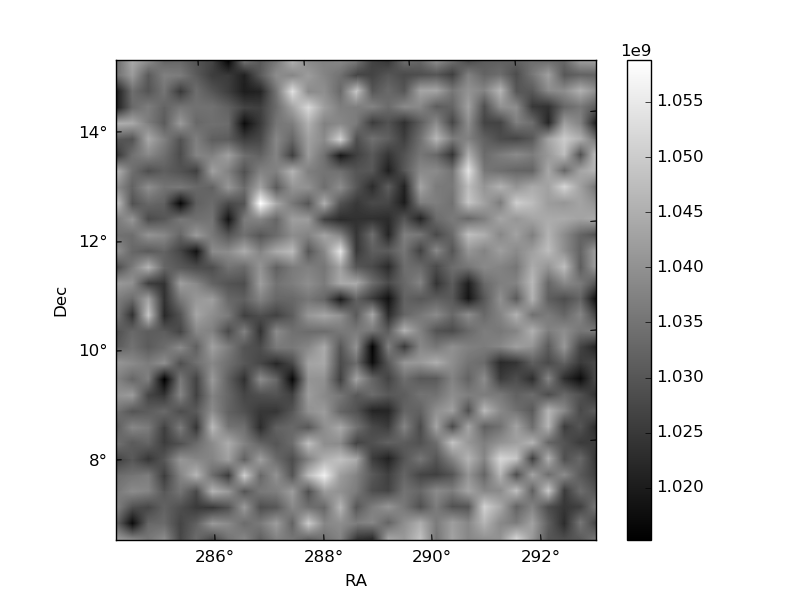
Histogram calculated using DETX and DETY for each event in the final _common_clean file
| Quadrant A |  |
 |
Quadrant B |
|---|---|---|---|
| Quadrant D | 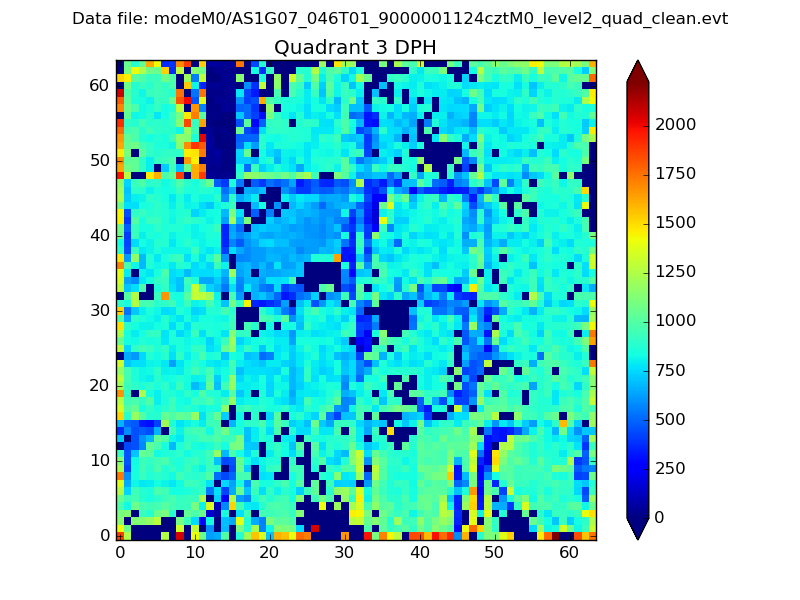 |
 |
Quadrant C |
| Plot type | Count rate plots | Images |
|---|---|---|
| Comparison with Poisson distribution Blue bars denote a histogram of data divided into 1 sec bins. Red curve is a Poisson curve with rate = median count rate of data. |
 |
 |
| Quadrant-wise count rates Data is divided into 100 sec bins |
 |
|
| Module-wise count rates for Quadrant A Data is divided into 100 sec bins |
 |
 |
| Module-wise count rates for Quadrant B Data is divided into 100 sec bins |
 |
 |
| Module-wise count rates for Quadrant C Data is divided into 100 sec bins |
 |
 |
| Module-wise count rates for Quadrant D Data is divided into 100 sec bins |
 |
 |
| Parameter | Plot |
|---|---|
| CZT HV Monitor |  |
| D_VDD | 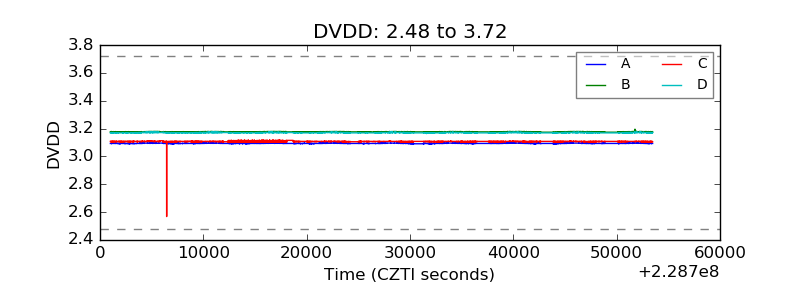 |
| Temperature 1 | 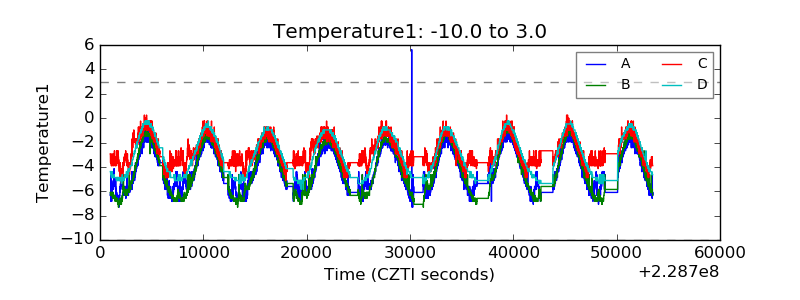 |
| Veto HV Monitor |  |
| Veto LLD |  |
| Alpha Counter |  |
| _CPM_Rate |  |
| CZT Counter |  |
| +2.5 Volts monitor |  |
| +5 Volts monitor |  |
| _ROLL_ROT |  |
| _Roll_DEC |  |
| _Roll_RA |  |
| Veto Counter | 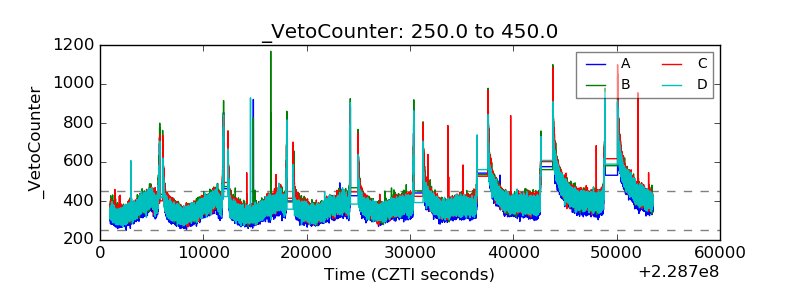 |