| Param | Original file | Final file |
|---|---|---|
| Filename | modeM0/AS1G07_046T01_9000001124_08158cztM0_level2.evt | modeM0/AS1G07_046T01_9000001124_08158cztM0_level2_quad_clean.evt |
| Size (bytes) | 1,491,989,760 | 266,886,720 |
| Size | 1.4 GB | 254.5 MB |
| Events in quadrant A | 10,113,123 | 1,653,058 |
| Events in quadrant B | 10,737,341 | 1,666,119 |
| Events in quadrant C | 10,660,672 | 1,672,569 |
| Events in quadrant D | 12,184,182 | 1,575,256 |
| Mode M0 | |||
|---|---|---|---|
| Quadrant | BADHDUFLAG | Total packets | Discarded packets |
| A | 0 | 46656 | 1602 |
| B | 0 | 47880 | 1643 |
| C | 0 | 47594 | 1655 |
| D | 0 | 53828 | 1930 |
| Mode SS | |||
|---|---|---|---|
| Quadrant | BADHDUFLAG | Total packets | Discarded packets |
| A | 0 | 466 | 12 |
| B | 0 | 466 | 18 |
| C | 0 | 466 | 12 |
| D | 0 | 466 | 10 |
| Mode M9 | |||
|---|---|---|---|
| Quadrant | BADHDUFLAG | Total packets | Discarded packets |
| A | 0 | 26 | 0 |
| B | 0 | 26 | 0 |
| C | 0 | 26 | 0 |
| D | 0 | 26 | 0 |
| Quadrant | Total seconds | Saturated seconds | Saturation percentage |
|---|---|---|---|
| A | 22030 | 194 | 0.880617% |
| B | 22015 | 236 | 1.071996% |
| C | 22002 | 117 | 0.531770% |
| D | 21984 | 521 | 2.369905% |
Noise dominated data is calculated using 1-second bins in cleaned event files. If a bin has >2000 counts, and if more than 50% of those come from <1% of pixels, then it is considered to be noise-dominated and hence unusable.
| Quadrant | # 1 sec bins | Bins with >0 counts | Bins with >2000 counts | High rate bins dominated by noise | Noise dominated (total time) | Noise dominated (detector-on time) | Marked lightcurve |
|---|---|---|---|---|---|---|---|
| A | 25481 | 22394 | 0 | 0 | 0.00% | 0.00% | 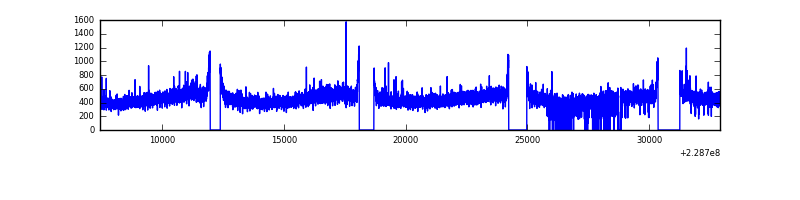 |
| B | 25481 | 22362 | 27 | 27 | 0.11% | 0.12% | 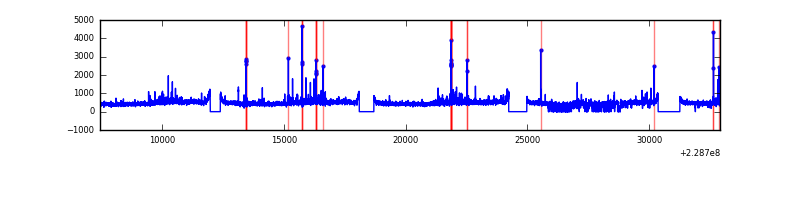 |
| C | 25481 | 22382 | 0 | 0 | 0.00% | 0.00% | 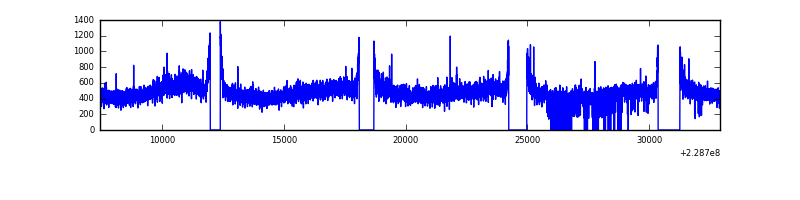 |
| D | 25481 | 22339 | 238 | 238 | 0.93% | 1.07% | 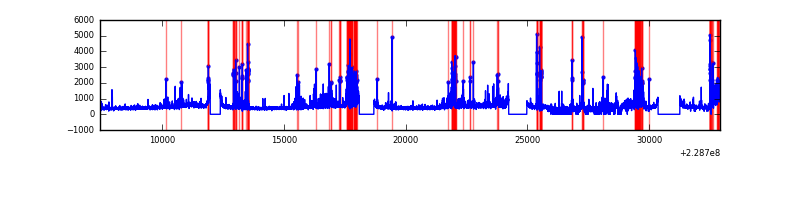 |
Top three noisy pixels from each quadrant. If the there are fewer than three noisy pixels in the level2.evt file, extra rows are filled as -1
| Pixel properties | Quadrant properties | ||||||
|---|---|---|---|---|---|---|---|
| Quadrant | DetID | PixID | Counts | Sigma | Mean | Median | Sigma |
| A | 0 | 226 | 24884 | 41.7 | 2618 | 2561 | 535.3 |
| A | 12 | 194 | 23280 | 38.71 | 2618 | 2561 | 535.3 |
| A | 13 | 251 | 21161 | 34.75 | 2618 | 2561 | 535.3 |
| B | 0 | 214 | 321976 | 641.26 | 2623 | 2561 | 498.1 |
| B | 10 | 16 | 108353 | 212.39 | 2623 | 2561 | 498.1 |
| B | 0 | 219 | 53479 | 102.22 | 2623 | 2561 | 498.1 |
| C | 1 | 16 | 729917 | 1228.39 | 2539 | 2555 | 592.1 |
| C | 13 | 61 | 19302 | 28.28 | 2539 | 2555 | 592.1 |
| C | 8 | 222 | 15664 | 22.14 | 2539 | 2555 | 592.1 |
| D | 2 | 152 | 852313 | 1375.11 | 2520 | 2446 | 618.0 |
| D | 5 | 233 | 618671 | 997.07 | 2520 | 2446 | 618.0 |
| D | 13 | 105 | 348538 | 559.99 | 2520 | 2446 | 618.0 |
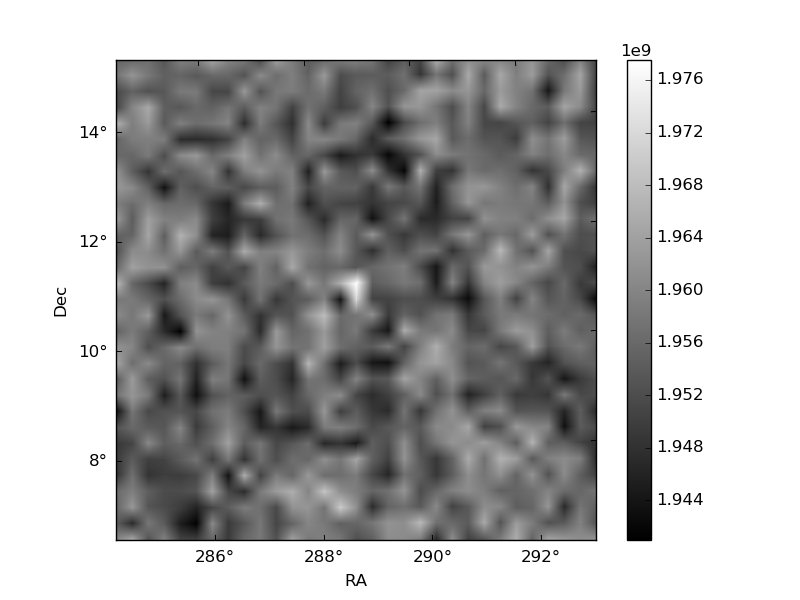
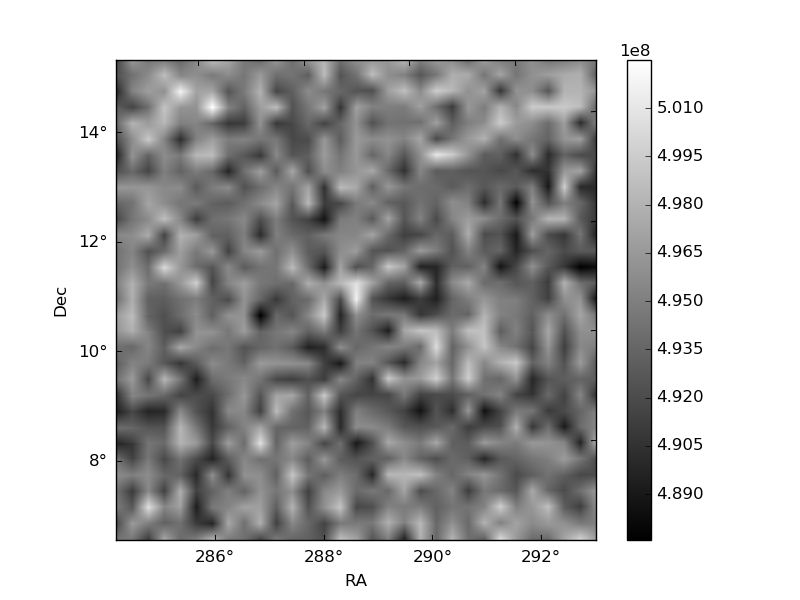
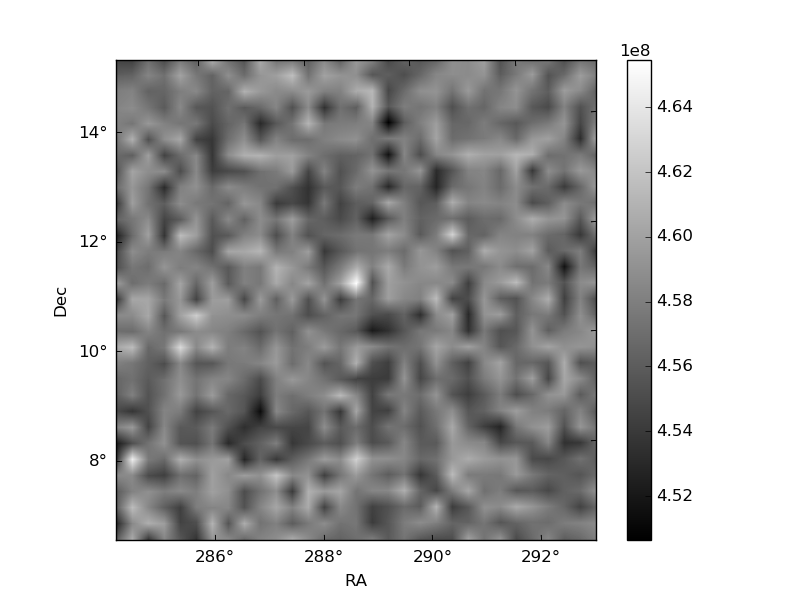
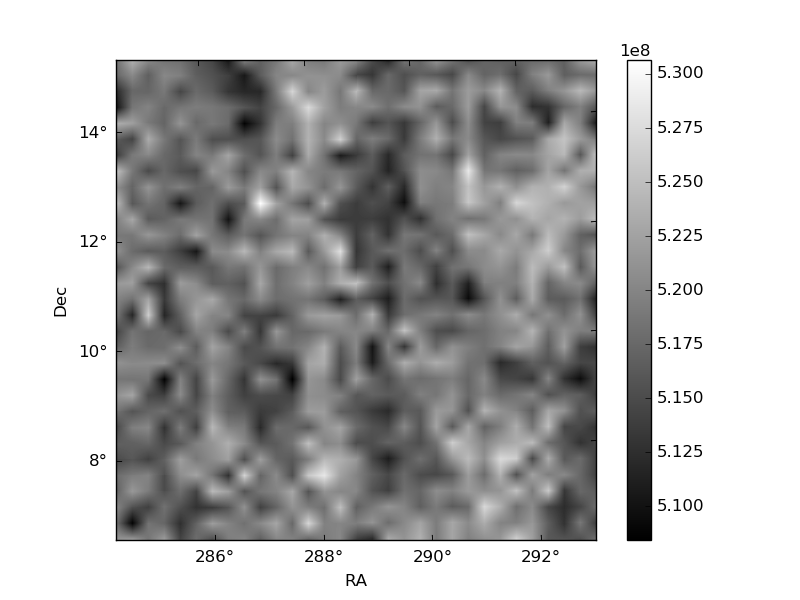
Histogram calculated using DETX and DETY for each event in the final _common_clean file
| Quadrant A | 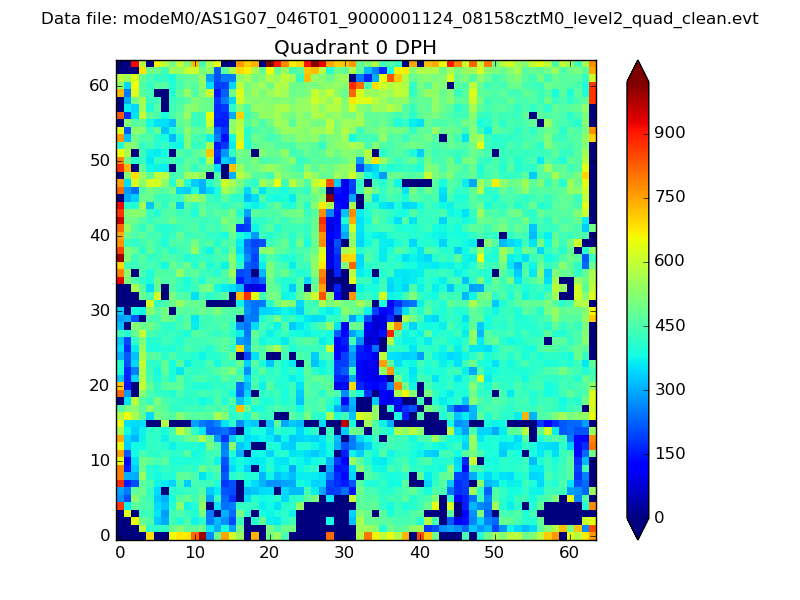 |
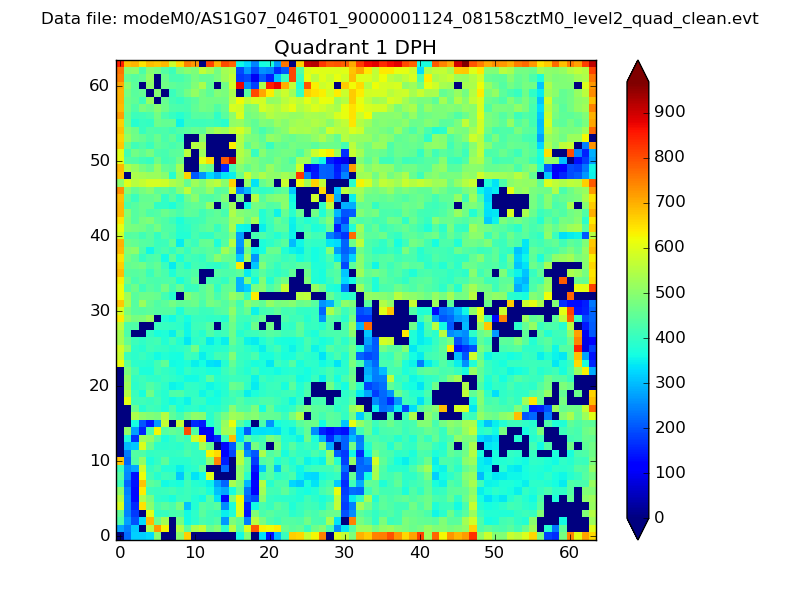 |
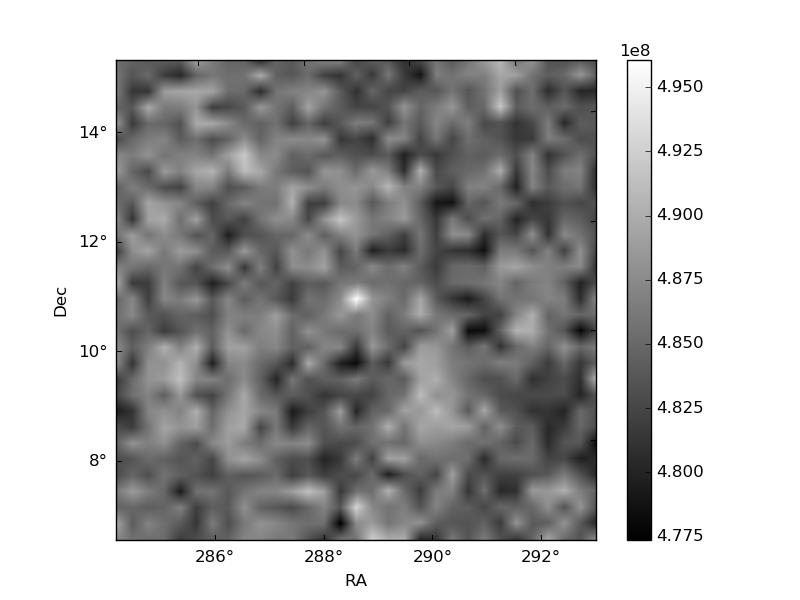
Quadrant B |
|---|---|---|---|
| Quadrant D | 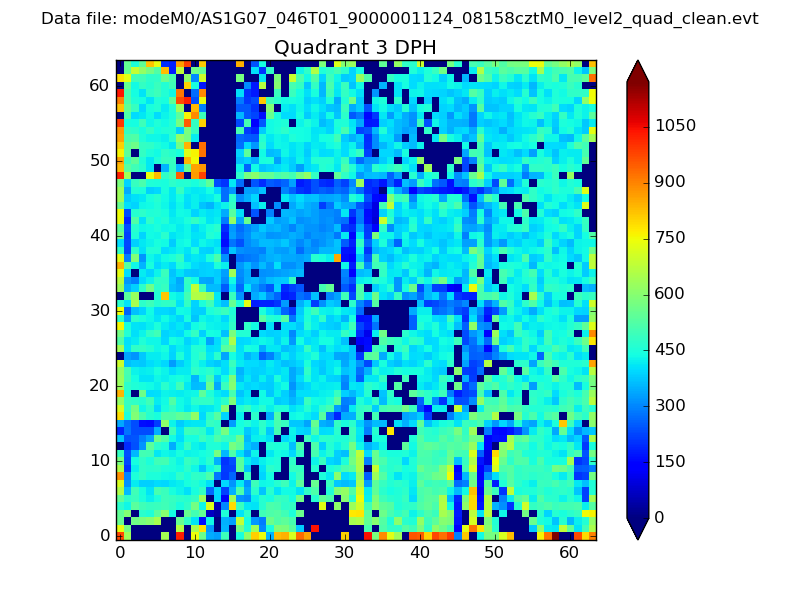 |
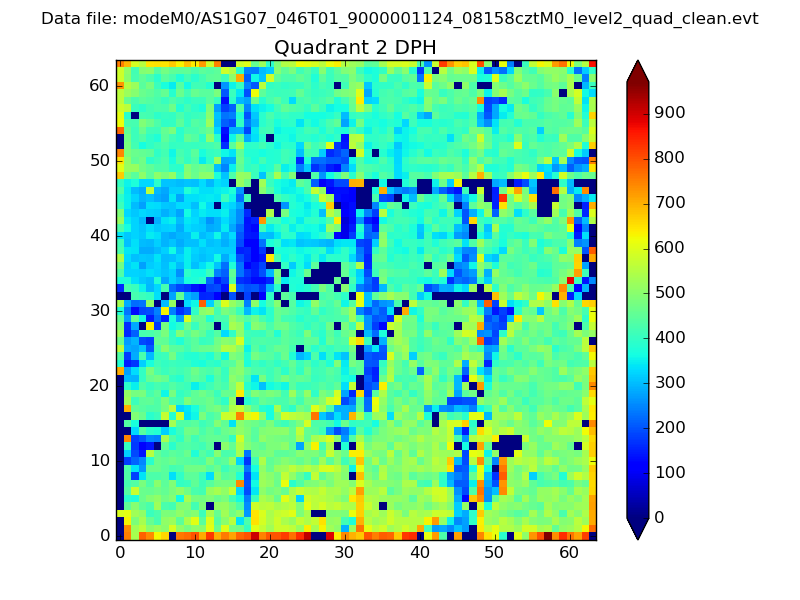 |
Quadrant C |
| Plot type | Count rate plots | Images |
|---|---|---|
| Comparison with Poisson distribution Blue bars denote a histogram of data divided into 1 sec bins. Red curve is a Poisson curve with rate = median count rate of data. |
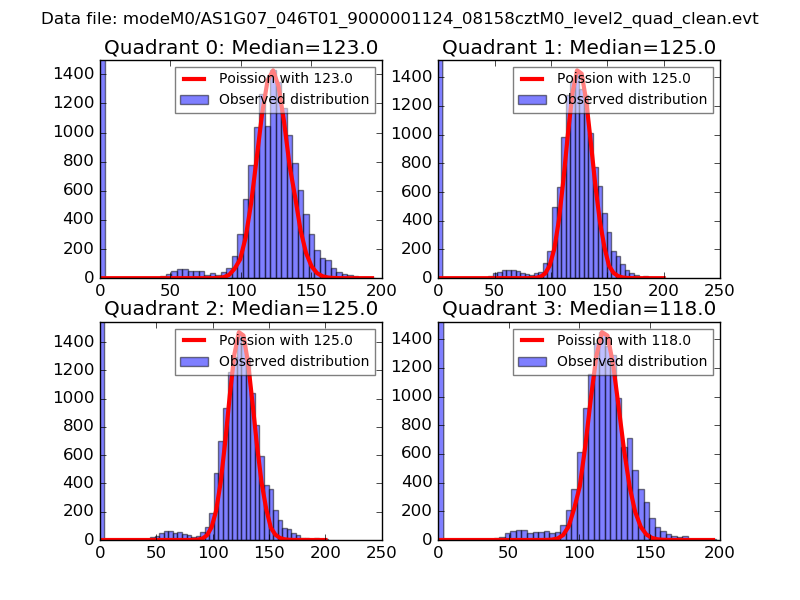 |
 |
| Quadrant-wise count rates Data is divided into 100 sec bins |
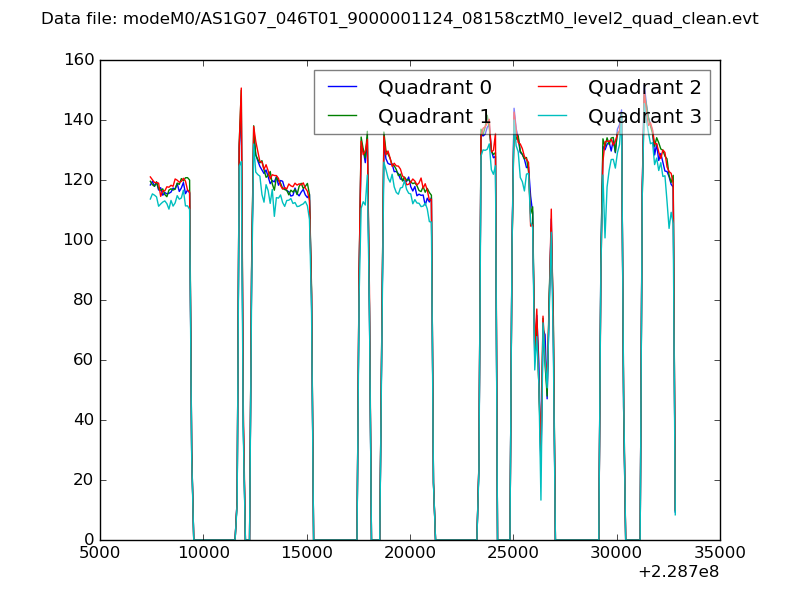 |
|
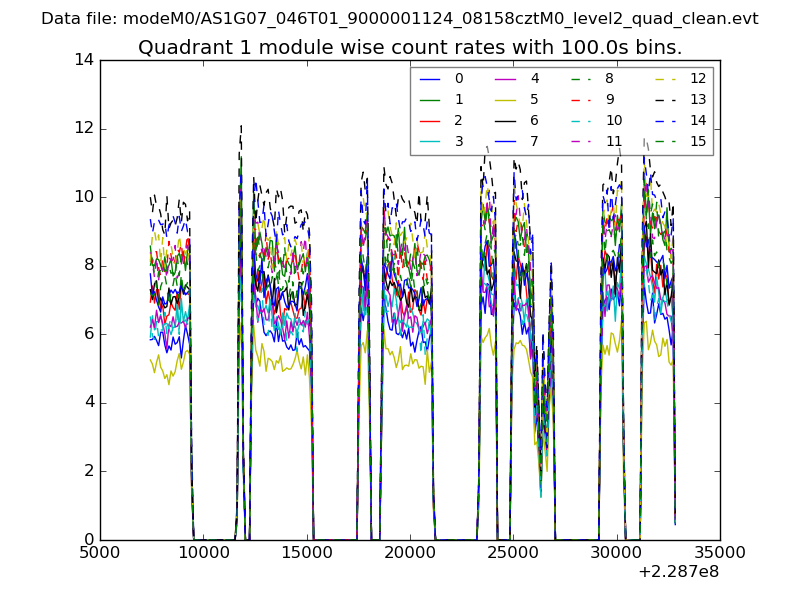
| Module-wise count rates for Quadrant A Data is divided into 100 sec bins |
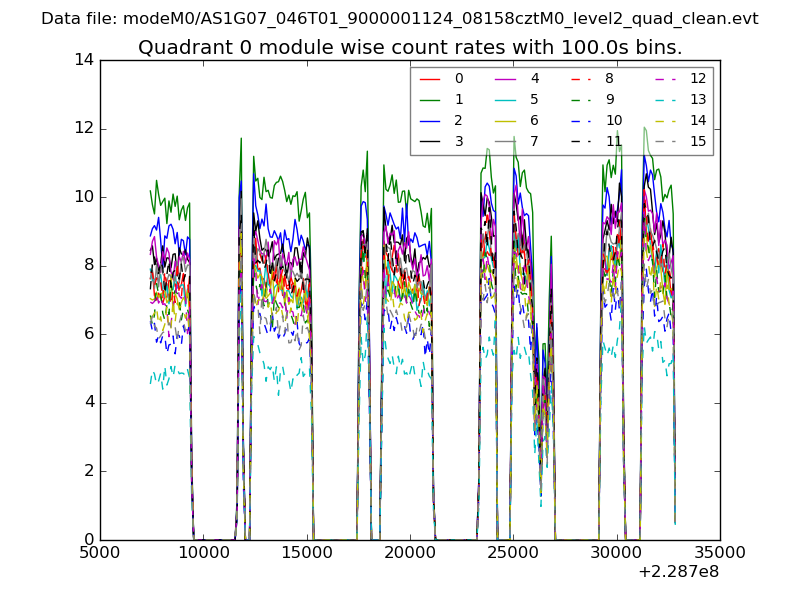 |
 |
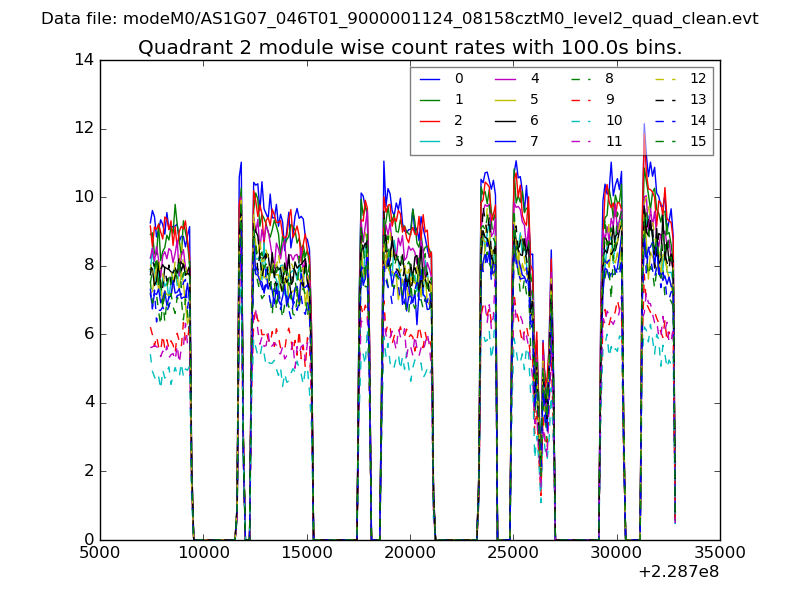
| Module-wise count rates for Quadrant B Data is divided into 100 sec bins |
 |
 |
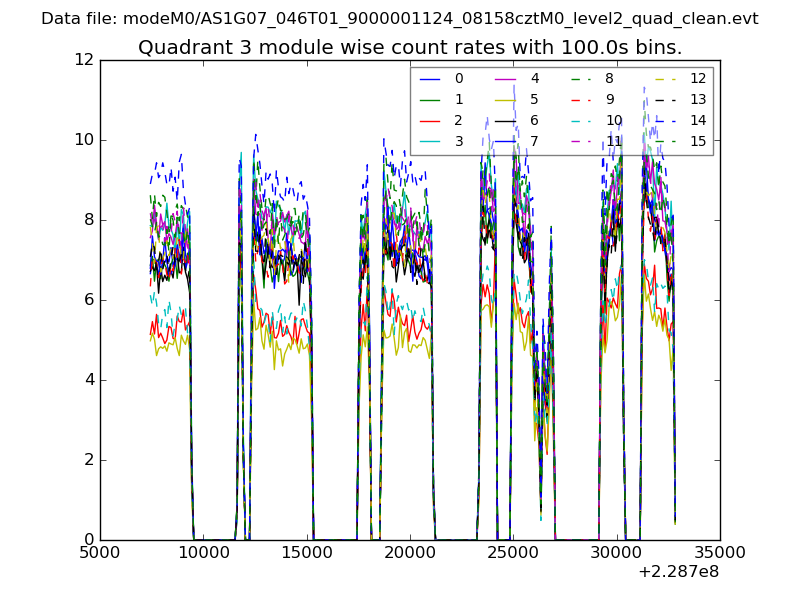
| Module-wise count rates for Quadrant C Data is divided into 100 sec bins |
 |
 |
| Module-wise count rates for Quadrant D Data is divided into 100 sec bins |
 |
 |
| Parameter | Plot |
|---|---|
| CZT HV Monitor | 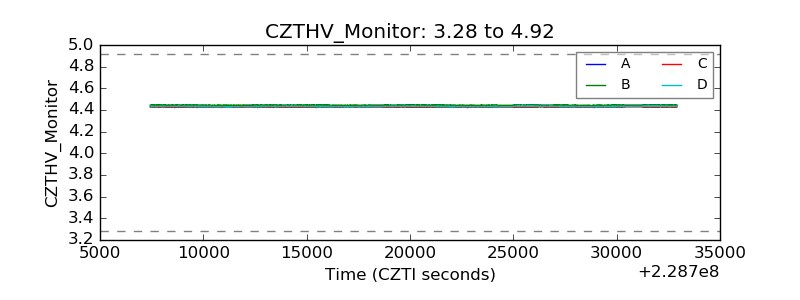 |
| D_VDD |  |
| Temperature 1 | 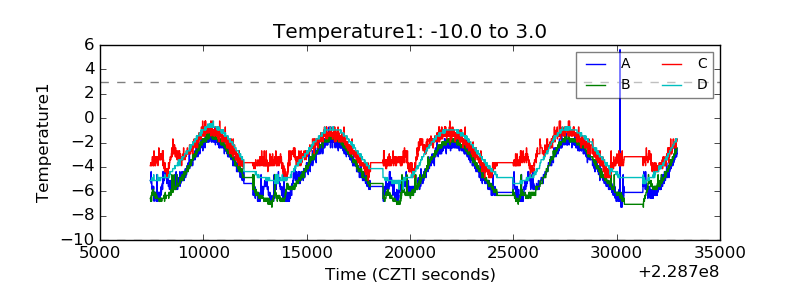 |
| Veto HV Monitor | 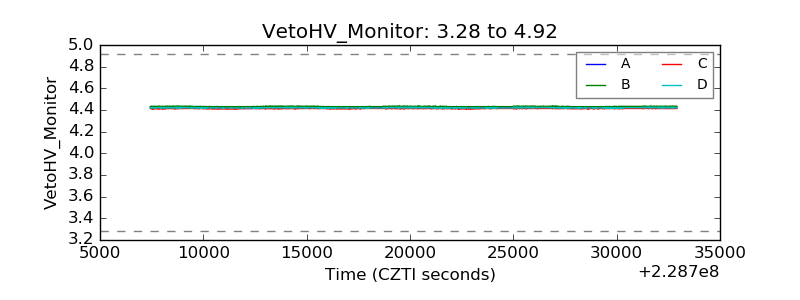 |
| Veto LLD | 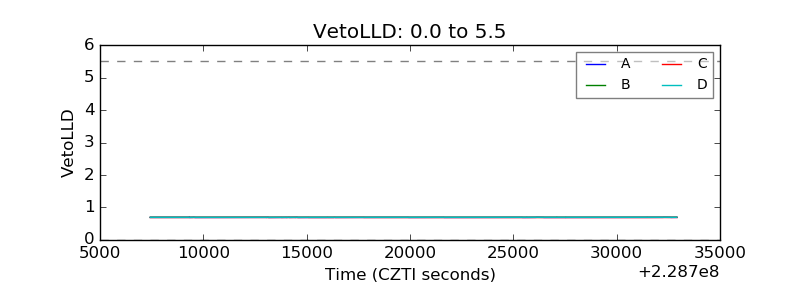 |
| Alpha Counter | 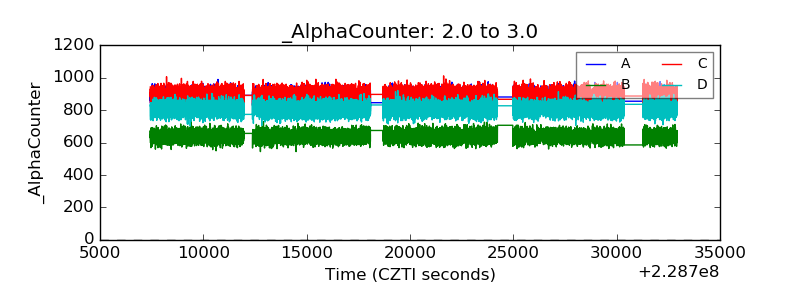 |
| _CPM_Rate |  |
| CZT Counter | 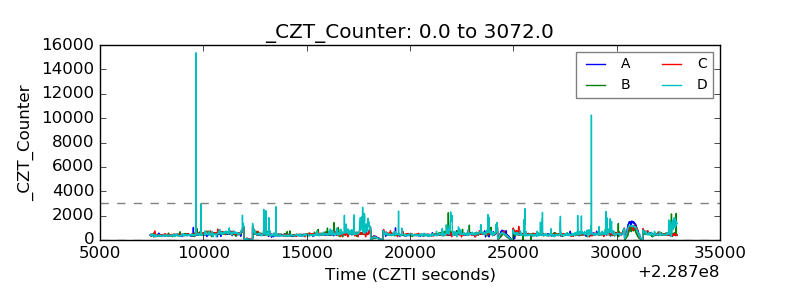 |
| +2.5 Volts monitor |  |
| +5 Volts monitor |  |
| _ROLL_ROT |  |
| _Roll_DEC | 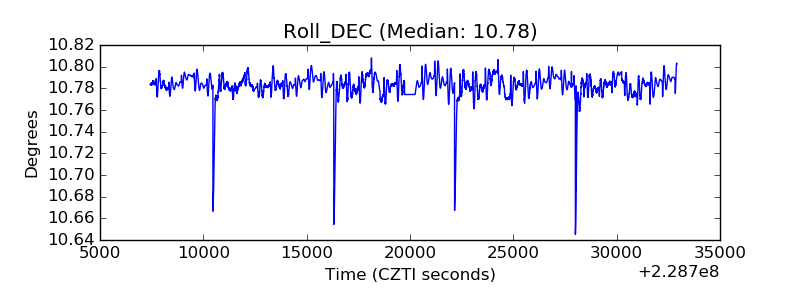 |
| _Roll_RA |  |
| Veto Counter | 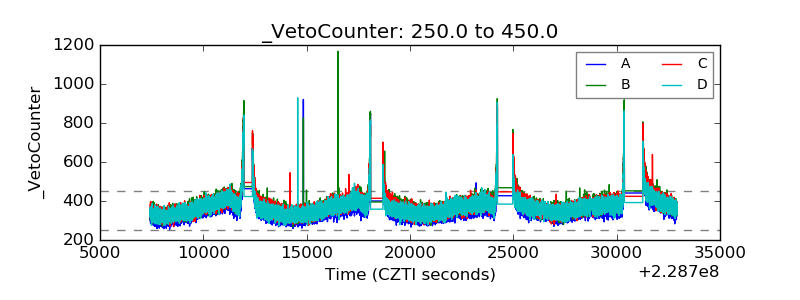 |