| Param | Original file | Final file |
|---|---|---|
| Filename | modeM0/AS1G07_046T01_9000001124_08160cztM0_level2.evt | modeM0/AS1G07_046T01_9000001124_08160cztM0_level2_quad_clean.evt |
| Size (bytes) | 582,094,080 | 81,938,880 |
| Size | 555.1 MB | 78.1 MB |
| Events in quadrant A | 3,117,186 | 513,835 |
| Events in quadrant B | 3,179,171 | 518,529 |
| Events in quadrant C | 3,258,473 | 515,260 |
| Events in quadrant D | 7,631,787 | 478,336 |
| Mode M0 | |||
|---|---|---|---|
| Quadrant | BADHDUFLAG | Total packets | Discarded packets |
| A | 0 | 13410 | 2 |
| B | 0 | 13504 | 1 |
| C | 0 | 13632 | 1 |
| D | 0 | 27011 | 1 |
| Mode SS | |||
|---|---|---|---|
| Quadrant | BADHDUFLAG | Total packets | Discarded packets |
| A | 0 | 132 | 0 |
| B | 0 | 132 | 0 |
| C | 0 | 132 | 0 |
| D | 0 | 132 | 0 |
| Mode M9 | |||
|---|---|---|---|
| Quadrant | BADHDUFLAG | Total packets | Discarded packets |
| A | 0 | 10 | 0 |
| B | 0 | 10 | 0 |
| C | 0 | 10 | 0 |
| D | 0 | 10 | 0 |
| Quadrant | Total seconds | Saturated seconds | Saturation percentage |
|---|---|---|---|
| A | 6527 | 57 | 0.873296% |
| B | 6527 | 50 | 0.766049% |
| C | 6527 | 35 | 0.536234% |
| D | 6527 | 1175 | 18.002145% |
Noise dominated data is calculated using 1-second bins in cleaned event files. If a bin has >2000 counts, and if more than 50% of those come from <1% of pixels, then it is considered to be noise-dominated and hence unusable.
| Quadrant | # 1 sec bins | Bins with >0 counts | Bins with >2000 counts | High rate bins dominated by noise | Noise dominated (total time) | Noise dominated (detector-on time) | Marked lightcurve |
|---|---|---|---|---|---|---|---|
| A | 7577 | 6528 | 1 | 1 | 0.01% | 0.02% | 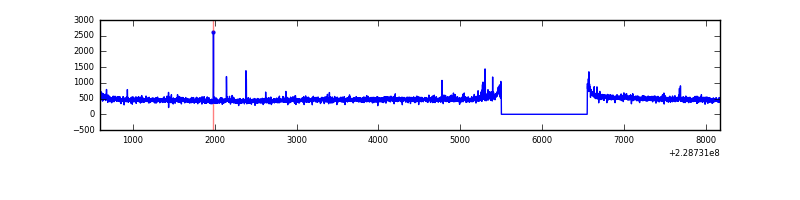 |
| B | 7577 | 6528 | 8 | 8 | 0.11% | 0.12% | 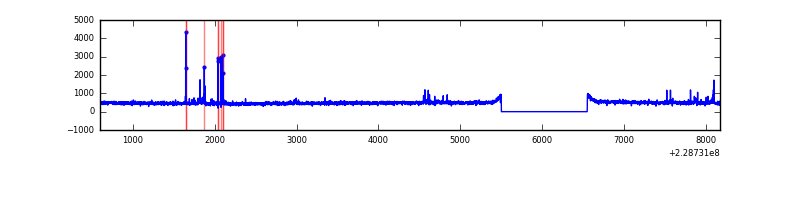 |
| C | 7577 | 6528 | 0 | 0 | 0.00% | 0.00% | 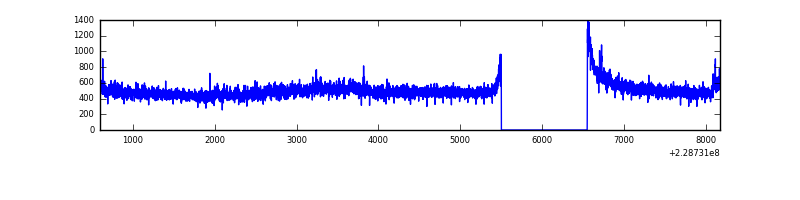 |
| D | 7577 | 6528 | 1262 | 1262 | 16.66% | 19.33% | 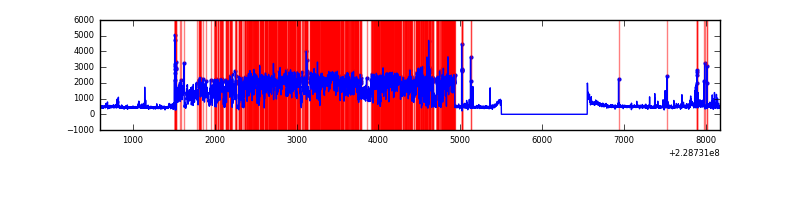 |
Top three noisy pixels from each quadrant. If the there are fewer than three noisy pixels in the level2.evt file, extra rows are filled as -1
| Pixel properties | Quadrant properties | ||||||
|---|---|---|---|---|---|---|---|
| Quadrant | DetID | PixID | Counts | Sigma | Mean | Median | Sigma |
| A | 13 | 251 | 44409 | 269.12 | 795 | 778 | 162.1 |
| A | 0 | 226 | 7588 | 42.01 | 795 | 778 | 162.1 |
| A | 15 | 79 | 7201 | 39.62 | 795 | 778 | 162.1 |
| B | 10 | 16 | 43663 | 279.07 | 793 | 775 | 153.7 |
| B | 0 | 214 | 30635 | 194.3 | 793 | 775 | 153.7 |
| B | 12 | 111 | 15409 | 95.22 | 793 | 775 | 153.7 |
| C | 1 | 16 | 277974 | 1557.84 | 764 | 768 | 177.9 |
| C | 13 | 61 | 5667 | 27.53 | 764 | 768 | 177.9 |
| C | 3 | 202 | 1886 | 6.28 | 764 | 768 | 177.9 |
| D | 13 | 105 | 4212410 | 21107.96 | 740 | 723 | 199.5 |
| D | 5 | 233 | 227523 | 1136.67 | 740 | 723 | 199.5 |
| D | 1 | 52 | 195138 | 974.36 | 740 | 723 | 199.5 |
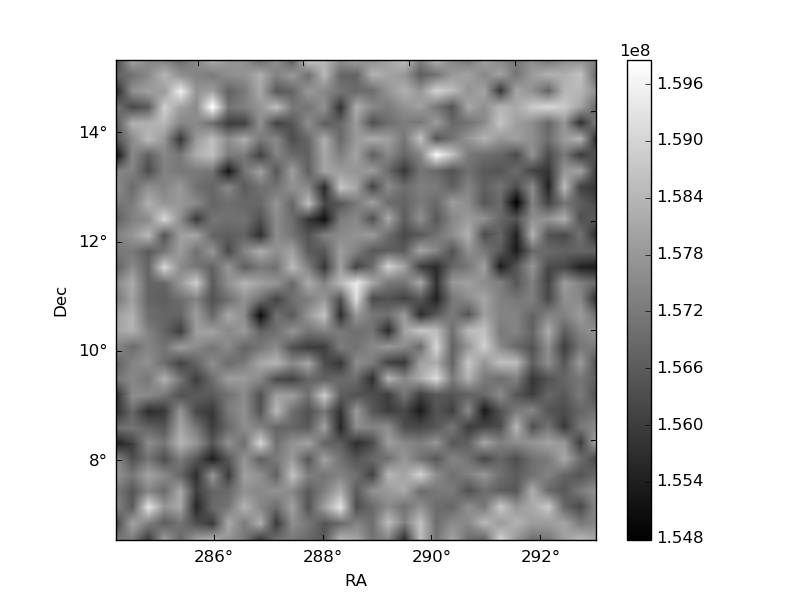
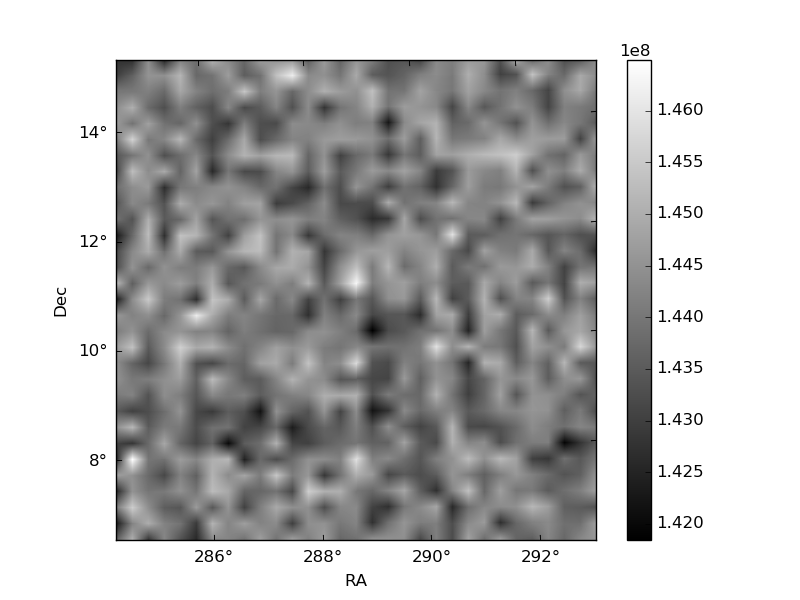
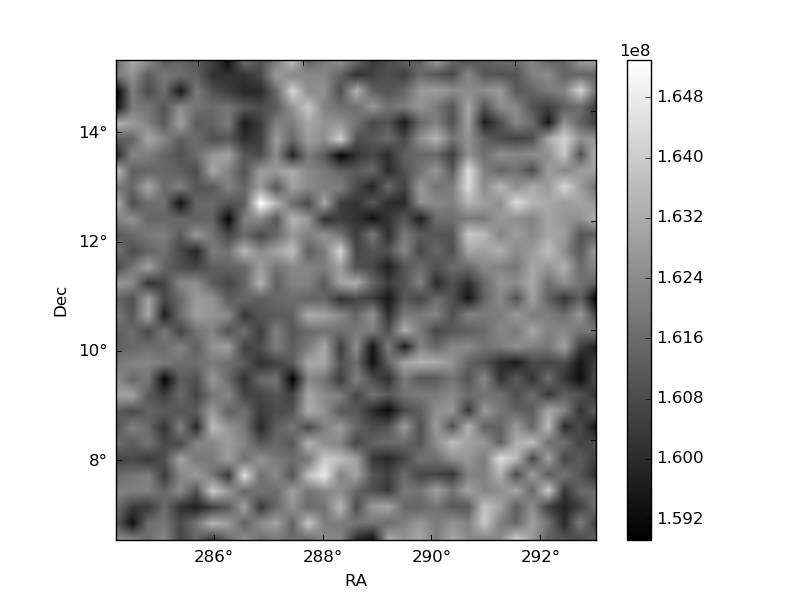
Histogram calculated using DETX and DETY for each event in the final _common_clean file
| Quadrant A |  |
 |
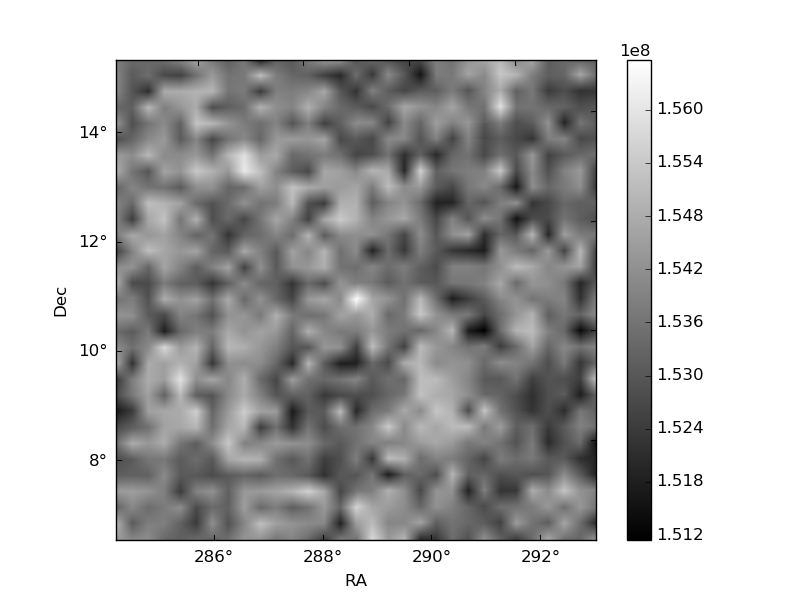
Quadrant B |
|---|---|---|---|
| Quadrant D | 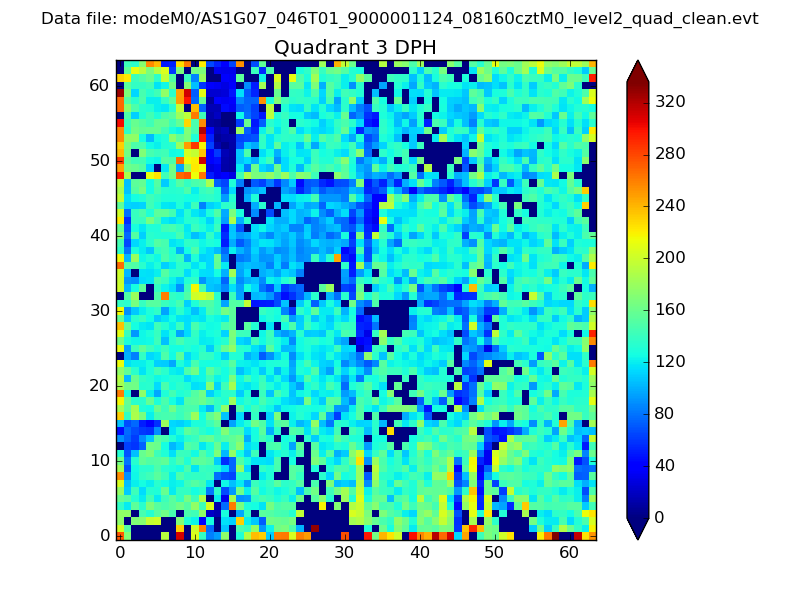 |
 |
Quadrant C |
| Plot type | Count rate plots | Images |
|---|---|---|
| Comparison with Poisson distribution Blue bars denote a histogram of data divided into 1 sec bins. Red curve is a Poisson curve with rate = median count rate of data. |
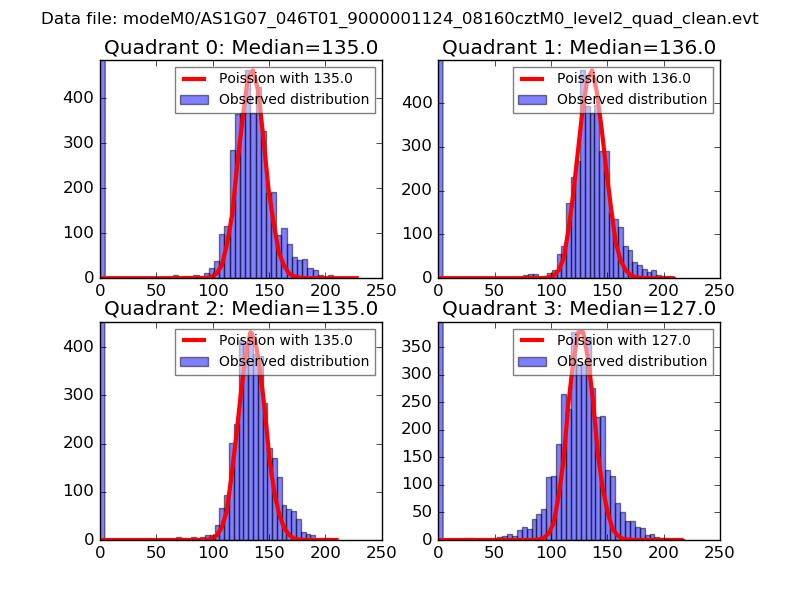 |
 |
| Quadrant-wise count rates Data is divided into 100 sec bins |
 |
|
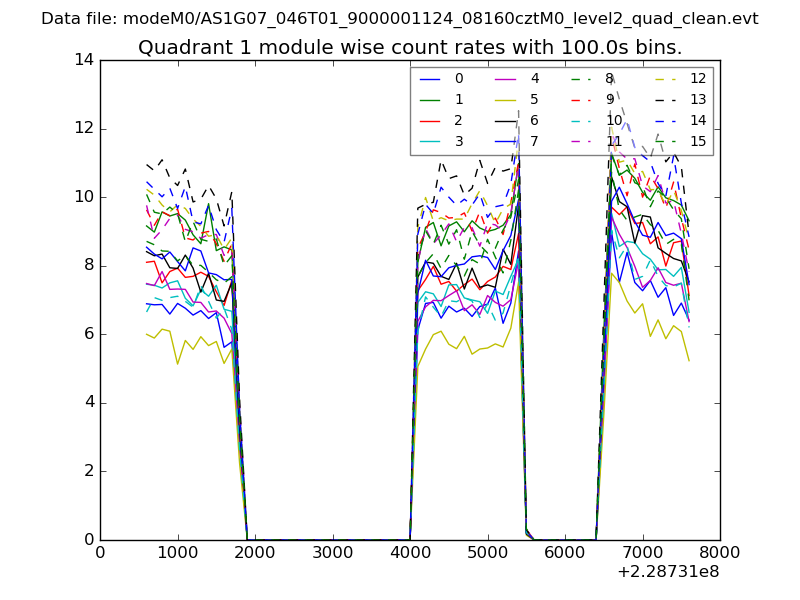
| Module-wise count rates for Quadrant A Data is divided into 100 sec bins |
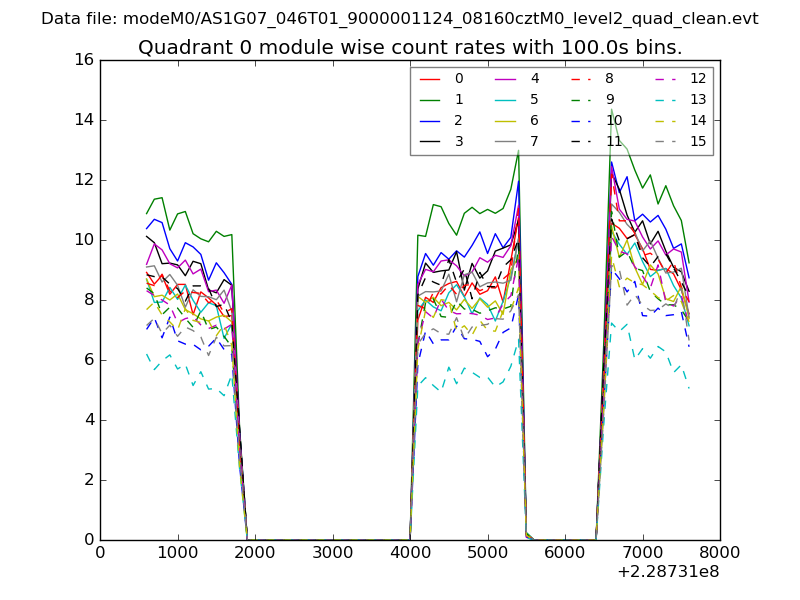 |
 |
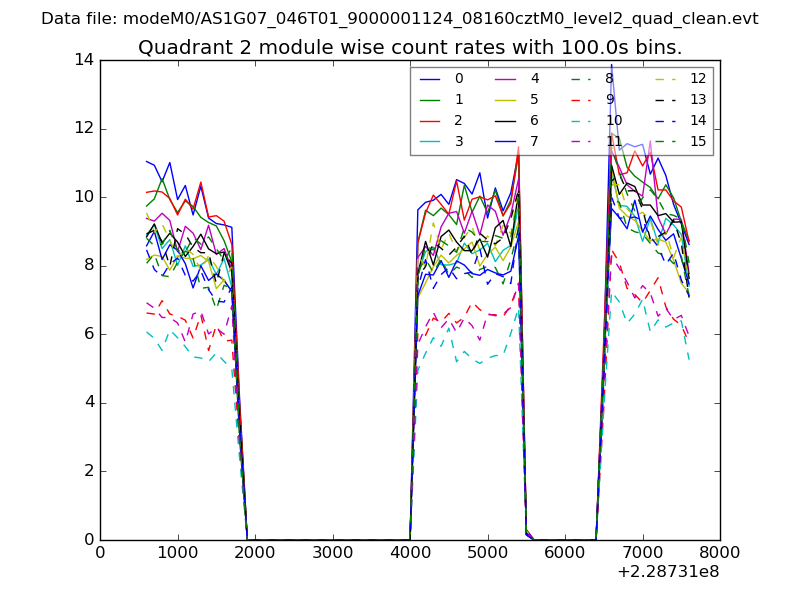
| Module-wise count rates for Quadrant B Data is divided into 100 sec bins |
 |
 |
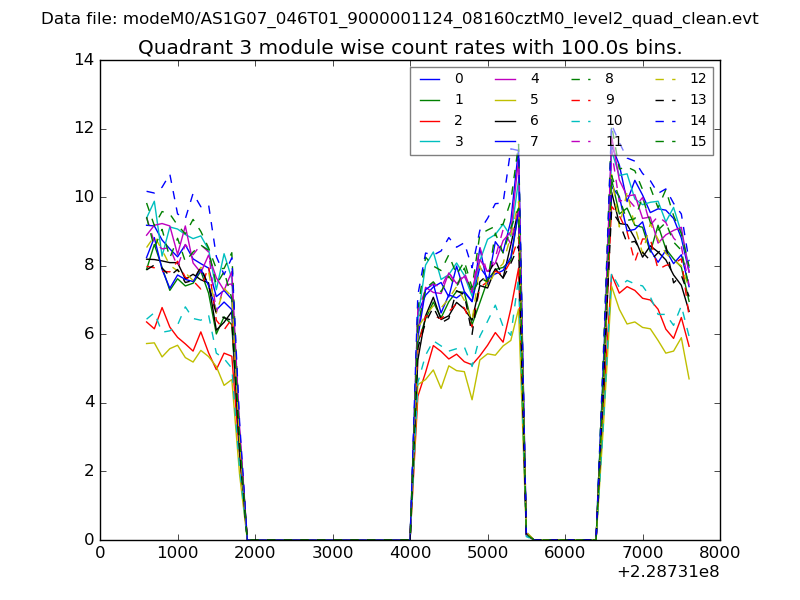
| Module-wise count rates for Quadrant C Data is divided into 100 sec bins |
 |
 |
| Module-wise count rates for Quadrant D Data is divided into 100 sec bins |
 |
 |
| Parameter | Plot |
|---|---|
| CZT HV Monitor | 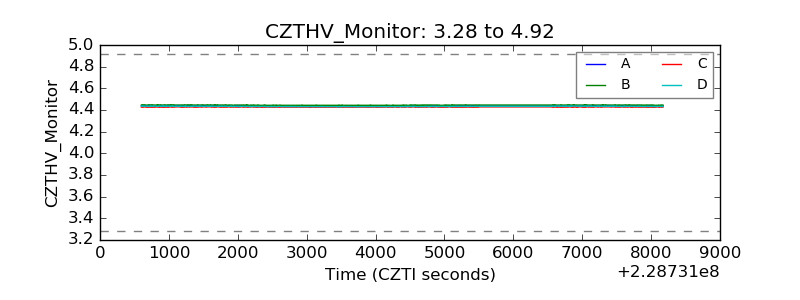 |
| D_VDD | 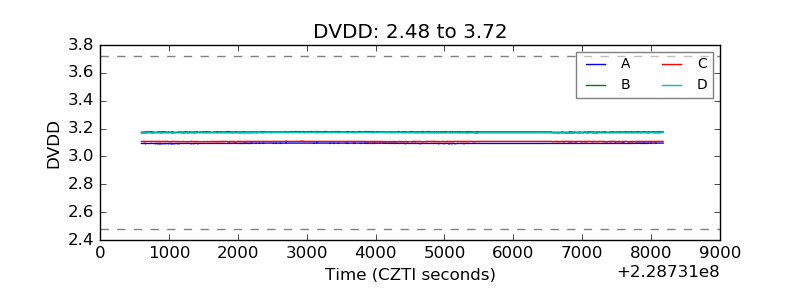 |
| Temperature 1 | 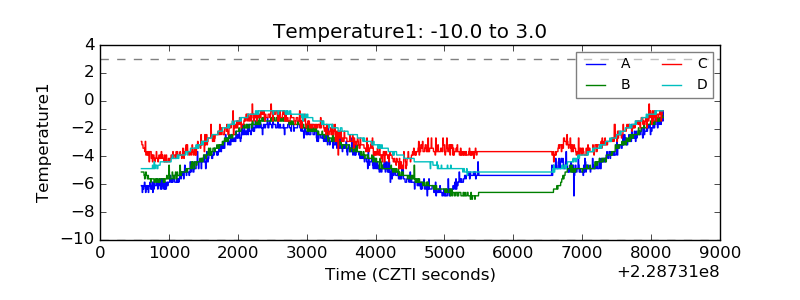 |
| Veto HV Monitor | 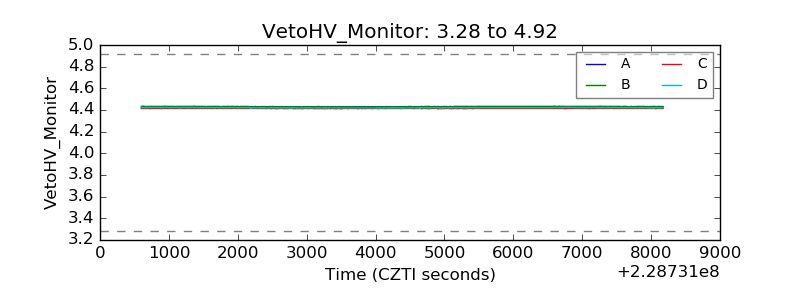 |
| Veto LLD | 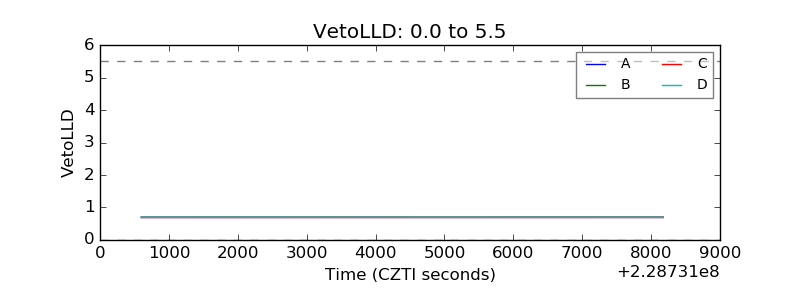 |
| Alpha Counter | 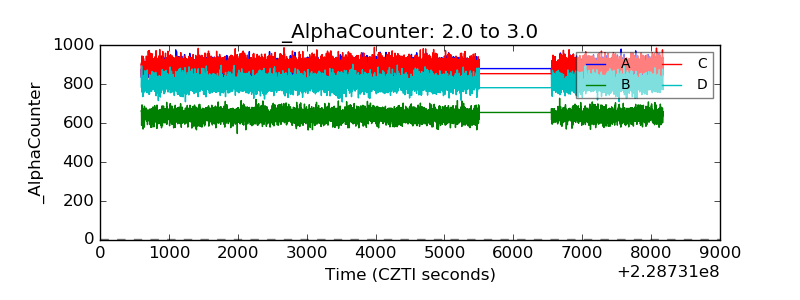 |
| _CPM_Rate | 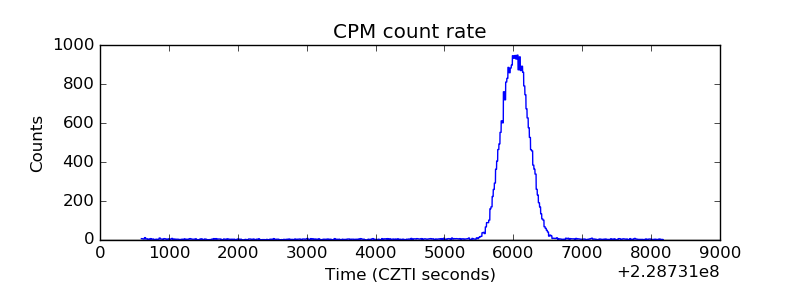 |
| CZT Counter | 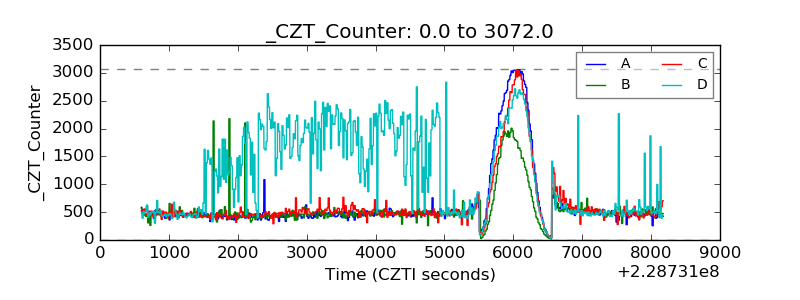 |
| +2.5 Volts monitor |  |
| +5 Volts monitor | 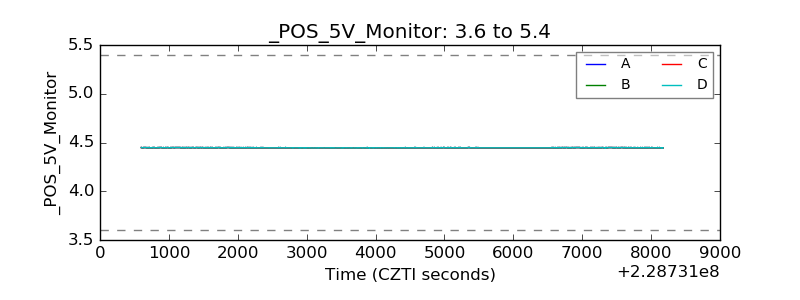 |
| _ROLL_ROT | 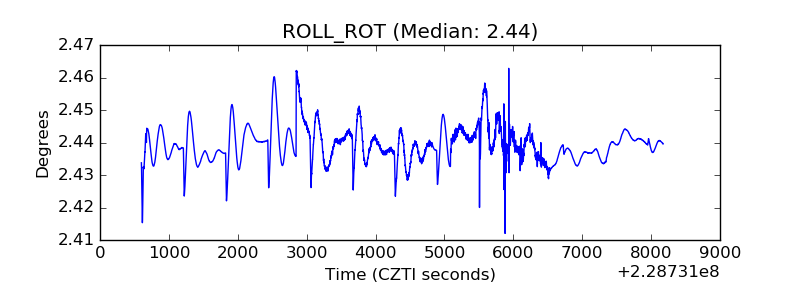 |
| _Roll_DEC | 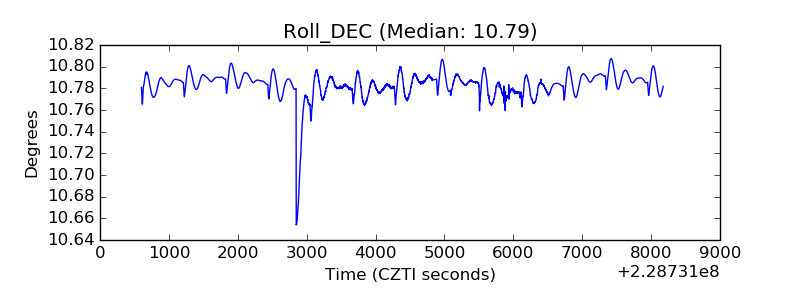 |
| _Roll_RA | 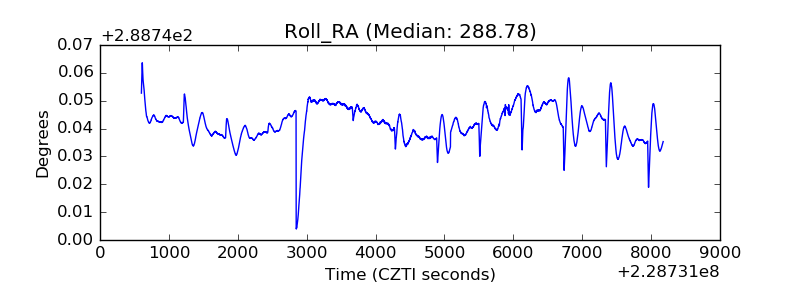 |
| Veto Counter | 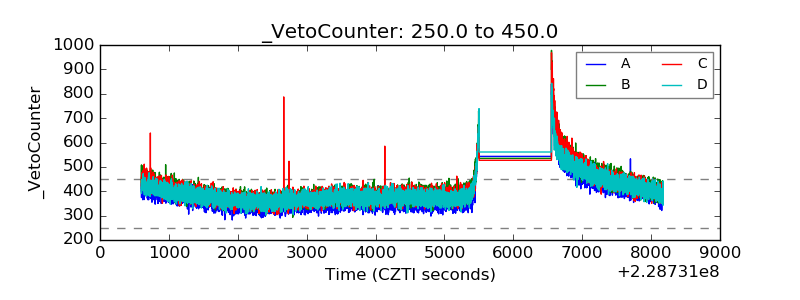 |