| Param | Original file | Final file |
|---|---|---|
| Filename | modeM0/AS1G07_046T01_9000001124_08161cztM0_level2.evt | modeM0/AS1G07_046T01_9000001124_08161cztM0_level2_quad_clean.evt |
| Size (bytes) | 483,174,720 | 78,122,880 |
| Size | 460.8 MB | 74.5 MB |
| Events in quadrant A | 3,113,183 | 488,775 |
| Events in quadrant B | 3,283,612 | 491,032 |
| Events in quadrant C | 3,550,487 | 487,530 |
| Events in quadrant D | 4,259,233 | 459,532 |
| Mode M0 | |||
|---|---|---|---|
| Quadrant | BADHDUFLAG | Total packets | Discarded packets |
| A | 0 | 13074 | 2 |
| B | 0 | 13515 | 1 |
| C | 0 | 14261 | 1 |
| D | 0 | 16702 | 1 |
| Mode SS | |||
|---|---|---|---|
| Quadrant | BADHDUFLAG | Total packets | Discarded packets |
| A | 0 | 126 | 0 |
| B | 0 | 126 | 0 |
| C | 0 | 126 | 0 |
| D | 0 | 126 | 0 |
| Mode M9 | |||
|---|---|---|---|
| Quadrant | BADHDUFLAG | Total packets | Discarded packets |
| A | 0 | 12 | 0 |
| B | 0 | 12 | 0 |
| C | 0 | 12 | 0 |
| D | 0 | 12 | 0 |
| Quadrant | Total seconds | Saturated seconds | Saturation percentage |
|---|---|---|---|
| A | 6292 | 56 | 0.890019% |
| B | 6292 | 77 | 1.223776% |
| C | 6292 | 54 | 0.858233% |
| D | 6292 | 296 | 4.704387% |
Noise dominated data is calculated using 1-second bins in cleaned event files. If a bin has >2000 counts, and if more than 50% of those come from <1% of pixels, then it is considered to be noise-dominated and hence unusable.
| Quadrant | # 1 sec bins | Bins with >0 counts | Bins with >2000 counts | High rate bins dominated by noise | Noise dominated (total time) | Noise dominated (detector-on time) | Marked lightcurve |
|---|---|---|---|---|---|---|---|
| A | 7447 | 6293 | 1 | 1 | 0.01% | 0.02% | 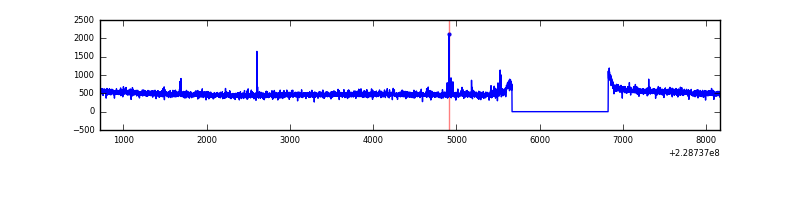 |
| B | 7447 | 6293 | 11 | 11 | 0.15% | 0.17% | 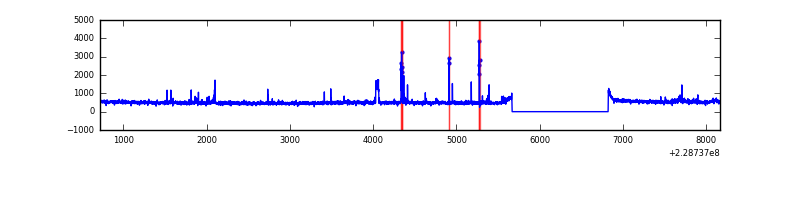 |
| C | 7447 | 6293 | 0 | 0 | 0.00% | 0.00% | 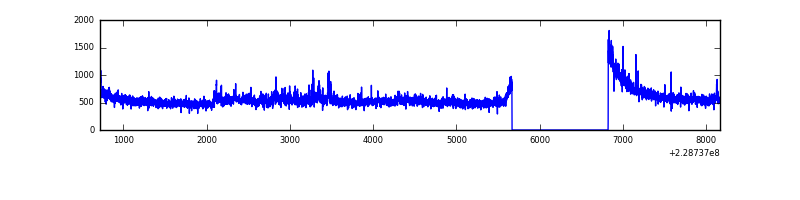 |
| D | 7447 | 6292 | 212 | 212 | 2.85% | 3.37% | 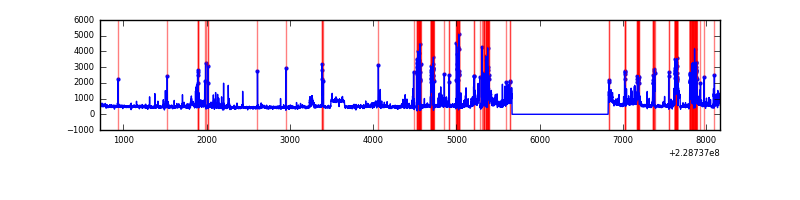 |
Top three noisy pixels from each quadrant. If the there are fewer than three noisy pixels in the level2.evt file, extra rows are filled as -1
| Pixel properties | Quadrant properties | ||||||
|---|---|---|---|---|---|---|---|
| Quadrant | DetID | PixID | Counts | Sigma | Mean | Median | Sigma |
| A | 13 | 251 | 26683 | 159.59 | 800 | 785 | 162.3 |
| A | 0 | 226 | 7619 | 42.11 | 800 | 785 | 162.3 |
| A | 12 | 194 | 7053 | 38.62 | 800 | 785 | 162.3 |
| B | 4 | 173 | 52647 | 345.36 | 793 | 777 | 150.2 |
| B | 10 | 16 | 38904 | 253.86 | 793 | 777 | 150.2 |
| B | 0 | 214 | 34891 | 227.14 | 793 | 777 | 150.2 |
| C | 1 | 16 | 556655 | 3134.54 | 768 | 772 | 177.3 |
| C | 13 | 61 | 5881 | 28.81 | 768 | 772 | 177.3 |
| C | 3 | 202 | 1876 | 6.23 | 768 | 772 | 177.3 |
| D | 12 | 227 | 590222 | 2901.17 | 757 | 742 | 203.2 |
| D | 1 | 52 | 513848 | 2525.29 | 757 | 742 | 203.2 |
| D | 5 | 233 | 98323 | 480.25 | 757 | 742 | 203.2 |
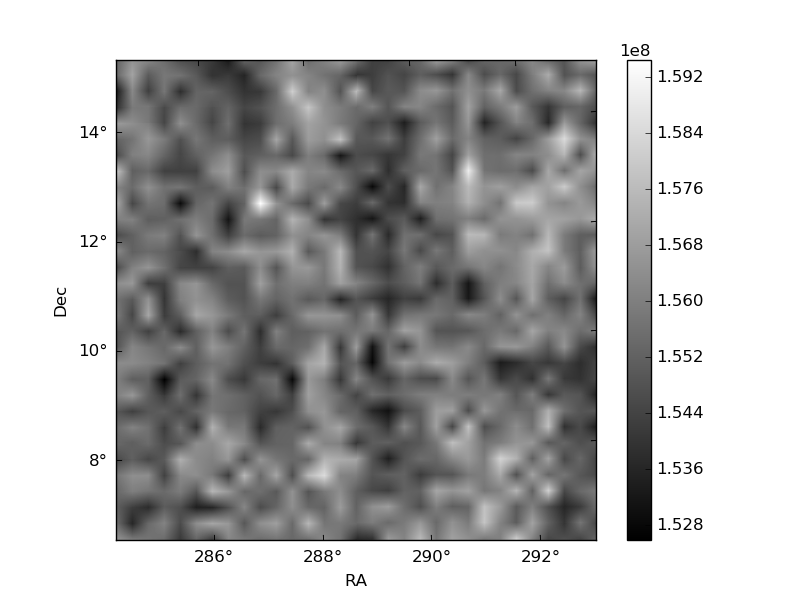
Histogram calculated using DETX and DETY for each event in the final _common_clean file
| Quadrant A | 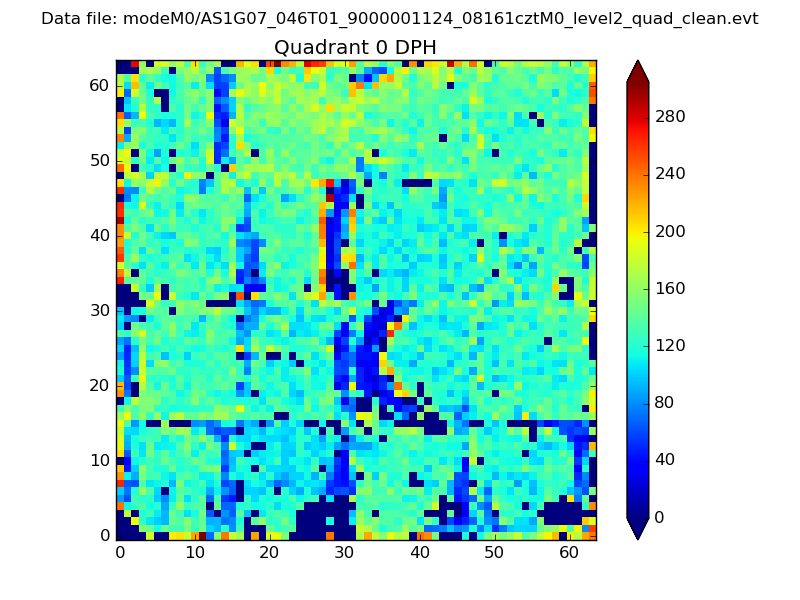 |
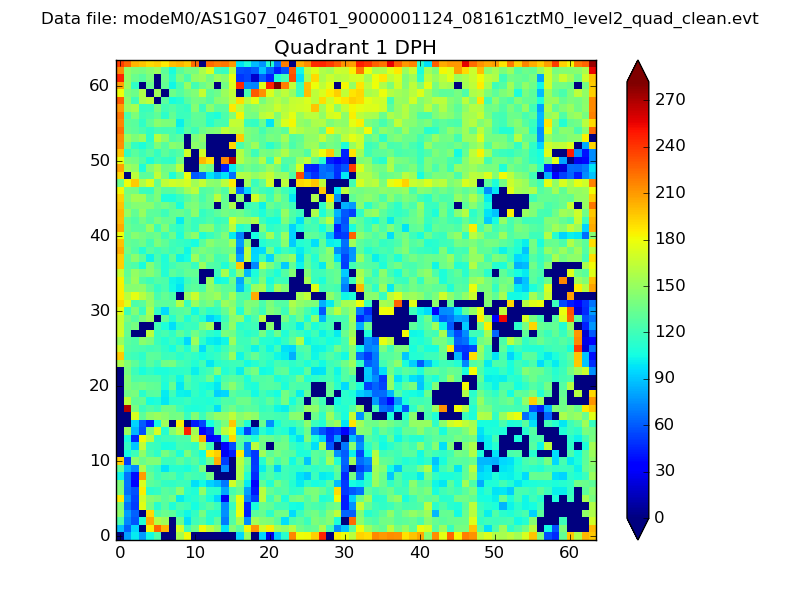 |
Quadrant B |
|---|---|---|---|
| Quadrant D |  |
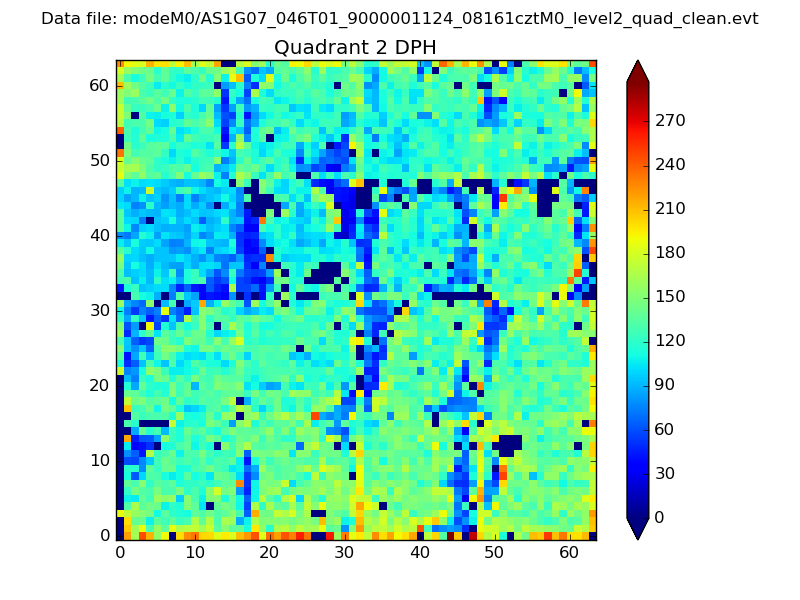 |
Quadrant C |
| Plot type | Count rate plots | Images |
|---|---|---|
| Comparison with Poisson distribution Blue bars denote a histogram of data divided into 1 sec bins. Red curve is a Poisson curve with rate = median count rate of data. |
 |
 |
| Quadrant-wise count rates Data is divided into 100 sec bins |
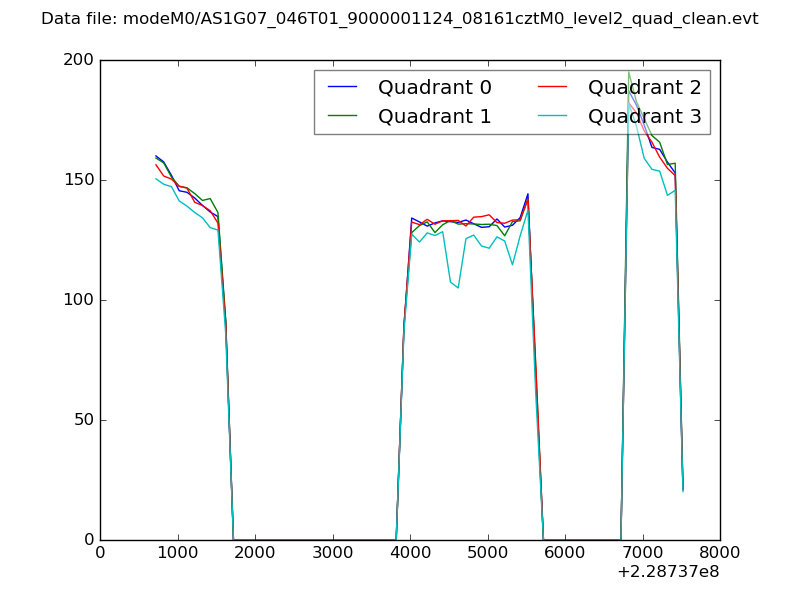 |
|
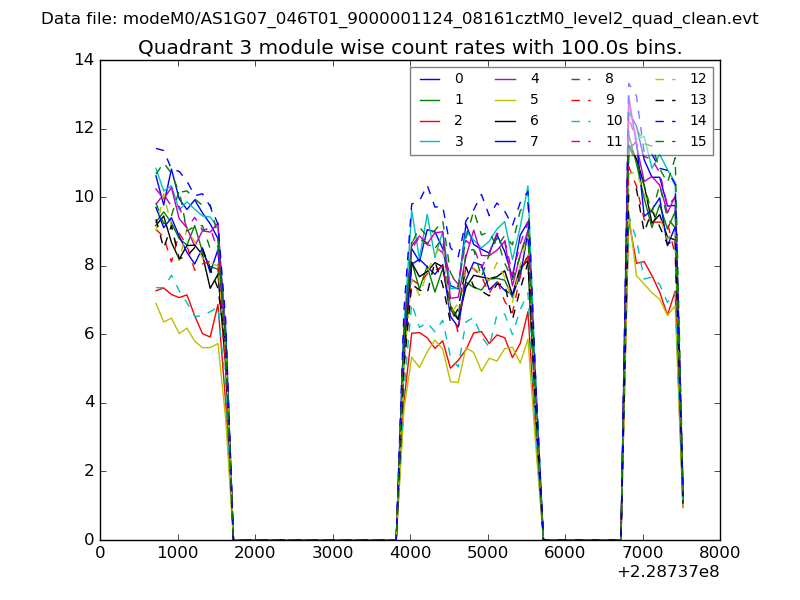
| Module-wise count rates for Quadrant A Data is divided into 100 sec bins |
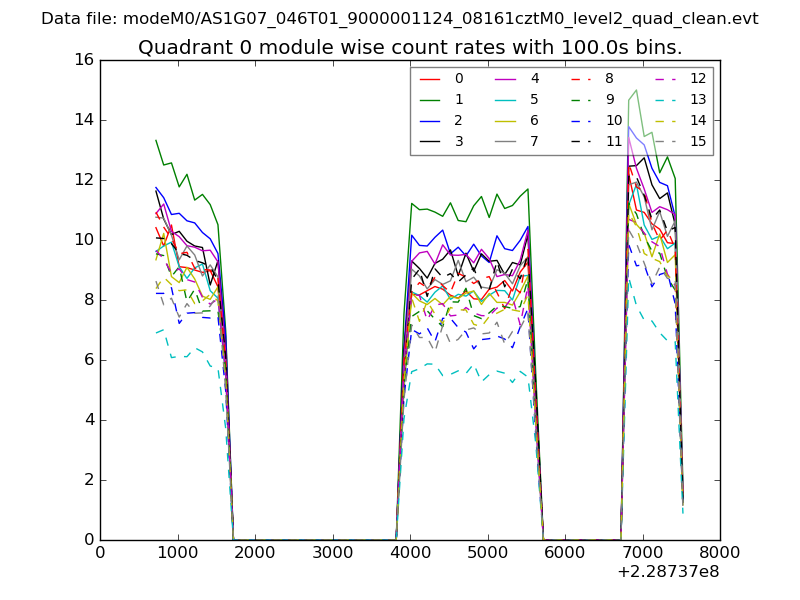 |
 |
| Module-wise count rates for Quadrant B Data is divided into 100 sec bins |
 |
 |
| Module-wise count rates for Quadrant C Data is divided into 100 sec bins |
 |
 |
| Module-wise count rates for Quadrant D Data is divided into 100 sec bins |
 |
 |
| Parameter | Plot |
|---|---|
| CZT HV Monitor |  |
| D_VDD | 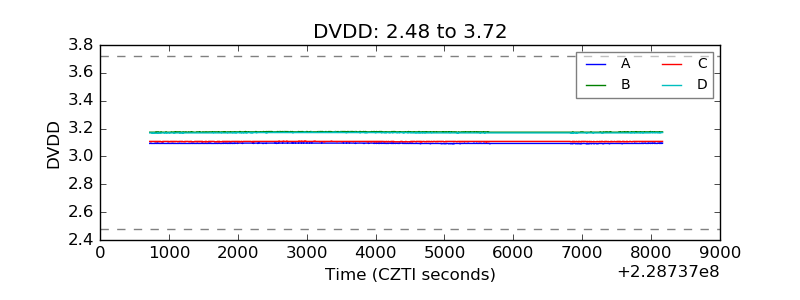 |
| Temperature 1 | 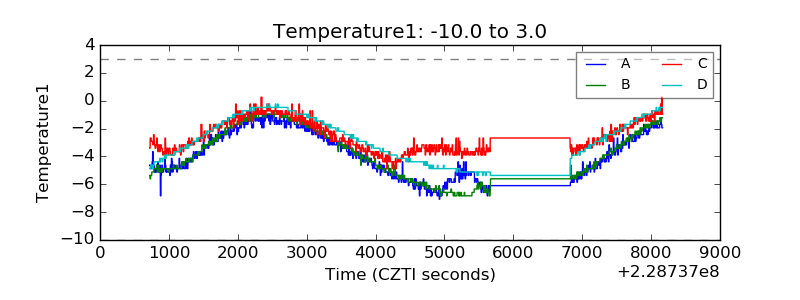 |
| Veto HV Monitor | 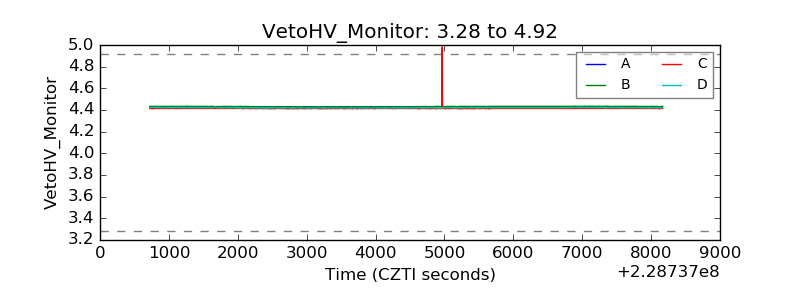 |
| Veto LLD | 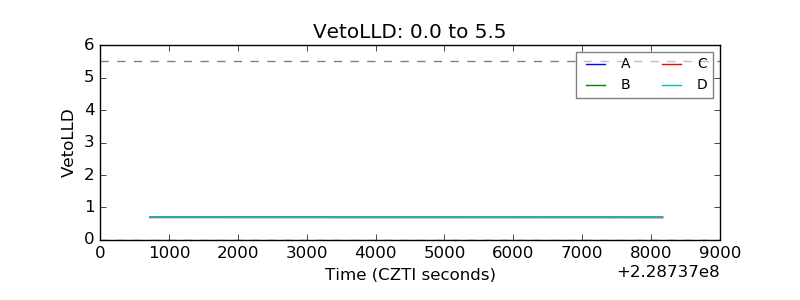 |
| Alpha Counter | 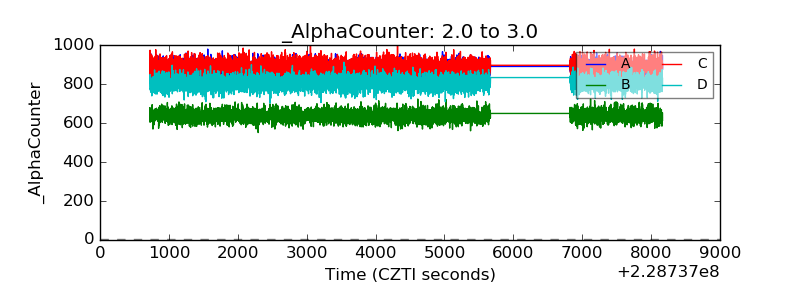 |
| _CPM_Rate | 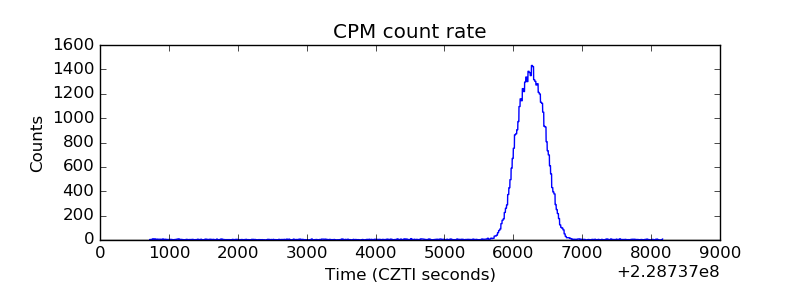 |
| CZT Counter | 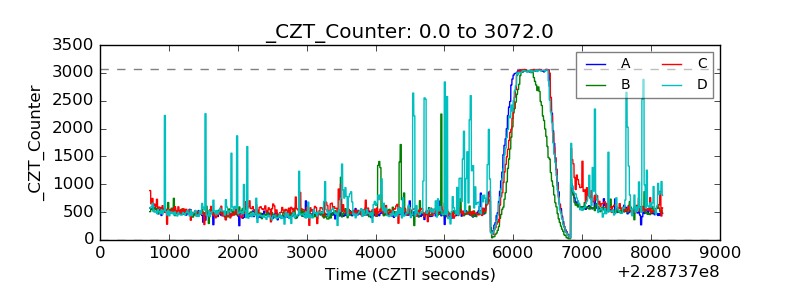 |
| +2.5 Volts monitor |  |
| +5 Volts monitor |  |
| _ROLL_ROT | 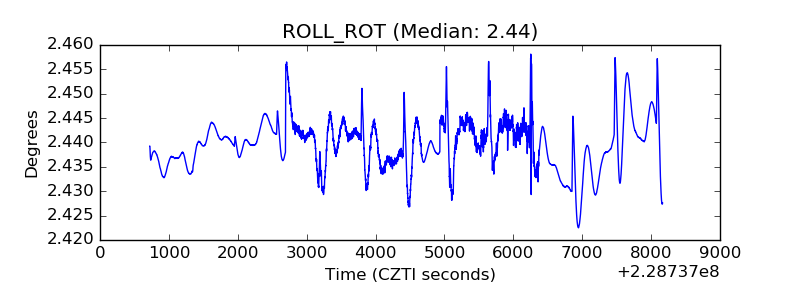 |
| _Roll_DEC | 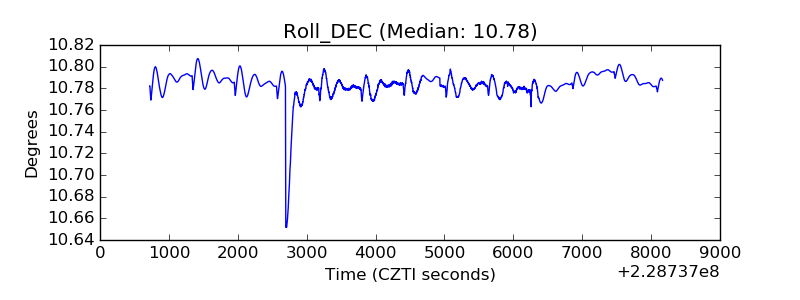 |
| _Roll_RA | 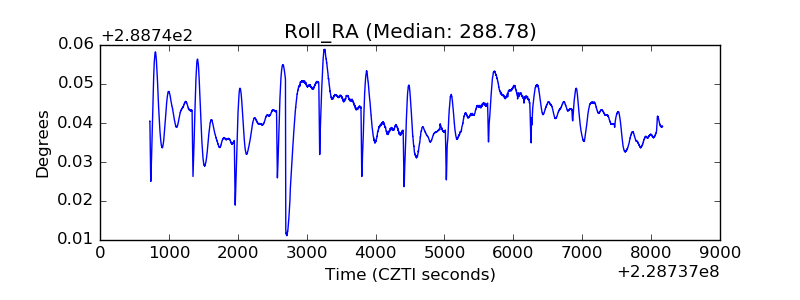 |
| Veto Counter | 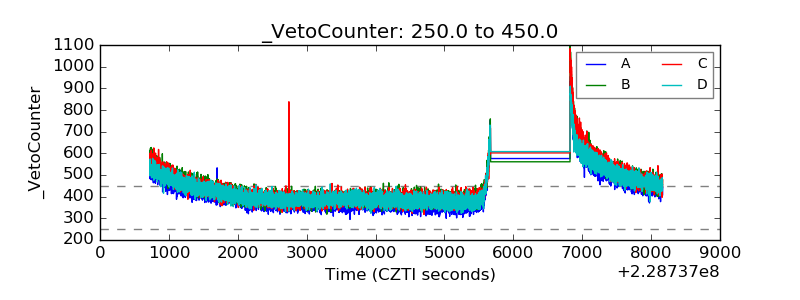 |